Shared Clustering for My Wife’s Aunt Suzy

My wife’s brother recently took a YDNA test. I can’t do an AncestryDNA Shared Clustering for my wife’s father because he didn’t test at AncestryDNA, but I can look at Aunt Suzy’s Shared Clustering

What Is Shared Clustering?

Shared Clustering is looking at shared DNA matches. The theory if you have a bunch of shared matches that also match each other they are likely from a common ancestor. Jim Bartlett got the idea of walking back your shared clusters. That means starting with your more recent clusters and going back through the years to check on and verify your older clusters which represent more distant ancestors. Jim used Jonathan Brecher’s Shared Clustering Program.

Let’s Download Aunt Suzy

I used Jonathan Brecher’s program to download Aunt Suzy’s AncestryDNA results:

Aunt Suzy also goes by Virginia which is probably a more official name. Suzy has over 68,000 total DNA matches. That should take a couple of hours to download. Once the download is down I’ll be able to look at Suzy’s clusters.

What I Expect Based on Suzy’s Ancestry

I already know what to expect in general from this excercise. Half of Suzy’s ancesty is French Canadian. They will result in many matches. The other half is Irish and they will result in fewer matches and shared ancestors.

Suzy’s dad was from an Irish background. Suzy’s mom was more recently from French Canada.

A Test Run of Shared Clustering

Suzy has 82 third cousins. Where do I set my first cluster level? Ancestry says that Suzy should start getting third cousins at 199 cM. However, I clicked through a lot of Suzy’s actual cousins and the third cousins didn’t show up until somewhere bettween 128 and 118 cM. So I’ll set the first cutoff at 123 cM. Odd number:

This was good enough to give me a paternal and maternal view of Suzy’s ancestry:

Cluster 1 is paternal and Cluster 2 is maternal. The thing that looks like a Red Cross plus sign in the middle would be Suzy’s closer relates. They match on her father’s and mother’s sides.

I’m going to put Suzy’s cluster results in a chart sorting her clusters by grandparent:

Spoiler alert is that Suzy should have a lot of LeFevre matches. I could put in Suzy’s paternal and maternal single clusters in the chart, but that would be a waste of space. Instead, I’ll bring Suzy’s cluster level down to a maximum of 50 cM from 123 cM:

Still there are only three numbered clusters, though, as above, I can see clusters within the clusters. I’ll go lower still.

At a 40 cM Limit, Suzy Has 8 Clusters

I’ll be happy to start here:

Things get a bit blurry at this level. There are 216 matches on this chart. They are not all in clusters, but most of them are.

Cluster 1

This should be easy:

Here as a Common Ancestor, Joseph Pouliot is listed as well as Pepin. However, this relationship goes back several generations:

Maybe not so easy. The Pouliot that I was thinking of is in Cluster 5:

Three of the matches have the common ancestor of Joseph Pouliot and Josephine Fortin:

I’ve been in touch with Fred. Because there are two common ancestors, I don’t know which one the DNA goes with, so for now I choose the daughter in Virginia’s line who is Emma Pouliot:

On to Cluster 2

I put Cluster 1 on hold. Cluster 2 is quite large:

In order to tame it, I retrieved all the common ancestors from Cluster 2 and put them in alphabetical order:

This name comes up quite often:

However, this goes quite a ways back. I think I need a new set of clusters. I’ll go back up to 45 cM to see if this makes things simpler:

5 Clusters for Suzy at 45 cM

The thought is, that if these clusters are obvious, they should map to the 40 cM clusters.

Cluster 1 Is Large

By the common ancestor names, this must be a LeFevre cluster. Here is a popular common ancestor:

One step backward, two steps forward?

Cluster 2

This should be the same Cluster that Fred was in above:

Cluster 3 Goes To Old Common Ancestors

This was the problem I was having with Cluster 1 at 40 cM. In fact, I’ll go to Access to compare the 40 cM clusters with the 45 cM Clusters:

I start with the 40 cM clusters as there are more with them. I join them to the 45 cM clusters by the Test ID. Then for the join I choose option 2. That says include all the records from Virginia’s 40 cM cluster and only those records from Virginia’s 45 cM Clusters where the joined fields are equal. Then on the part below in the query screen, I reverse the order with the 45 cM results first, so it will look more like my summary table.

It is possible to do this without Access but it would take quite a bit of time. I also group my query results. This takes out the duplicates:

This shows that the Cluster 3 I was looking at with the 45 cM cutoff, maps to Cluster 2 at 40 cM. Cluster 2 at 40 was the same one I looked at above and was having trouble with because the common ancestors were so ancient. I then took the clusters up to 47 cM:

This shows Clusters 4 and 5 at 47 cM. Cluster 4 is the more recent Pouliot Cluster. That tells me that there are a lot of connections between the two Clusters and that the bigger cluster must be an ancestor of Pouliot (or Fortin).

Here are the same two corresponding clusters at th 45 cM cutoff:

Now they are Clusters 2 and 3. As the larger cluster is an ancestor of Pouliot, I’ll extend Emma Pouliot’s tree:

This brings Suzy out to her 5th cousin level. However, some of the common ancestors were out at the 6th cousin level. The confusion could be that there are two Trembely or Tremblay lines. However, both Tremblay lines go through Josephine Fortin. Here is her line with the Cluster 3 common ancestors highlighted. Actually, these are the Cluster 2 Common ancestors from the 40 cM run:

All these common ancestors funnel down through Emma Fortin. Imagine that you are John Brecher’s computer program and you had all of these ancestors. What would you do? You would probably come up with something like Cluster 3.

Bottom line:

Here I mapped Cluster3 at 45 cM to Cluster 2 at 40 cM. It’s a lot of work to map one Cluster, but I feel as though I got it right.

Cluster 4 at the 45 cM Cutoff

Cluster 4 is off to the bottom left of Cluster 3. Cluster 4 has some affinity with Cluster 3 as can be seen by some of the matches to the left of Cluster 4 and underneath Cluster 3. Cluster 4 at 45 cM maps to Cluster 1 at 40 cM. This is one that I got stuck on above.

I’ll take what I learned with Cluster 3 and apply it to Cluster 4. I’ll just say that this Cluster goes to Joseph Pouliot born 1848:

Above I highlighted the AncestryDNA suggested Common Ancestors for Cluster 4.

Cluster 5 – The First Irish Cluster

So far, I have been dealing with French Canadian clusters. This is the first Irish one.

This Cluster has both of Suzy’s Irish grandparents, so I’d rather not put it in my spreadsheet just now. In general Butler is at the top left and Kerivan is the rest of the Cluster. I note that, based on my previous Access query, this will be mapping to two Clusters at 40 cM.

Back to the 40 cM Clusters

Irish Cluster 5 at 45 cM mapped to Clusters 6 and 7 at 40 cM. I’ll start with those.

In addition, there are now Clusters 8 and 9. Due to close relatives, Cluster 6 has Butler and Kerivan still. Here is the area with just Butler:

I’ll call that 6a.

Clusters 6b and 7

Here are Clusters 6b and 7:

However, both Clusters have the same two common ancestors. It could be that one Cluster favors Kerivan and the other Rooney. I would rather assign them both to the daughter at this point.

Clusters 8 and 9

Clusters 8 and 9 are small. They seem to favor the Kerivan side. One person in Cluster 8 has a tree with 247 people:

I notice he has a Bridget Rooney in his tree. At this point, I could try to build out his tree or wait to see what happens with further clustering. I’ll create a tree as I’m curious. I’m having trouble getting back to Bridget from Alice McCusker. Here is a transcription of her baptismal record:

One of the witnesses was a Patrick Rooney.

It looks like the family was enumerated as McCarty in 1870:

In 1880, Bridget was a widow:

This record pulls things together:

From that record, I get this:

Lawrence and Suzy are third cousins.

I don’t like the look of Cluster 9, so I’ll ignore it for now:

When I say I don’t like the look of it that is because it appears that this could be two small clusters.

Clusters 3 and 4

In my mapping, the previous Cluster 1 went to Cluster 4, so that is LeFevre. Here are the listed Common Ancestors for Cluster 4:

The Butler entries are too close for clustering. Most of the Common ancestors seem to go back to Lazare Lefevre and Adelaide Boure:

However, one went back to Methot and Anger:
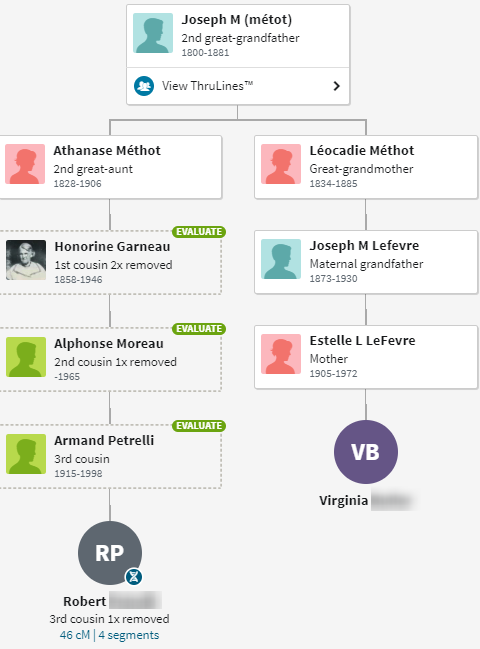
Ancestry would like me to evaluate this tree. I’ll bite.

I am questioning why Armand Petrelli is the son of Alphonse Moreau. The 1930 Southbridge Census has Armand as the son of Joseph Petrelli:

Actually, I see what happened.

Robert got his tree backwards:

His mother is Moreau. His maternal grandfather should be Alphonse Moreau – ot Joseph Petrelli.

Here is Jeanette in 1920:

The other problem is the Athanase I have in my tree is a man and Robert’s connection to me is shown through a female Athanase.

I think I’ll just assume that this is an earlier LeFevre Cluster rather than Methot:

That leaves the new Cluster 3:

Cluster 3 has four connections to Cluster 2 (Fortin) and two to 4 (LeFevre). I don’t have a lot of information, so I’ll just add Cluster 3 near Fortin:

This could be a long Blog, but I like that the clusters seem to be falling into place – even with the French Canadian families.

Suzy’s 18 Clusters at 35 cM

This looks like the 1,000 foot view:

In Access here is how the previous clusters map to this set of clusters:

This is interesting because the Cluster 3 I was looking at above, maps to 7 and 8 but Cluster 2 also maps to Cluster 7.

Cluster6 mapped to 9, but I had a 6a and 6b. It turns out that the Cluster 9 has not separated out yet due to Suzy’s close relatives being in that cluster. From above, it looks like a lot of the action is in the French Canadian quarters.

Looking At the Irish Side – Down to 30 cM

I’ve decided to take a new easier approach. I am more interested in the Irish side at this point. The French Canadian side is interesting, but much of the genealogy is seemingly well-defined. At least the answers seem to be there if you dig deep enough. Describing the French Canadian clusters may be interesting, but it is a lot of work. I had some luck above with Rooney, so I’ll stick with the Irish and go down another level to 30 cM.

I ran the Shared Clustering program and came up with some more large French Canadian Clusters. I notice there is a button where you can filter out the larger clusters.

I thought I wanted to use the first box, but that is for the entire file. I want the second box to get rid of the large French Canadian clusters. Without this filter I get:

  • Cluster 2 goes from row 15-266
  • 21 goes from 441 to 485
  • 22 which I want goes from 487 to 509 or about 23 rows

I’ll try setting the cutoff at 40 members. I like this because I can now see what is going on:

This reduces the number of clusters and changes the cluster numbers, but that is OK. I’ll just put another heading on my Summary Chart:

I brought these new restricted clusters into Access and compared them:

Here I have only 5 clusters. That made a huge difference. Without the 40 member cutoff, I get 31 clusters. Life just got simpler.

Above Cluster 9 goes to Clusters 1 and 2. Cluster 9 was the one that I had split previously. Here are the new Clusters 1 and 2:

Cluster 1 is the Kerivan side and Cluster 2 is the Butler side.

This is interesting because former Clusters 10 and 11 reclustered into the new Cluster 1. Now I’m curious to see how the unfiltered Clusters would have mapped:

This goes off the page above. One unexpected result is that under this configuration the previous Cluster 9 now only maps to one Cluster 4. However, now the old Clusters 10 and 11 map to their own clusters. With the restriction of the large clusters, I was expecting no effect on the Irish clusters, only on the large French Canadian clusters. However, the restriction also had an effect on the Irish Clusters.

The bottom line is that I could work with either the restricted or non-restricted clusters, however, for the purpose of looking at the Irish clusters, I would rather deal with the restricted clusters.

Irish Cluster 1

At 30 cM with a restiction 40 per cluster, I get two Irish Clusters. The first one is the Kerivan side. The first person on the list is not in the cluster but has matches to Cluster 1. He has a small tree with a Hanrahan in it. The fourth on the list shows a correclation to Cluster 1 and has a public tree. I don’t see any obvious match and would prefer not to build out this tree.

The last person before the Kerivan Cluster 1 has a curious common ancestor named Mary:

This looks worth pursuing. The relationship is shown as half first cousin, but it is likely a full cousin relationship unless Mary married two different Rooney’s. Here is Suzy’s tree starting with her Kerivan grandfather:

The Ancestry shared ancestry tree looks suspicious also because it appears to show that there were two brothers named Timothy Rooney. I’ll try to recreate Daniel’s tree to see what is going on. I was having trouble with the tree, then I found a chart I had made a while ago:

This shows John Henry descending from a first wife of Timothy Rooney. I’ll put that on my new Rooney Tree:

I’ve ended up with a half relationship after all. However, it now appears that Daniel and Suzy are 1/2 third cousins once removed. I tried to distinguish the two branches with different colors.

The next person in Cluster 1 who I haven’t looked at yet is FG:

FG has an unlinked tree:

I noticed the name McCusker:

I like the easy ones. See, I’m a Rooney specialist.

Andrew from Cluster 1

The next person in Cluster 1 with a usable tree is Andrew:

After a little snooping around Ancestry, I came up with this:

Andrew goes on my Rooney Tree:

That brings up a point. The first three matches are not Kerivan matches. Technically, that makes Cluster 1 a Rooney Cluster.

Russell and Sandra

Russell and Sandra should be easy as they show Common Ancestors at Ancestry:

Bob’s Tree Looks Hopeful

Bob, who is in Cluster 1, has this tree:

Here is a quick tree to get him on my Chart:

Donna and John

I have a note that Donna is the mother of John and that I wrote a Blog about John. Here is John at Ancestry:

It looks like a good time to start a separate Kerivan Tree:

I found Donna’s sister in the mix also.

H6 and a More Challenging Tree?

H6 is in Cluster 1 with a match of 141 cM:

These families lived in New Jersey and some came from Sweden or Italy, so I had trouble getting this back to Kerivan easily.

On To Butler Cluster 2

The first two with small unlinked trees are Kerry and Janice.

Kerry’s tree:

Janice’s tree:


I’m thinking it would be a lot of work to track these trees down. Here is some more on Mary Ann:

I decided to look into this tree based on the fact that I also found a Rooney in the ancestry. Mary Ann’s mother was Rose Rooney.

That could explain the link of Cluster 2 to the Rooney Cluster 1:

Butler’s I’m Already Tracking


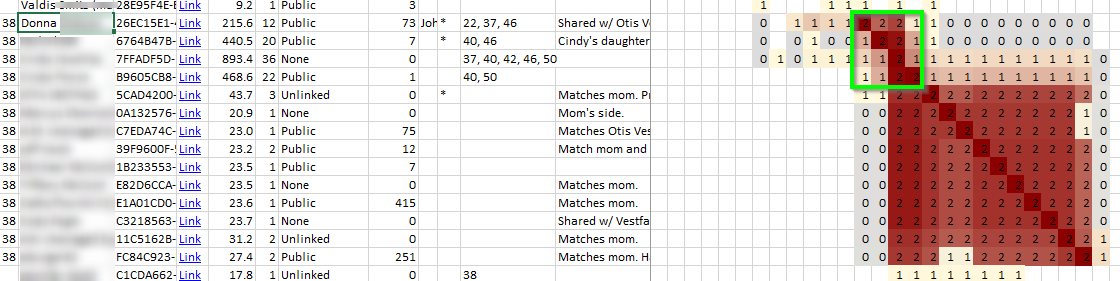
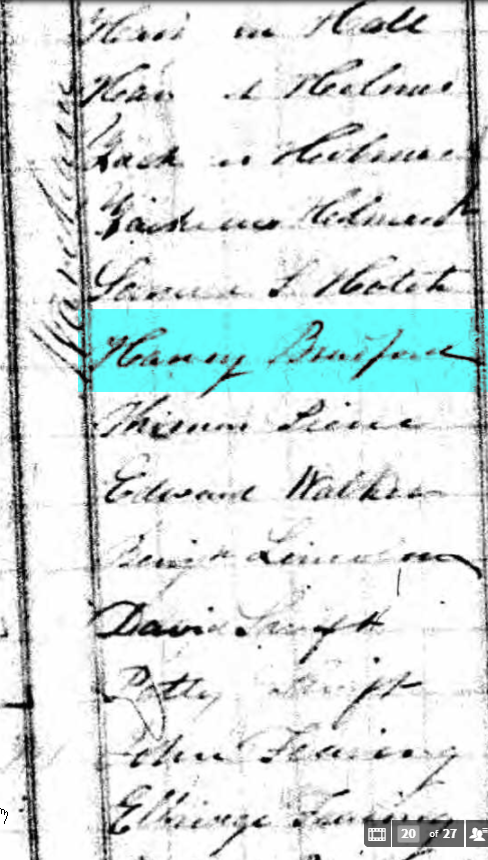
I already had Donna, Janice and Barbara. I added Harry also from Cluster 1.

Suzy’s Clusters of 40 Members or Less at 25 cM

I checked Suzy’s clusters at 25 cM without the 40 member limit and she had 69 clusters. With all those clusters, I couldn’t see all the clusters on the chart even at the minimum 10%. With the 40 member limit, Suzy had 12 clusters:


I’m curious what these clusters will show.

Running the 25 cM Clusters by Access

I’ll compare these clusters to the 30 cM clusters in Access.

This says that Clusters 1 and 2 both split three ways. That means that there were also 6 new clusters. I expect the new clusters were a mix of Irish and French Canadian. It seems odd that only the two Irish Clusters that I was working on at the 30 cM limit mapped as I had 5 clusters previously. I’m guessing that the other three clusters mapped clusters of over 40 members, so were screened out.

Cluster 1

I don’t like how Cluster 1 doesn’t cluster well, but I’ll take a look anyway:

In looking over these 4 mathces, I don’t see an obvious connection. Something more may show up at the 20 cM Cluster run.

Cluster 2

This Cluster seems to have an affinity with part of Cluster 7, which looks like a Kerivan Cluster.

Cluster 3

This mapped from previous Cluster 1. I see one person who has a Rooney in their ancestry. This is a person I looked at in the previous Cluster 1:

I’ll put Cluster 3 here:

However, I’ll have to go back and check in Access to see if that looks right:

It is right as it mapped back to Cluster 11 at the 35 cM limit. Also I see that the Cluster 1 at 35 cM that I had looked at above came from the previous Cluster 2 at 30 cM which was a Butler Cluster.

Cluster 4

Cluster 4 is new. Here is the tree for Suzy’s first match in Cluster 4:

Ancestry has Rooney in green as it notices that name in Suzy’s tree. Thomas Rooney above was said to be from County Roscommon. Here is the largest tree from Jean of Cluster 4:


Timothy Rooney from Suzy’s tree is supposed to be from Leitrim. Daddy Mick Roone is supposed to be from Galoway (Galway?). Thomas above shows from Roscommon. They could all be right and all be related.

Cluster 5

The person above Cluster 5 seems associated with Cluster 5 and has a tree. However, that person also has connection with Rooney Cluster 3. Here is some Rooney information from the tree:

Here is more of the tree:

Suzy has both Rooney and Sullivan ancestry:

The question is whether Cluster 5 is a Sullivan or Rooney Cluster.

I’ll build out the other unlinked tree from Kerry in Cluster 5:

I’m guessing the connection is on the Gilmartin side as that name sounds familiar. However, I couldn’t get the tree to match with a familar surnam, so I gave up for now.

Anyway, based on the Clusters, I should be looking on the Bulter side for these Cluster 5 matches:

It is easy to get thrown off my conmon surnames. That is why we have to pay attention to the shared clusters. However, having said that Cluster 5 did seem to match both Clusters 4 and 6. So for now, I’ll put Cluster 5 on the Butler side:
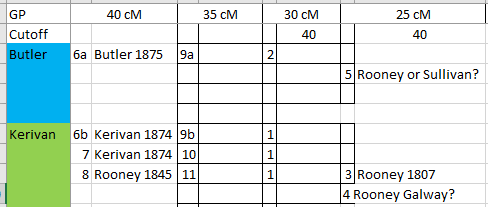
Cluster 6 – A Butler Cluster

This is an interesting Cluster because it includes a Cincinnati branch of Butlers who are related to Suzy’s Butlers, but we don’t know how yet. Here is my guess how they could match:

The George Butler Branch from Cincinnati is on the left. The Edward Butler branch who lived for a while in Cincinnati ended up in the Boston area.

Within Cluster 6 is the Boston group and the Cincinnati group:

The last two matches that I don’t have a green box around are closer Butler relatives.

Cluster 7 – Back to the Kerivan Side

I don’t see any new matches in this group, so no new news.

Clusters 8-12

These are all new clusters:

I don’t know if these are Irish or French Canadian Clusters.

On to the Final Clustering at 20 cM

In this run, I’ll choose 6 cM and have a maximum cluster size of 40 keeping in mind that Ancestry’s shared matches are generally at the 20 cM size or larger. This gives me 20 Clusters and some greater detail on what I had already.

First I’ll pull this new information into Access to see how the Clusters map:

This cut off a few clusters at the top. First I see in the 7th row from the bottom, Cluster 2 that went to 1 has no cluster in the last row. That was the cluster that I was wary of.

Here is a sort by the previous run of Clusters:

This tells me the new Cluster 1 is from the previous Cluster 2. The new Cluster 2 had no precedent. One large tree in Cluster 2 had a Crowley ancestor from Cork, but that may be a coincidence.

Cluster Three maps to previous Cluster 9 which I haven’t looked at. I see another Gilmarting in Cluster 3. His ancestry goes back to Leitrim, Ireland. After clicking through a lot of connections, I would guess that the connection is through Ireland. Also a lot of the connections are in Leitrim and I found one tree with a Rooney in it from Leitrim:

Here is an interesting match between Clusters 3 and 4:

This wants to tie together the Jeremiah and John Rooney Lines.

ThruLines suggests another Rooney Line:

Skipping Down to the Butler Clusters

The new Cluster 11 mapped to the previous Cluster 6:

There is nothing new in Cluster 11 itself, but the interesting part is outside Cluster 11 proper:

However, there are four matches above Cluster 11 that show association with Cluster 11. The first person is managed by Patty who I already know about:

Patty is on the George Butler Line. George Butler came to live in Cincinnati.

The third person in the group of matches that are correlated to Cluster 11 is Regina. Here is her tree:

I recognize the Branch name above.  Here is the marriage record for Alma from 1925:

Another person in the group that is correlated with Cluster 11 is Ryan. Here is his tree:

Both of Ryan’s parents were born in Cincinnati. I need to build yet another tree to see if I can find a match:

With a little snooping around, I was able to get back to Alma Branch:

Christy is on the other side of the Cluster 11:

She fits in on the Boston George side:

Emily married an unrelated Butler.

Next under Christy is Larry:

Larry matches clusters on either side. Here is here small tree:

The tree is interesting as both parents are from Wexford. Some of the Butler ancestors were also from Wexford. Unfortunately, the tree is a bit confusing to follow. Was Bridget’s maiden name Browne or Hesse?

Larry has shared matches with Suzy, Brian, Barbara and Janice:

That seems to make Larry a sort of missing link.

Summary and Conclusions

  • I did a first shot at looking at Suzy’s Shared Clusters
  • Not too far into looking at Suzy’s clusters, her French Canadian Clusters got very large.
  • I restricted the size of Suzy’s clusters so I could look more at her smaller clusters on her Irish side.
  • This lead me to some interesting finds on her Kerivan and Butler side.
  • One Butler match was very interesting as it was shared with two Butler branches that I have been trying to connect.


Some New Hartley STR Results

My last major Blog on Hartley STRs was about 2 and a half years ago. Things don’t always happen quickly in the realm of YDNA. However, as a result of my distant Hartley cousin Steve taking a BIg Y test, he now has new 111 STR results.

Steve, whose Big Y test is processing is now my closest Hartley STR match at the 111 STR level.

My Previous STR Tree

STR trees are difficult to draw and the results can be ambiguous. That is why the Big Y test which uses less ambiguous SNPs is a better test overall. Here is the tree I made over 2 and a half years ago:

Note that there were three Hartley’s who had taken the 111 STR test at the time. My guess is that one was too distant to be considered a match. I am Trawden Hartley in the diagram.

These people are also listed at the Hartley YDNA Project site:

I have highlighted the Hartley’s in my group who have tested to 111 STRs. The difference between the upper and lower group is that the administrator wanted the upper group to do a Big Y or more SNP testing.

  • David Hartley 1797 – this is for Steve who is awaiting his Big Y results
  • William Shepherd Hartley Lancashire 1851 – This is Wray Hartley in the diagram above
  • Thomas Hartley about 1769 – This is the Thornton Hartley in the diagram above
  • Robert Hartley – This is me, Trawden Hartley in the diagram above

In my 2015 Blog, I had this three person Hartley 111 STR signature:

In that signature, I tried to take account of the older SNPs to get the ancestral values. This time, I just took the simple mode of the four tests:


I was having trouble figuring out who Ross was. The reason for this is that he doesn’t appear to be in the Hartley YDNA project. I match the David ancestor above at a GD of 7. I match the other two at more than 9. The problem with doing it by hand is that it is easy to miss things. Fortunately, there is a way in Excel to choose differences.

Also notice that Excel interprets some of the values as dates, so care must be taken to format and copy and paste as text. Excel otherwise interprets 11-14 as 14-Nov.

Here is the new and improved version:

There were some discrepancies between what I did before I what I have now. I’ll go with my new chart for now:

Here I have a new Hartley A11132 Hartley 111 STR Mode. When there was a tie on the mode I used the higher value as I noticed that was what FTDNA did. It may be more accurate to consider the other testers for the first 67 STRs or go back to an earlier SNP as I did previously. For DYS447, I had a Hartley mode of 25 previously, so I’ll use that.

DYS455

I’ll also change the marker before DYS447 which is DYS445. The older SNPs upstream of A11132 had a value of 11, so I’ll use that for the mode. This actually makes a big difference. DYS445 is a very slow marker changing at a rate of 0.16 per 1,000 generations. A male generation is 35.0 years. That means that this marker has a 16% chance of changing every 35,000 years or one chance of changing every 218,750 years! That tells me that the marker should be 11 because the chance of this changing to 12 for Hartley and then back again would take over 400,000 years. However, in another paper, I see a rate of:

DYS445 0.00216

I take that to be 2.16 per 1,000 generations. So that is a big difference. I also see this:

DYS445 0.000918

And I see that the 0.00216 was a mistake. At least I’m not the only one who makes mistakes.

Analyzing the Numbers

Here if a STR value went up, I gave it a pink. If it went down from the mode, I gave it a blue.

Here is some more information on rates:

I think the green, yellow and ornage color-coded numbers are old, but I like the colors as it gives a relative speed of mutation.

Rebuilding the A11132 Hartley STR Tree

The line that I have for the mode is considered to be the oldest value – though there is no guarantee – especially for the faster dark green markers. I added a column on the right for distance from the mode:

That means if I did it right, Steve at the top is closest to the mode or has the oldest combination of STRs. I am next with 4 differences from the mode. I’ll refigure myself with Steve:


Part of why I wanted Steve to take the Big Y test is because he seemed more closely related to me. I already saw that Steve and I shared the older value of 11 for DYS455. I think that is the major split for this group. Then I see that Steve and I also share the newer value of 26 for SYS447. Then after that Steve and I will split off from each other. Steve has the very slow moving newer marker of DYS435 and I have two other newer faster moving light green markers. I may ignore the darker green STRs for now as they could back-mutate more easily.

Here is the first cut:

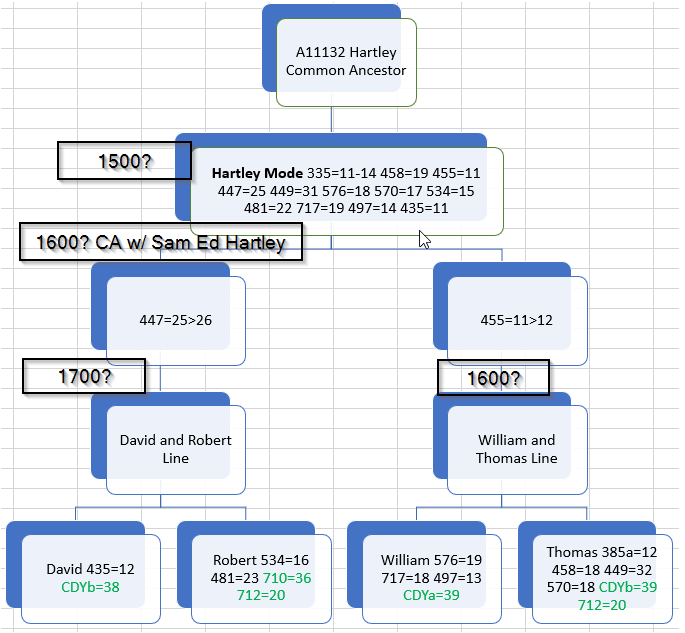
Above is the Hartley Mode. I’m not sure if I displayed this the best way. At some point, an ancestor of William and Thomas had a mutation in marker 455 from 11 to 12. This split the A11132 Hartley line into two lines. Likewise, the assumption is that at some point, an ancestor of David and Robert had a mutation of 447 which went from 25 repeats to 26 repeats. Alternatively, an ancestor of David and an ancestor of Robert could have had parallel independent mutations. However, I think that this would be less likely. We don’t know which mutated first – 447 or 455 so I have them at equal levels.

Finally, everyone ended up on their own branch.

Fine-Tuning the STR Tree

Next, I can add in the fast markers. While doing that, I see one of my mutations that I missed:

Here is the new tree:

The other thing that I gather from this tree is that the common ancestor of David and Robert Hartley could be more recent than the ancestor of William and Thomas. That is because David and Robert have fewer mutations on their line. David and Robert have a total of 6 William and Thomas have a total of 10. I have from a previous Blog that STRs mutate at the 111 level on average every 125 years. I’m not sure if that is still a valid number.

I’ll take the average STR mutations for each branch, multiply by 125, then add about 50 years for average age (maybe low as I’m 63):

Assuming that was right, I’m not sure how to date the Hartley Mode.

Cross-Checking Dates Using Big Y

I currently match one other Hartley at FTDNA under A11132:

This shows that we have an average of 2 private variants between us. We used to have three, so that number went down for some reason. Perhaps the analysis was refined. The rule is that you can multiply this number by 144 years to get the years to common ancestor. That would be 288 plus my age of 63 or about 350 years ago. That means that it is possible that our common ancestor was as recent as 1670.

That is getting near the Big Y’s ancestor Samuel and/or Edward Hartley born 1666:

An interesting thing about this Big Y tester is that his DYS455 value is 11 and his DYS447 is 25. That brings about this unlikely scenario:

Here I have the other Big Y tester with 1666 ancestor on the left as his 455 is 11 and his 447 is 25. So that puts him above the common ancestor of David and Robert Hartley. That means that if I made the tree right, My common ancestor with Samuel Hartley could be around 1600, my common ancestor with the David Hartley Line could be around 1700 and the Hartley Mode could be around 1500. That would put the common ancestor of the William and Thomas line too early at 1345. That could possibly also be at 1600. Something to think about.

Here is my rough guess:

I think that the relative dating holds together somewhat. It still seems that the David and Robert Line (Steve and I) have the most recent common ancestor in this group.

Summary and Conclusions

  • I played around with Steve’s new 111 STR results and created a possible STR tree
  • The dating was interesting but it ran into a fairly recent proposed date based on Big Y testing. This Big Y dating could be more refined if the tester had uploaded his results to YFull. YFull has had a good reputation in the dating department.
  • I was able to priortize some of the STRs based on their speed of change. The more slowly changing STRs should be the most important ones.
  • I came up with some rough guesses on dating based on a lot of assumptions.
  • The newer more recent Big Y tester’s common ancestor dating makes review of the other Big Y tester’s genealogy more relevant.
  • A lot of this work is in anticipation of Steve’s upcoming Big Y results.
  • The STRs are not as accurate as the SNPs produced by the Big Y, but they are interesting to play around with in making predictions. They can also be used in conjunction with the Big Y information.


An Analysis of My Mom’s Shared Clusters

I’ve been playing around lately with John Brecher’s Shared Cluster Program. I wrote a series of three Blogs looking at my owned Shared Clusters. The last Blog is here.

Downloading My Mom’s AncestryDNA Matches

First I signed into my account using the Shared Clustering program. I chose my mom’s kit and downloaded it.

I used the middle button which says ‘Slow and complete’. It was supposed to take several hours but only took 32 minutes. My mom has 26947 total matches and 438 fourth cousins. That is about half the matches that I have.

First Try: 50 cM Gets Two Clusters

My first try was conservative at 50 cM. I only got two clusters. I was sure to name the output file indicating that it was for 50 cM:

This gave me two named clusters. I say named, because I see that there are probably actually four clusters altogether. My guess is that these represent her four grandparents. The top cluster represents my mom’s mom who was a Lentz.

By the way, my analysis looked like this:

I have a green box around my mom’s side. I will be expanding that like this:

For now, I’ll keep it simple with a paternal and maternal side for my Mom:

3 Clusters at 40 cM

These clusters are in no hurry to separate. That is partly due to my mother, her niece and two grand-nieces being in Cluster 3:

One person I know in Cluster 2, Otis, descends from a Schwechheimer:

Also Gangnus, but more distantly.

At 35 cM, Mom Has 6 Clusters

Now my mother’s maternal grandparents, Lentz and Nicholson are starting to separate. Nicholson is Cluster 2 and Lentz is Cluster 4:

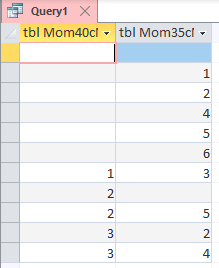
Here is a simple comparison of Clusters between the 40 cM and 35 cM cutoffs:

This shows that the Lentz 1900 went to Lentz and Nicholson as I have them. That means I need to figure out where Clusters 1 and 6 go. These are new clusters with no precedent. All three in Cluster 1 match my mother’s Rathfelder cousin, so Cluster 1 could be Rathfelder or Gangnus:

Cluster 6 also appears to be on my mother’s father’s side which could be Rathfelder or Gangnus. I’ll put them under Gangnus as I have nothing else there so far.

My Mom’s 10 Clusters Down at the 30 cM Match Level

My MS Access query gives me this:

At the 30 cM level, this shows that Clusters 3, 6 and 10 are new. The previously new Clusters 1 and 6 at the 35 cM level map to new Clusters 9 and 1. Cluster 7 is interesting it has no precedent at the 35 cM level but one of those non-precedents was previously a Cluster 2 (Scwhechheimer) at the 40 cM level. So that may be a clue. Here is how these 35 cM clusters map at the 30 cM level:

Three maps to 8 and 7. 5 maps to 2. Technically 5 did not map to 7 but someone who was in the precursor to 5 mapped to 7. This probably gets into intermarriage in the German colony of Hirschenhof, Latvia where some of my ancestors lived. I suppose I could have omitted the second 7. Here is Cluster 7:

It looks to have two parts to it.

That leaves Clusters 3, 6 and 10 to map. Because I compared the clusters above in Access, I didn’t have to know anything about who was in the clusters when I mapped Clusters 1, 2, 4, 5, 7 and 8. However, for Clusters 3, 6 and 10, I have to know something about these people to put them in the right places.

Finding a Home for Cluster 3

Cluster 3  at the top left is part of a larger Cluster 3-4-5 complex:

The is a large area below the second green box which can be ignored as that would be my mother’s close relatives. The second green box is Lentz. Below the close relative area is Nicholson. One person in Cluster 3 matches 2 people in the Lentz Cluster. However, 3 people in Cluster 3 match people in the lower right Nicholson Cluster. So I’ll say this is a Nicholson Cluster. The Nicolson’s came from Sheffield, England. One person in Cluster 3 has a tree. This tree shows both of his parents being from England.

Cluster 5 – Consider the Source

Here I have both Lentz and Nicholson mapping to Cluster 5. How does this make sense? The ones that map from Lentz (4) to 5 are my mom’s close relatives, so naturally, they would match both sides. I’ll take the Cluster 5 that comes from Cluster 4 out. That is one of the disadvantages of mapping the numbers without considering the source.

Cluster 6 – Rathfelder Side

Here are my notes on this small Cluster:

My Rathfelder grandfather was a German from Latvia. So by geographical phasing, that puts Cluster 6 somewhere on his side.

Cluster 10 – Mystery Cluster

Cluster 10 has strong internal matches indicated by the dark color of the Cluster. However, I don’t see any other matches with other groups or clusters:

Two of the matches have large trees of over 25,000 people. Comparing my mom’s tree and this large tree brings up the name Clayton:

However, JK also shares these areas of ancestry with my mom:

Here I have banished Cluster 10 to the Unknown Realm:

So now I am ready to dive into new depths of my mother’s clustering ancestry.

Mom Is Up To 18 Numbered Clusters at 25 cM

25 cM is the next to the last stop for our analysis. This is an important level, because at this vantage we can look toward the more recent 30 cM clusters and will be able to look next at the further in the past 20 cM clusters. The progression for the numbers of clusters has gone 2, 3, 6, 10, and now 18.

This is the overall shape of the 18 clusters

My mom’s close relatives have split into two clusters. The previous Cluster 10 of unknown origin is getting bigger.

Putting Access to Work Again on the 25 cM Clusters

I imported Columns A-L to Access and added it to my ongoing query:

When I view this query, I get this:


I’ll sort by new clusters to see which ones are new:

Next, I’ll map the non-highlighted new clusters. Here is what I get with my blind comparison:

Clusters 7 and 8 are on my mom’s maternal and paternal side. I suspect that is a result of her close relatives matching both sides. I’ll search Access for Clusters 7 and 8 and add names:

Here I see Cluster 5 going to Cluster 8 only with two close relatives, so I’ll remove that from my analysis.

However, we are still left with two Clusters 7. One is on my mother’s maternal side and one on her paternal side. That means that Cluster 7 is a compound cluster due to close relatives being there and matching both sides:

That means my mom actually has at least 19 Clusters at this level:

Ancestry uses 20 cM for a fourth cousin cutoff. The fourth cousin level represents 32 ancestors – in theory.

Next, I just need to go down the Clusters and fill in the blanks:

Clusters 1 and 2 – Sheffield Area

One person in Cluster 7a matches all four people in Cluster 1. Cluster 2 goes back to a known Nicholson ancestor born in 1765. That would bring Nicholson down to 1798 on my mother’s line in the next generation. Due to the fact that we know that ancestors, it is possible that Cluster 1 could be on Nicholson’s wife’s Clayton line:

 Cluster 3 Affinity to Cluster 7b

Cluster 3 also has an affinity to Clusters 4 and 14. That brings up an error in my Chart:

At 35 cM, I had both Clusters 3 and 5 mapping to Cluster 4 at 30 cM. A review of my Access query shows one to be wrong:

Cluster 3 only mapped to Clusters 7 and 8. Here is the corrected version:

This is bound to be a little messed up because my mother’s father had Gangnus and Schwechheimer on his paternal and maternal sides:

 Cluster 5

Fortunately, I have already done some work with Robert in this Cluster:

Here is a confusing tree. The confusing part is that the common ancestor is with Gangnus. Gangnus is also the wife of my mother’s Rathfelder grandfather. That means that this Gangnus goes in on my mother’s non-Gangnus side!

Actually, it appears that Robert is equally related on both sides:

In fact, as Otis is not in Robert’s shared group, I need to put Robert back on the Gangnus side. Good thing I’m flexible. Patrick doesn’t figure in as his results are on MyHeritage.

I needed someone on the Gangnus side that I could identify.

Summary of the 25 cM Clusters

Here I dumped more new clusters into the Unknown bucket. I don’t have much under Lentz, so some may belong there.

The Final Run of 20 cM for 36 Clusters

I run this at 6 cM which is the minimum, but the minimum shared matching at AncestryDNA is set at 20 cM. Some of the extra matches between 6 and 20 cM could give hints from the Correlated Cluster Column.

Probably the easiest part of the comparison is using Access. Here is what I can fit out of the 83 rows of results:

Here is what the mapping looks like except for Clusters 7a and 7b:

Both Clusters 10 and 5 mapped to Cluster 24. That probably has to do with the interweaving of Schwechheimer and Gangnus in my mom’s Colony of HIrschenhof ancestry. In order to map Clusters 7a and 7b, I bring in the 30 cM clusters to see which 7 I am looking at:

Here, Cluster 2 maps to 7b and Cluster 5 to 7a. This still gives some confusing results:

However, when I filter out my Mom’s close relatives of over 900 cM, I get this:

Here is how that looks in my summary chart:

I couldn’t decide whether to put Cluster 12 in under previous Cluster 7b, so I put it in parentheses. It looks like I mapped 19 clusters not counting those mapped more than once. That should leave about 17 more to map – or drop into the unknown bin.

Mapping the New 20 cM Clusters

Here are some new clusters:

All I have to do is to look at each of these clusters. My best hope is if they match another cluster or have a common ancestor or if I have some notes on them in Ancestry. Occasionally, looking at a tree or building out a tree will help, but I rarely have luck that way. One thing I find difficult is that my mom had German ancestry on both sides. One side came to the US before the American Revolution. Another side went to a German Colony in Latvia and then came to the US in the 1900’s. However, both sides were originally in Germany.

Clusters 28 and 29

Someone in Cluster 29 had a Nicholson ancestor, but it may be coincidence:

Sarah was from Bolton in the above tree. My mom’s Nicholson’s were from Sheffield, but perhaps not always from there:

The Large Cluster 30

It looks like one of mom’s unknown ancestors had a lot of descendants.

And the Answer Is…

It seems like I’ve increased my knowledge of the unknown (poor pun intended). I still have a shortage on the Lentz side. I’m not sure if there were just not many offspring or what happened. I have at least one early common ancestor at Ancestry, but that match is not in a cluster. Another question would be to identify Cluster 10 at 30 cM. I feel like I have a better idea of the weaving of DNA and families between Gangnus and Schwechheimer in my mother’s ancestry.

Summary and Conclusions

  • The combination of the Shared Clustering program and MS Access help to make a fairly quick analysis of AncestryDNA shared matches
  • My mom’s genealogy is a bit tough. I know she has some more Latvian matches out there but tracing their trees back is difficult in the period when Latvia’s records were in Russian.
  • I don’t have an explanation why my mother’s common ancestors of Lentz and Baker in Philadelphia were not part of clusters.


Walking My Clusters Backward and Forward Using MS Access

In my previous Blog, I came up with a way to show my Clusters and how they changed (or didn’t change) between Shared Cluster runs at different DNA match levels. The Shared Cluster Program is from Jonathan Brecher and the encouragement to walk my cluster back was from Jim Bartlett. As a result of my previous Blog, I thought that it might be easier to walk my clusters forward instead of back. Usually in genealogy work proceeds from the recent to the more distant path and from the known to the unknown. However, after looking at the clusters, it seems that in some ways the older clusters are more specific.

Using MS Access to Walk My Clusters Forward

I used to have some knowledge of MS Access. I wonder if I can resurrect that. I want to take my 6 cM run from my previous Blog and compare it to my 25 cM run. I hope to map 50 clusters down to 27. So I am reducing the clusters by about two to one.

I’ll start with  a new Access database:

This database had a blank table in it for me to add data to. I didn’t want that, so I got rid of it. I’ll go to External Data and import my 6 cM Shared Cluster Run. I feel like I should close out my open copy first.

I chose New Data Source and found my file. When I sorted by Date modified, my file rose to the top.

This leads me to an import wizard:

I probably won’t import all the information. I clicked the box saying I wanted my first row to be the Column Headings.

Actually, I see a better way to do this. I went back to my original file and copied columns A-L:

I put these into a new file, saved it and imported that into Access. I don’t need any of the 2500 or so columns after L. This brought me to the import wizard again. I pressed next:

Access want to add a primary key or to choose a primary key. The test ID is an ID, so I’ll use that. Otherwise, Access will assign the numbers of 1 to about 2500 to identify my new database.

Next, I give my table a name:

This now shows up in my Access Database:

Next, I do the same for my 25 cM run as I want to compare the 6 cM run to the 25 cM run.

Querying Access

The next step is to use these two tables to see how the 6 cM Clusters look like at the 25 cM level.

I’ll choose Create > Query Design:

I’ll choose these two tables. That will put them onto the blue area, then I’ll connect them by the key ID:

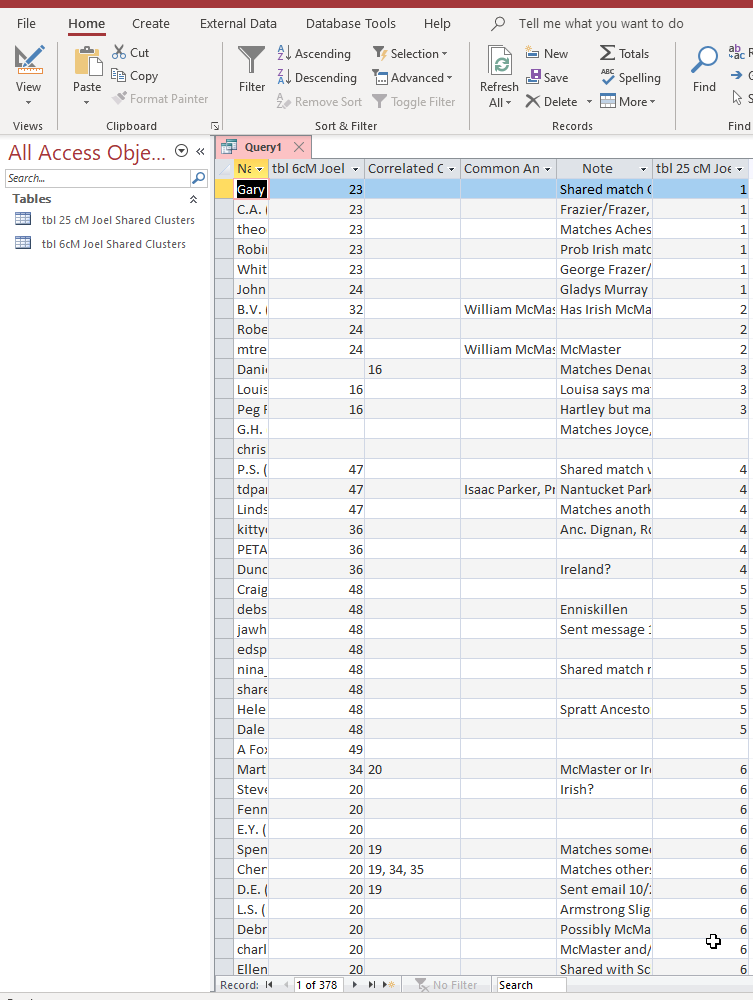
I wasn’t sure what to choose from the tables above to put into the query below. I put in the name. This has to be the same in each table because the Test ID in each table corresponds to the same name. Most important is to map the 6 cM Cluster Number to the 25 cM Cluster Number. I have those columns plus the 6 cM Correlated Cluster Number, the 6 cM Common Ancestors and 6 cM notes. The notes should be the same for each table. I didn’t add the 25 cM Correlated Cluster Numbers. I can add those later if I find I need them.

Next, I choose view to get the results of the query:

I get 378 results. This makes sense as there were 378 results in the 25 cM Shared Cluster Table. For some reason, Access ordered the results by the number of the 25 cM Cluster Number. This isn’t so bad.

Easy Results

Next, I’ll move the 25 cM Column in closer so I can compare the two sets of cluster numbers:

Let’s look at the 25 cM Clusters 1-3. Walking back, Cluster 1 went to mostly to 23, but one went to 24. Cluster 2 went to 24 twice and 32 once. Cluster 3

only went to Cluster 16. My guess is that the mixup between Clusters 1 and 2 have to do with the fact that these Protestant Irish families intermarried.

A Flaw in My Logic?

I’m just thinking that I need to do this exercise at least one step further back as I haven’t yet finished filling in my 25 cM Clusters. I’ll see what I can do with just the information I have sorted out from Access so far.

Without any sorting of my query, it appears that Cluster 40 comes out of nowhere. However, when I sort by the 6 cM clusters:

Here is a situation where Cluster 40 must be a compound cluster. Here is what I see:


The smaller square at the top left may be Lentz. The single dark red square in the bottom right is Nigel. I mentioned him in my last Blog. He represents an old  Nicholson DNA match.

Nigel would not match the Lentz side which appears to be the top left side of the Cluster. There appears to be other sub-clusters within the Nicholson Cluster which may represent Ellis or Clayton highlighted above.

Because, I’m in the area of my 25 cM Clusters that I didn’t finish last time, I want to do a new Access Query

Comparing My 30 cM Clusters to My 25 cM Clusters in Access

Here is what my new query looks like:

I’ve connected the two tables by the Test ID. Then I compared the 25 cM Cluster Number to the 30 cM Cluster Number. Plus I added some more information that I though to be helpful. Actually I had the Name column twice which was not needed.

This is my Nicholson section. This shows that the 30 cM Cluster 14 mapped to two clusters at 25 cM. I’m glad I did this, because Cluster 25 splits between Lentz and Rathfelder due to my mother being in that Cluster:

This brings up another issue. At 20 cM, my Rathfelder 2nd cousin match aligned with my maternal 1st cousin and her two daughters. This caused them to form a single Cluster that mapped from a previous two Clusters (25b and 11). It’s not a big deal, but I had to just enter 38 twice to account for it. To be consistent, I’ll call them 38a and 38b:


Here the green square represents 38a with my first and second Rathfelder cousins:

The matches to the lower right of the green box would be my more distant relatives with ancestry in Hirschenhof, Latvia.

Finding Cluster 22 at 25 cM

When I compare my 25 cM Cluster to my 30 cM clusters:

Cluster 22 at 25 cM has no precedent at the 30 cM level. That has to do with the match level of Cluster 22. Here is a comparison with it’s corresponding 6 cM Cluster:

All these matches to me were under 30 cM. So basically, Access makes it so you don’t have to keep switching back and forth between the different results.

Solving the Puzzle: Filling in the 20 cM Clusters

The 20 cM and the 6 cM Clusters are the same. The Shared Cluster can look at how the matches between 6 and 20 cM are associated with Clusters but Ancestry doesn’t make shared clusters at less than 20 cM.

I have some filled in already, but need to get up to 50 clusters:

The first Cluster 19 mapping is an issue:

25 cM Cluster 19 maps to Clusters 6, 7, and 15 at the lower cutoff. Further, I can see at least three clusters within the new Cluster 7:

The two green squares represent points of interest for me. They appear to represent my Hartley English genealogy.

Backing Up a Step: 30 to 35 cM Clusters Compared with Access

Another way to use access is by using an unequal join:

The unequal join is represented by the left to right arrow above. That says, show me all the cases where there is a value in the 30 cM cluster table that is equal to a value in the 35 cM cluster table. And it adds in all the remaining 30 cM clusters that aren’t included in the 35 Cluster Table. I think that that is what I want. I could have had the arrow go the other way, but would have gotten different results.

Just for fun, I’ll do it both ways. This is the way from above:

This shows that Cluster 2 at the 30 cM level had no corresponding cluster(s) at that 35 cM level. Cluster 4 only had one corresponding Cluster. And in that corresponding cluster, Cluster 4 had a correlated Cluster 7.

Here are the results with the arrow going the other way. Think of the previous results as walking the clusters back and this new one as walking the clusters forward:

Here Cluster 2 doesn’t even show up at the 30 cM level. They both give about the same information, but the walking forward comparison should provide more detailed information.

Cluster 7 at 35 cM

I’d like to take another look at this as I had ignored this Cluster previously. Based on the above query, it turns out Cluster 7 is quite important. This is Cluster 7 at 35 cM:

The first two people I have as coming from Nantucket (my paternal grandfather’s side). The second two I had guessed as being from Ireland (my paternal grandmother’s side). I don’t think that they belong in the same Cluster, so I’ll tree this as two clusters.

Putting It All Together with Access

Here is a more complicated Access Query:


Above, I’m comparing the 6 cM table to the 25, 30 and 35 tables. I have the link between the 6 cM Table and the 25 cM Table a right handed link, so I’ll see all the 6 cM (or 20 cM) Clusters. I then put the 35 cM Clusters first so they will be in the order of my Summary Chart:

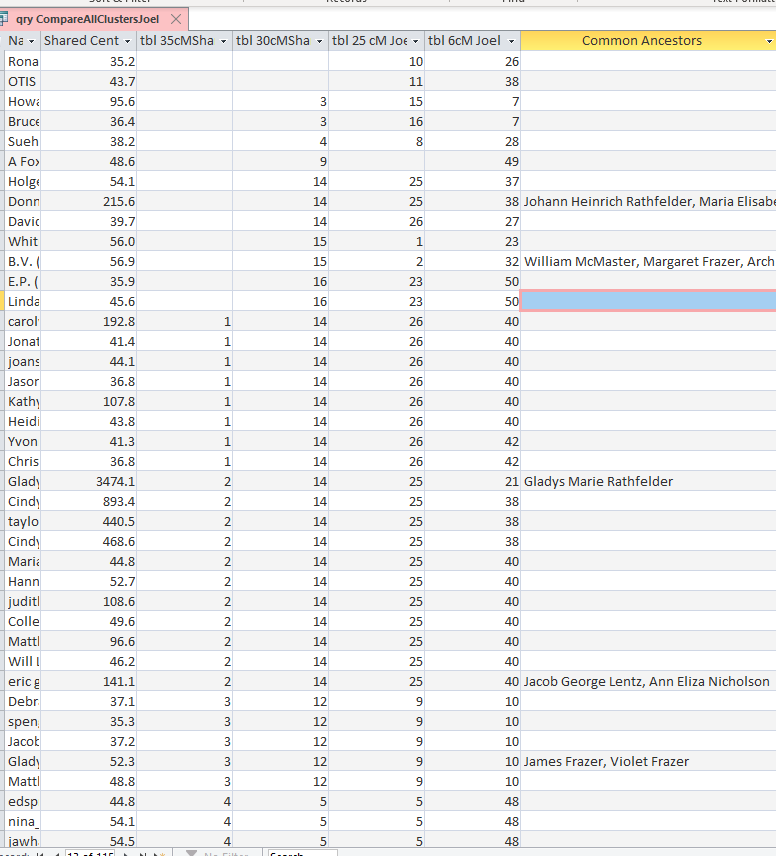
At 35 cM I have 10 Clusters. Cluster 1 maps to Cluster 14 at 30 cM. 14 Maps to Cluster 26 at 25 cM. Cluster 26 maps to Clusters 40 and 42 at 6 cM. However, note that other clusters are mapping to Cluster 40. That is because we have Lentz and Nicholson in Cluster 40 as well as those who only descend from  Nicholson, if I understand it correctly.

Cluster 2 at 35 cM includes my mother. Her clusters go from 2 to 14 to 25 to 21. The correlation is one to one until we get down to the 20 cM level. At that point the cluster splits into three where Cluster 40 is a child of Cluster 1. That makes me think that Cluster 40 will be a compound Cluster.

I see at least three clusters for Cluster 40 at the 20 cM cutoff:

Another Query

This one is more like the manual comparison that I did previously:

This query says take everything in the 6 cM Table plus those things that match inthe 25 cM. Then do that for each Table. That query appears to give me everything as it includes 2,452 rows:

Here is a stripped down version of this query:

Here I only include the Cluster Number columns:

This gives me 135 rows. This also points out that Cluster 6 and 10 at the 35 cM level both map to Cluster 7 at the 30 cM level. This makes sense when you look at Cluster 7:

This is a distinction that I had missed in my original mapping chart:

This corrected chart better reflects what Access is showing me:

Access then shows this:

The part of Cluster 7 that was from 10 goes to 18 and then to Cluster 5. This was not reflected in my previous summary chart:

Here is the correction:

I’ll also add in my Cluster 7 at the 35 cM level. I didn’t add it in previously as it had 2 people with Nantucket shared ancestors and 2 people with suspected Irish shared ancestors.

Mapping Cluster 4 at 30 cM

Here I have another situation like my Cluster 7 above:

This is another 4 person Cluster. And, like Cluster 7, the first two people seem to match on my Hartley side and the second two seem to match on my Frazer or Irish side. This is reflected in my Access query:

The split goes to Cluster 8 (Irish) and 14 (Hartley ancestors).

Mapping Cluster 14 at 30 cM

Here is the work I did previously in my Cluster Summary Chart:

I had split Cluster 14 in three. These are my major maternal lines. Because my mother was in this Cluster, she was related to both these sides. Lentz and Nicholson are well-tested, so I have some good separation there. This confusion is reflected in my Access query:

The Common Ancestor Column above shows three different sets of Common Ancestors. They represent the needed splits for Cluster 14. This is where the Access results come in handy. In Access, I have a 14 Cluster going to Cluster 26 which goes to 27. I had missed that in my previous analysis and only had 27 going to Cluster 40.

My Irish Cluster 15 at 30 cM

Here is what I had:

The Access query shows some additional subtleties:

This shows Cluster 2 at 25 cM going to Cluster 24 at 20 cM. However, that doesn’t mean my other Cluster 2 to 32 is wrong:

Two other people in Cluster 2 probably would have mapped back to Cluster 15 but the DNA match was not high enough to be in Cluster 15. Also note that Cluster 24 and 32 both have Common Ancestors:

The question is, if these three have the same common ancestors, then why are they in different clusters? The answer appears to be that one Cluster (24 or 32) would represent McMaster and the other Frazer due to the two common ancestors.

As a result, I split out these two clusters like this:

McMaster 1829 is Fanny in Cluster 2 above. I now have Clusters 24 and 32 as her parents. Consider it a theory.

The Good Enough Product

I have slimmed down my chart to show between 40 cM and 20 cM. I started with 5 clusters in the 40 cM Column which is enough to describe my four grandparents. In the 20 cM column, I didn’t feel a need to describe each of the 50 clusters. However, I was interested in describing each cluster in the 25 cM column and it’s corresponding cluster at 30 cM and 20 cM. The 25 cM clusters were at a good vantage point where I could check the clusters on either side using Access. The place where I may be more interested in detailed 20 cM clusters would be for my English Hartley side.

Summary and Conclusions

  • Jonathan Brecher’s Shared Cluster Program is good for sorting out your clusters
  • The use of MS Access makes it easier to see the nuances of how the clusters merge or separate between the different lower match thresholds
  • There is a question of my mind concerning the level of accuracy needed in this analysis. It’s good not to be so detailed-oriented that you miss the big picture. The big picture for me is whether the cluster is in the right grandparent group for me.
  • This was my first shot at using Shared Clusters to sort out my Ancestry Clusters. I’d like to try using the Shared Cluster program on other DNA kits that I administer. Perhaps my mother’s results would be the next logical step.


Walking Back My Clusters: Part 2

Part 1 of Walking Back My Clusters was long and rambling. I learned a few things, looked at a few family trees and reached out to a few DNA matches at AncestryDNA.  While writing my previous Blog, I came up with a better way of presenting the results of walking back my clusters. I realize that this may sound obscure if you are not already into genetic genealogy and clusters, but hopefully the readers understand the basics of DNA and clustering.

The New Cluster Results Format

Here it is:

I have my four grandparents in four colors. The thought is that even if I am lost as to what a cluster represents, I should know under which grandparent the cluster belongs. At the top, I show the cM cutoff for the clusters. I have a small column for the cluster number that the program produces. This is a relative number and changes for each analysis. To the right of the cluster number, I have the name of the closest surname that cluster represents and the date that ancestor was born. If I don’t know this, I may give a geographical hint. As far as which ancestor to use, it is somewhat subjective. On the top row I have Hartley going to Pilling 1802 and Snell 1866. It may have made more sense to use an earlier Hartley instead of Pilling, but I suspected that one of the people in that particular cluster went back to Pilling. Under Lentz 1900, that went to the two parents who were Lentz 1866 and Nicholson 1865. This new representation, so far, keeps everything close together where I can keep track of where the clusters are going.

Cluster 13 on the 30 cM Limit

This is where I left off on the chart above. There are only three in this Cluster. I have a note on one of the match’s that they have a Northern Ireland background. I’m going to peek forward to 25 cM to see if I get any more hints. This adds one more match and tree. This tree in addition to the match with the largest tree has Canadian ancestors. I’ll take a look at the largest tree in Cluster 13:

This particular match had Ontario ancestors. The parents had connections to Owen Sound, Ontario. That sounds familiar from one of my distant Frazer relatives. My hunch is that the connection is not on the McRae side as they are listed as being originally from Scotland and Presbyterian. I’m not aware of Presbyterian ancestry on my Frazer side.

Here is my best guess:

Jane or Jennie in the bottom right of the tree is from Inniskillen. I assume this to be a variant of Enniskillen, where a lot of my DNA match leads take me:

All that to make a guess at Cluster 13.

Cluster 16 on the 30 cM Limit

I’m a bit stuck on this one. I think it is on my maternal grandfather’s side. Here is what I have so far:

I know that at 20 cM, I have 50 Clusters, so I have a way to go.

25 cM Clusters

Here I have 27 clusters, but some may be compound clusters.

Clusters 1 and 2

These split out the previous Cluster 15 which I had assigned to Fanny McMaster born 1829. Let’s take a second look:

Whitney in Cluster 1 matches everyone in Cluster 2. That is because he is a closer relative to me than I am to others in that Cluster:

What is also confusing is that Margaret McMaster had two McMaster parents.  I had the previous Cluster 15 correct on Fanny McMaster. However, it would be easier for me to think of this now as having the old Cluster 15 on Margaret McMaster 1846. Then I could assign Fanny to BV and mt and James McMaster to Whitney. Here is how I’m related to Whitney:

I am Whitney’s third cousin once removed. Here is one case where I changed an earlier analysis based on a later one:

After going through some more clusters, I came up with this:

I mentioned that I Had 27 clusters at 25 cM and 50 clusters at 20 cM, so I gave up doing this for now. I think I have an easier way to go about this which I will explore in my next Blog.

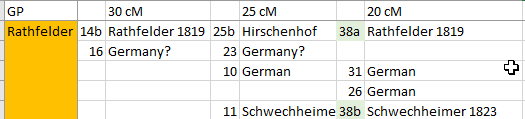
One interesting thing above is that the orange Rathfelder line jumps from 1921 to 1819 in the above cluster summary. My explanation is that there were not many DNA matches for that line at Ancestry. That line represents my mother’s father who was from Latvia. He jumped ship and came to the US in 1916. I have has one Rathfelder 2nd cousin once removed who tested at Ancestry, but one person is not enough to form a cluster at that level.

Going All the Way to 6 cM with Shared Clusters

The creator of the Shared Cluster Program commented on my previous Blog and recommended I take the clusters down to 6 cM. John Brecher tells me I won’t get any more clusters but more matches associated with those clusters. At first I thought that I had to leave the “Lowest centimorgans in shared matches” as 20, but that gave me the same results as my last run using 20 for both values in that row. So now I have both values set to 6 cM:

This kicked up my spreadsheet from 912 rows to 2453 rows. I suspect that this is where the Shared Cluster Program really shines.

Filtering the 6 cM Results

Excel has a filter button. I would like to filter my results on Common Ancestors:

When I choose Filter, an arrow appears in each column’s heading. I click on the arrow under “Common Ancestors” and unclick the ‘Blanks’ option which is at the bottom of the list:

That will give me each row that has a common ancestor:

I couldn’t get all my results in one screen shot, so the top is cut off.  Cluster 7 appears to have many of my 2nd cousins, so it shows other more distant clusters that they are related to. The 13 is highlighted in the Correlated Clusters column because it gives a clue to Cluster 13 with common ancestors Snell and Luther that I didn’t have before for Cluster 13. The same is true for associated Cluster 19 with common ancestors of James McMaster and Fanny McMaster. If I add up all the clusters plus associated clusters that have Common Ancestors, that adds up to about 20. Those will be a good clues to identifying my 50 clusters.

I highlighted Nigel because he is an interesting case. He has a fairly high DNA match with me. He’s my 5th cousin, once removed:

I don’t recall Nigel being in a cluster before due to the distant of his relationship to me. So it is good to see him in Cluster 40 now.

On to the Next Blog

Part of the difficult part of comparing these Clusters is cross checking between say, a 25 cM analysis and a 20 cM analysis. For example, Charlie was in Cluster 35 at 20 cM. What Cluster was he in at 25 cM? I hope to figure out a way to make that a little easier in my next Blog using MS Access. There may be other ways. It makes sense to me also to walk the Clusters Forward instead of back. That is because the older clusters have more people in them. As noted above they also have about 20 identified Common Ancestors.


Walking My Clusters Back – Jim Bartlett Method

I recently read two interesting articles by Jim Bartlett on the use of Shared Clustering. Jim’s most recent article discussed walking the clusters back. Shared Clustering is a free program developed by Jonathan Brecher.

Shared Clustering

Last Night while the New England Patriots were playing football, I downloaded Jonathan’s program and used that program to download my AncestryDNA matches and Shared Matches.


I used the first two radio buttons above. The first button downloads your matches up to the fourth cousin level. That is a match of 20 cM or more. As I recall, this was about 978 matches. I may be off, because I just checked AncestryDNA and I have 908 matches of 4th cousin or closer. The second button gets your matches and Shared Matches down to a level of 6 cM. It took overnight to gets all these downloaded. However, once I have those, I don’t have to connect ot AncestryDNA again – unless I need an update. The download is in the form of a text file and not overly useful in that form. It is sort of a dump of my AncestryDNA match data.

Clustering

Next, I chose the recommended button for clustering under the cluster tab:

This outputs to an Excel spreadsheet file. If I shrink my spreadsheet to the minimum 10%, I can see half of the clusters:

This gets me to about Cluster 18 out of 50 clusters. So, though this is theoretically, my 4th cousins, it must go out further than that. 4th cousins would represent my 3rd great-grandparents. I have 32 great-grandparents and 50 clusters. 18 or more of those clusters must go beyond the level of the 3rd great-grandparents.

Here is the bottom half of most of my clusters down to Cluster 50 in the lower right of the screen:

Walking My Clusters Back

Jim Bartlett recommends walking back your clusters from your 4 grandparents further back a generation at a time. My first Blog on clustering was about a year ago using the Auto Cluster program. Here was my first Auto Cluster:

In this simple analysis, I had 5 clusters. However, as far as I could tell, none of these represented my maternal grandfather:

  1. Paternal grandfather – orange
  2. Paternal grandmother – green, purple and brown
  3. Maternal grandmother – red

My paternal grandfather was a German from Latvia who came to this country in the early 20th Century. So, not many relatives had tested. Not really a problem, but something to be aware of.

Shared Clustering 90 cM or Greater

Next, I tried the Shared Cluster 90 cM or Greater. It looks like this should give me 3rd cousins or greater. Somewhat surprisingly, this only gave me two clusters:

A few notes:

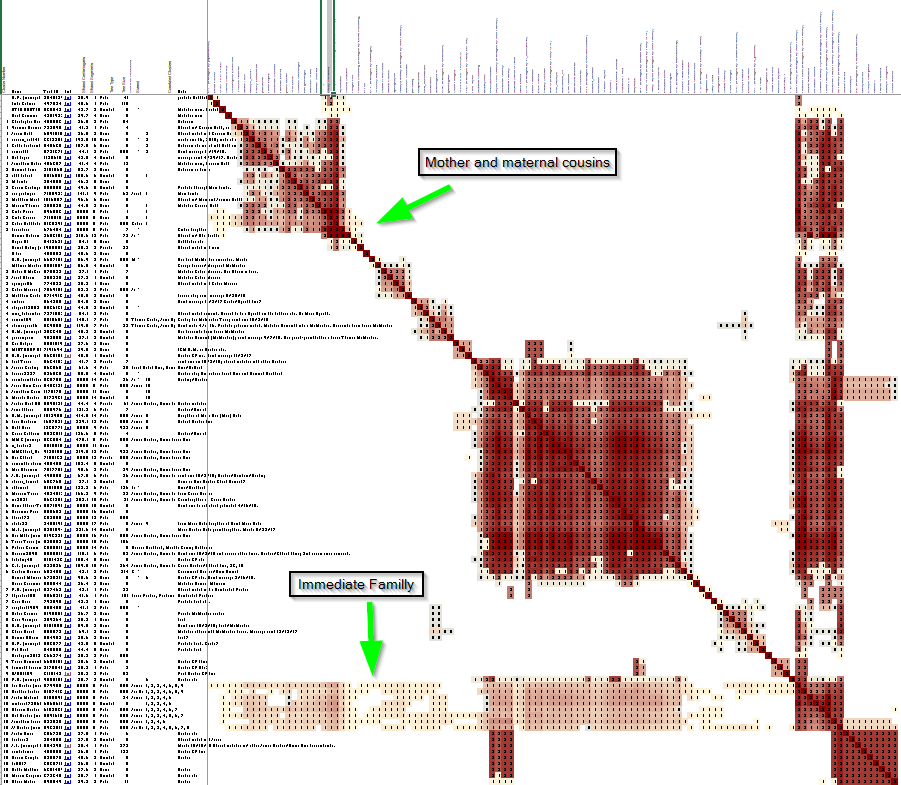
  • The Shared Cluster program does not appear to have an upper limit for matching. Because of that my immediate family is included. They show up as a a horizontal bar in the middle of the image.
  • The first two people are in a cluster of sorts, but Shared Cluster only includes clusters of three or more by default. They fit in on my paternal grandmother’s side.
  • The third person (the first person in Cluster 1) is actually on my maternal grandfather’s side. This was a new person who tested since last year. She is in Cluster 1 because she matches with my mother, my maternal first cousin and her two daughters.
  • Cluster 2 is all my paternal side. The matches go back further than that but the Cluster is holding together due to my close family being included in the Cluster.

Tweaking the Shared Cluster Program

Under advanced options on the Cluster Tab, I don’t see any option for screening out close relatives:

So I’ll try to ratchet down the lowest centimorgans to cluster to try to break open these clusters. I’ll try 50 cM for the lowest:

Above, I picked up one more Cluster. Cluster 1 is now my paternal grandmother’s cluster. This was the one that wasn’t a cluster previously, but I picked up one more person to make it a cluster:

  1. Paternal grandmother
  2. Maternal
  3. Paternal grandfather

The first person in the previous Cluster 1, Donna, is now the last person in the new equivalent Cluster 2. So far, I have not split a cluster but added to a previous non-cluster. This is fun to play with.

I Need to Get to About 8 Clusters Next

Trying 40 cM still resulted in 3 Clusters, so I’ll try 30 cM. I know that the three represent four grandparents as they are, but I only have one tested person for my maternal grandfather’s side tested at Ancestry. I know that at 20 cM, I have 50 clusters, so I need a match number that will get me about eight clusters. I think I see an issue. On the advanced tab, there is a maximum shared match number. When I ran 50 cM, I had a maximum shared match of 90 cM. I need to change that to 50 cM:

This flipped the clusters around:

  1. Paternal grandfather
  2. Maternal
  3. Paternal grandmother – now up to a cluster of 6 people who match me and each other by DNA

I think I’m getting the hang of this.

A 40 cM Cluster Gives Me 6 Clusters

This may be about what I want. Again, I set my shared match limit to 40 cM:

There are two-person clusters where I have the arrows. There is also a one-person cluster at the lower right of the image above. The Clusters are:

  1. Lentz
  2. Nicholson – the first two clusters look like one. I believe that that is because Cluster 1 is Lentz/Nicholson and Cluster 2 is Nicholson without the Lentz.
  3. McMaster/Frazer (Ireland) – These families intermarried more than once in my ancestry
  4. Unidentified, but believed to be Spratt (Ireland)
  5. Most likely Clarke (Ireland)
  6. Hartley – Paternal grandfather, but not further split out

Here are those Clusters on my family tree:

  • I know least about the Clarke line, yet this seems split out to the two parents of Clarke and Spratt
  • Cluster 6 is stuck probably because Hartley and Snell had 13 children and I have a lot of 2nd cousin matches at AncestryDNA
  • Cluster 2 appears to be split between three great-grandparents on my maternal side. I’m not sure why. I have some other Rathfelder cousins, but they tested at MyHeritage and FTDNA.

Some Walk Back Analysis

This shows what happened between matches of 50 to 40 cM when my clusters went from three to six.

  • My mother’s Rathfelder Cluster split into her maternal grandparents of Lentz and Nicholson
  • My paternal grandfather’s Cluster got stuck and was not further divided
  • My paternal grandmother’s Cluster seemed to skip a generation and form two clusters further out.

As my Clarke and Spratt Lines are brick walls, I would like to look at them. I am quite sure of Cluster 5. My common ancestors with two of the people in this Cluster are Thomas Clarke and Jane Spratt. That being the case, I could have put the Cluster 5 up a generation at Ancestor #11.

The four matches in Cluster 4 are all just above 40 cM, so they didn’t appear in the 50 cM analysis.

Here are Clusters 4 and 5. There are a few connections between these two Clusters. I interpreted that to mean that Cluster 4 is the ancestor of Cluster 5. Here is my modified summary:

A 35 cM Threshold Results in 10 Clusters

It’s a free program, so I can play around with it:

10 is still pretty close to 8, so let’s see what we have for Clusters:

  1. Nicholson
  2. Lentz
  3. Frazer
  4. Clarke/Spratt
  5. Snell or Colonial MA?
  6. Snell/Bradford – this was a larger cluster in my previous run
  7. Parker Nantucket?
  8. McMaster Ireland?
  9. Hartley English?
  10. Snell or Colonial MA?

I’m not sure that this is any clearer than the previous Cluster of 6. Some of my matches that were previously in clusters fell out in this analysis.

35 cM Cluster Analysis

For the 10 35 cM Clusters, it would be nice if I were able to trace where they came from. I had a question on Cluster 5. However, it is still as good as it can be right now. There are only three in this cluster. They have no usable trees and they are shown matching Hartley’s in my 2nd cousin large Cluster.

On Cluster #7, I don’t agree with the way the program drew up the Cluster, so I would rather ignore that Cluster. Half of the Cluster seems to match Cluster 6 (Massachusetts Colonial) and half seems to match Cluster 8 (Irish ancestors). Cluster 9 is difficult as there are only three in the Cluster. One tree has English ancestors, but not all are English.

A 30 cM Match LImit Gives Me 16 Clusters

So by accident, I have come upon 16 clusters. In a perfect World, this would represent my 16 2nd great-grandparents. I have already shown that theoretical perfect numbers are not showing up in my case, so I don’t see a lot of purpose in getting a perfect 4, 8 and 16 clusters.

Here I have pointed out my maternal side. They only match with the first two Clusters. That means that the following 14 Clusters appear to be paternal.  The largest Cluster is #6. That is the one with a lot of my second cousins.

Here are my guesses for these 16 Clusters:

Had this previously as possibly Hartley English due to someone with a Heaton in their ancestry. Heaton is a name that was in the area where my Hartley ancestors came from. I had that one of my Hartley ancestors possibly married a Heaton. However, I had this wife of dying before they had children. Based on others in the group I would go back to saying that this is probably a Colonial Massachusetts Cluster

Cluster 2

I would interesting in knowing about Cluster 2. One of the matches in this Cluster was part of a New Ancestor Discovery at Ancestry that I never figured out. One match has a tree, so I could try building that out. My guess is that this Cluster is along the lines of my Irish ancestors.

I don’t have a lot of hope in figuring out this line, but I’ll give it a shot:

John McLean goes back to Ireland, so that is where I was trying to get. Going out further, I get this:

The trees are going back to Scotland on many lines. I tend to put some of these lines on the Clarke/Spratt as I don’t know much about those lines except that they were from Ireland.

Back to the guesses:

  1. Snell and before Massachusetts Colonial
  2. Clarke or Spratt Ireland
  3. English Hartley ancestors?
  4. One match correlates to Cluster 7 (Hartley 2nd cousins) but one match maps to Frazer by Visual Phasing, so say Frazer side
  5. Possibly Spratt
  6. Hartley side by shared matches
  7. Snell/Bradford based on one match with common ancestor
  8. Isaac Parker/Prudence Hatch (1778)
  9. Correlated with Cluster 11;

A Cluster 9 Tree

One of the Cluster 9 matches has a tree:

I have come up with many of these names before, but the name of Reed sounds familiar. Here is the detail on Alexander Reed:

Here is Hastings:

Here is the Reid I have:

Apparently William Wynn Fraser marries a Rachel Reid. My guess was that Reid was her married name. However, this family lived in Kenilsworth, Ontario:

I’m not sure if the Reid and Reed families are the same or whether there is any connection with my family. A search for Alexander Reid/Reed shows that there were many by that name living in Ontario.

Cluster 14

I joined the Shared Cluster Facebook Group. It looks like this Cluster is actually more than one Cluster.

Because my Mom, her niece and two grand-nieces are in this Cluster, it formed a super Cluster. I’ll call them 14a, 14b and 14c.

  • 14a Nicholson
  • 14b Rathfelder
  • 14c Lentz

Rather than look at each Cluster in detail, here is a summary:

I skipped a few Clusters. This exercise reinforces my thought that getting the exact 16 clusters for 16 2nd great-grandparents is not important. I had 16 Clusters but only 2 were maternal. That means that 14 were paternal and far in excess of the 8 paternal great-grandparents expected. Cluster 16 was maternal and most likely my maternal grandfather’s side. I haven’t placed this group yet. They seem to go back to a German Colony in Russia which was a long way from my grandfather’s family’s German Colony in Latvia. There was some connection to the two colonies, but I haven’t made the connection genealogically with my family.

25 cM Cutoff – 27 Clusters

This is 5 cM above the cutoff that Ancestry uses for 4th cousin. This is equivalent to a 4th great-grandparent common ancestor. I expect that a 25 cM cutoff should be equivalent to 4th cousin.

Here is the general look of the clusters:

I am in a vertical and horizontal group that splits the chart about equally in two. My mother and her close relatives form a lop-sided plus sign in the lower right side of the chart.

Clusters 1 and 2

These two clusters hold a lot of potential. These were previously Cluster 15 and I had assigned them to my ancestor Fanny McMaster. Now that Cluster 15 has broken into two, it appears that each cluster could represent one of Fanny’s Parents who were William McMaster and Margaret Frazer. I have recently learned a lot about this family through researching their move to Ontario from Ireland. Two of the people in the new Cluster 2 share my common ancestors William McMaster and Margaret Frazer. If I could identify Cluster 1, it should help to identify Cluster 2. I know that on of the matches in Cluster 1 has an unidentified Jane Frazer or Frazier in her tree. That means that Cluster 1 could be Frazer and Cluster 2 McMaster. This is important as I have at least three Frazers in my ancestry and at least two McMasters.

To accommodate this, I have lengthened my ancestor chart down to the 4th great-grandparent level:

This would be a theory to follow up on based on the fact that a match in Cluster 1 has a Frazer ancestor but no known McMaster ancestry.

Cluster 3

There are only three people in Cluster 3. Based on correspondence from someone with a private tree, our common ancestors are Simon Hathaway born 1711 and Hannah Clifton. That is two generations back from the extension I made on my cluster summary chart, so I’ll just add Cluster three to my Hathaway 4th great-grandparent.

Cluster 4

Cluster 4 brings into question my previous Parker Cluster. I had a match with at least one person in this cluster with a common ancestor going back our shared Parker ancestor in Nantucket. However, now there are two others in this clusters. One has an ancestor in County Roscommon where I had ancestors. Another person is from Australia. Now my match with the Parker ancestor also has an Irish ancestor. Perhaps this is the real match I should be looking at?

Cluster 5 – Spratt

In my 30 cM analysis Cluster 5 was also Spratt coincidentally. However, this new Cluster 5 goes back another generation and has split off the Clarke from the Spratt:

The new cluster 5 at the 25 cM threshold has moved from my 2nd great-grandparent level (Jane Spratt born  to my 3rd great-grandparent level. This is important as Spratt is my most severe brick wall.

Triangulating Spratt Trees in Cluster 5

My thought is that if I can find common ancestors in some of the trees represented by Cluster 5, I may find my common ancestors. First in order to not duplicate effort, I checked to see if I had an existing Spratt Tree. I did:

Unfortunately, I don’t remember who Ed, Deb and Helena are. I do note with interest a George Spratt who married a Jane McGuire. Could they be the parents of my Jane Spratt thought to be born about 1830? William and Christopher are also potential candidates.

My first match in Cluster 5 is Craig. I’ll add him to the tree:

Craig matches me with a healthy 33.9 cM of DNA. One question would be whether Christopher was married previous to marrying Margaret McKay.

Next in Cluster 5 is Deb. She is already on my chart and matches me with 34.1 cM of DNA. The last person in my Cluster 5 with a tree is Helena who again is already on my tree. She matches me at 25.2 cM.

This leads me to two theories:

  • I descend from Christopher Spratt and a first wife, or:
  • I descend from William Spratt born 1775 and then from one of his sons

In now see Ed and match him by 44.8 cM.

Here is another Cluster 5 Tree:

I’ll call this person Shar. She must be on the Margery Spratt Line:

The tree is now shaping up with DNA matches. Shar’s tree ended with Jane, but I assumed it was the same Jane Hayes that was in Helena’s tree. The good news is that I have the start of a good Spratt DNA project. The bad news is, I’m not much closer to knowing where Jane came from. It’s interesting how clearly this Cluster points to this genealogy, yet I don’t have the specifics. I’m slowly getting closer to the answer.

Clusters 6-9 – Irish, But Which Families?

I’ll start with Cluster 9 as Gladys is in that Cluster. I manage her DNA:

From what I can tell, James at the top married his cousin Violet Frazer. I could safely assign this Cluster to George W Frazer as Gladys has no known McMaster ancestry. I would like to go back at least another generation, but at this time, I can’t match up the genealogy of my other matches in this Cluster.

I don’t have a good guess for the other clusters other than possibly on the Clarke side.

Cluster 11 – Schwechheimer

Through hard work and diligence, I came up with a common ancestor for one of my three matches in Cluster 11:

However, this gets confusing. Rosine Schwechheim, my ancestor married a Gangnus. Also Rosine’s mother was a Gangnus. Technically, the common ancestor would be further out, but it is safe to say that the line on my side went through Rosine Schwechheimer.

Cluster 13 – Clarke

I know that I have a Clarke/Spratt common ancestor with two matches in this Cluster. I see another match with a person in this cluster but Patricia has a private tree. She has uploaded to Gedmatch:

Cluster 14 – Snell?

There are only three in this Cluster. One match has a tree that goes to Hannah Snell. She is probably the granddaughter of my ancestor Samuel Snell born 1708. I’ll stick this Cluster with a later Snell ancestor because I don’t want to extend my list too far:

This Anthony is Samuel’s grandson, so technically, I should have gone back another generation.

Cluster 15 Hartley English Side

This is a side I am interested in if it is Hartley English. There are three in the Cluster. I have looked at one tree with no luck. Perhaps looking at a second tree will help. The matchup seemed like it should be on Mark’s maternal side:

Here is the tree from the other person in Cluster 15:

Cluster 16 has only three also. The one person in Cluster 15 without a tree had a connection to Cluster 16.

Clusters 17 and 18

Cluster 17 is picking up in size which may mean my Snell side which has the Massachusetts background. I can’t find many good trees in this Cluster. Cluster 18 is large. Despite the size, I couldn’t find common ancestors and Ancestry didn’t suggest any.

Cluster 19

This is the Cluster I am in as well as my siblings, close relatives and second cousins. Two matches in the group have the common ancestors Snell and Bradford. One match has Greenwood Hartley and Ann Emmet. That means that this Cluster should be two Clusters.

These show in the same Cluster due to all my close relatives in this Cluster. I would split Cluster 19 like this:

The grey horizontally highlighted row is the Greenwood Hartley match. This is an important distinction for me as one side represents my English Hartley side and the other side represents my Colonial Massachusetts Snell side.

Clusters 20-27

  • 20 – probably MA Colonial
  • 21 – probably Irish
  • 22 – probably maternal grandfather
  • 23 – maternal grandfather. Some match my maternal cousin but not my mother, so that seems odd.
  • 24 – more maternal grandfather
  • 25 – The is a compound cluster. 25a is Lentz. 25b is Rathfelder. This was previously 14a, b, and c so the Nicholson cluster broke off this below
  • 26 – Nicholson
  • 27 – probably Irish

Summary of the 25 cM Clusters

Some splitting out of known clusters are interesting as they suggest descent from a specific older ancestor. This was the case with my ancestor Fanny McMaster where I was able to split out matches between her parents William McMaster and Margaret Frazer. Where I didn’t know the previous cluster, when these were split out it just split out to other clusters that I didn’t know.

The Parker Cluster was confusing. I had a common ancestor for two of the matches, but two other matches seemed to indicate that they didn’t have the same common matches. This could be the case where they match each other on a different line.

When I put the clusters into my summary chart, I am putting them in vertically. However, it is important to check vertically also to make sure the clusters are being picked up. I also looked into some genealogy. I filled out a share DNA Spratt tree. I don’t know where I fit in this tree, but I am all the more certain that I do fit into this particular tree, so that narrows down where I should be looking for genealogical clues.

It seems I need a better way of presenting the results of the clusters. Right now the results are very spread out do to the increasing numbers of ancestors. It would be possible to collapse these results to include only the ancestors with clusters, but that would omit all the ancestors that I don’t have clusters for.

20 cM – 50 Clusters

At the risk of making this a marathon Blog, I’ll look at my 50 Clusters down to 20 cM. This is the matching limit for AncestryDNA. Apparently this program can take the level lower, but the shared matching limit will still be at 20 cM. I expect some more of the same of what I found out above.

I see a problem already with Cluster 1. All the levels are below 25 cM. That makes it difficult to place this Cluster. One person in the Cluster has a tree of 5:

It may be possible to build this out, but it would be a low priority for me to do this right now. I don’t see this person on my mother’s match list, so I suspect this is a paternal match.

Cluster 2 has only four in it. Two are between 25 and 30 cM, but they did not form a Cluster under my 25 cM analysis.

Cluster 3 matches are all under 25 cM, but match my mother.

Clusters 6 and 7

The program split 6 and 7 strangely. Two of my sisters are in #6 and one in #7. My son is in Cluster 6 and my daughter in Cluster 7. What is more important is the splitting of Cluster 7:

This splitting is important to me as I am trying to find English Hartley ancestors who don’t have Snell ancestry. The larger part of Cluster 7 has Snell ancestry (outlined in green).

More Detail on Cluster 7b

There are 8 people in Cluster 7b. It also looks like 7b forms two clusters. My guess is that this represents Hartley and Emmet:

The first match in the Cluster is Kristen. I think we have been in touch, but I can’t find any Ancestry messages. Here is the connection:

The second on the list is Mark. I’ve been building out the part of his tree where I think there is a possibility we might match up. That is his maternal grandfather’s side:

Lucy Priestly died in Hull, but was born in Halifax which is a bit closer to where my ancestors lived.

Lucy’s mother Sarah Ann Wilson was the one born in the Halifax area. Here is Sarah Ann’s baptismal record from 1825:

My guess is that her mother could have been Susannah? Her father was a bookbinder. I didn’t make a genealogical connection between myself and Mark yet, but I will likely come back to his tree.

The next match is Arlene. She doesn’t have a tree, but I sent her a message.

The next match with Howard appears to be important:

Even though Howard doesn’t have a tree, It appears that he may descend from my Pilling ancestor:

I guess I hadn’t realized that two separate Wilkinson lines descended from Pilling. At any rate, my guess is that Howard descends from one of these two lines. I believe that on the right, next to Richard should be a Paul also. I don’t match Paul but some of my relatives do. As far as I know, the David Watson above isn’t closely related to William Wilkinson.

Another question I have for the above Cluster is whether Bessey should be included in the Cluster. I would guess not, because I have that Bessey’s ancestors are Snell and Bradford. Also Bessey is linked to Clusters 12 and 15.

A further point to consider is that Arlene and Howard appear to be in both sub-clusters above. Assuming that Howard is a Pilling match, that may mean that both sub-clusters are Pilling clusters. That could mean that one sub-cluster is more for Mary Pilling’s mother and the other for Mary’s father. However, that is just a guess. Mary’s parents were Greenwood Pilling and Nancy Shackleton:

Dave, Bruce, Mark and Michael

Dave and Michael have trees. I’ve been working on these trees, but haven’t found the connection yet. However, I see connections in the Greenwood surname. I haven’t found a Greenwood surname in my ancestry, but it may be there. Mary Pilling’s father was Greenwood Pilling. Mary’s son was Greenwood Pilling. Many of these genealogies seem to have West Riding connections but not to bordering Lancashire where my ancestors lived.

Summary and Conclusions

This could be a good place to stop. I want to continue this Blog as I have come up with a better way to present my results.

  • Walking the clusters back is a good way to look at your clusters.
  • This is a way of organizing your cluster, making sure you have contacted the important matches and making sure the clusters are placed in the right area of your genealogy.
  • I started my clusters with a 50 cM limit. From there I went to a 40 cM limit and went down by 5 cM increments until I got to 20 cM.
  • The clusters did a good job at identifying my most recent brick wall, Jane Spratt born about 1830 in Ireland. From there I was able to place Jane in the correct Spratt tree, though I could not tell for sure which branch she was from. This could further direct genealogical research.
  • I tried to connect other genealogies from other clusters with limited success.
  • I came to the realization through this analysis that I have DNA matches with two separate Wilkinson lines descending from my ancestor Mary Pilling.
  • As I walked these clusters back, some split cleanly into two parental clusters, some didn’t. Some unknown clusters split into further unknown cluster as might be expected.

To be continued….

Where DId My Bradford Ancestors Live in Massachusetts? Part 1 Hannah Born 1838

As we come upon the 400th anniversary of the Pilgrims, it strikes me that I’ve had ancestors living in Massachusetts all that time. I started working on where some of my Bradford ancestors lived here. This Blog will start to fill in some of the blanks.

Starting from My Most Recent Bradford Ancestor – Hannah T Bradford (1838-1889)

I don’t have a good photo of Hannah. She married Isaiah T Snell who is pictured here smoking a pipe:

Isaiah married Hannah Bradford in 1839 and Alice Besse in 1891. Depending on the date of this photo would depend if this is Hannah or not. I believe that this photo was taken from the Southern part of Snipatuit Road. Here is a map from 1879 showing where Isaiah and Hannah lived:

Isaiah’s father Otis sold him his house and Otis moved a little further North. Hannah and Isaiah probably moved to this house around 1868. Hannah died in 1889. At the time Hannah married in 1859, she was living in Wareham. Hannah was also born in Wareham to Harvey Bradford and Wealthy Hathaway.

Hannah in 1840

There will be some overlap here. Here is Hannah’s father Harvey Bradford, transcribed as Harry Brasford in the 1840 Wareham Census:

My thinking is that Harvey worked at an iron or nail factory in Wareham. Here is a transcription from FamilySearch:

For some reason, I would really like to know where the Bradford family lived in 1840. The assumption is that people who were enumerated near each other lived near each other. This should be the case more than not.

The key here seems to be that Harvey Bradford lived near Thomas Pierce. In 1850, there was a Thomas Pierce in the Census:

Thomas was 54 and was living near a Weghtinton and a Whitterman.

Here is Thomas in 1855 which is near the time of the 1857 Plymouth County Map:

He was a laborer, but these were the occupations of the people around him: farmer, miller and nailor. I can’t make out one of the occupations – probably an iron worker. Here is where I think that was in 1857:

On the left at the house of R. Hathaway is where Harvey’s wife Wealthy Hathaway grew up in Rochester. There were many iron works in the area. T Pierce on the map is probably Thomas PIerce and R Wrightington is probably the Richard Wrightington of the 1855 Census or Weghtington of the 1850 Census. Richard was a miller – likely at the nearby Grist Mill. Harvey may have worked the place marked as “Nail Mfy. & Grist M.” on what is now Paper MIll Road.

Here is  the 1840 Census summary:

This shows one person worked in agriculture and one in manufacture and trade. Wealthy had two small children at the time. Did she work in manufacture or did Harvey? I think that Wealthy’s father was a farmer, so perhaps she worked a farm and had the kids with her, or was it the other way around? Henry C Bradford was listed as a nailor in 1850 at age 17, so perhaps he followed in his father’s footsteps.

Papermill Road

Pierce and Wrightington are shown on what is today Papermill Road in Wareham.

This puts Harvey Bradford and family somewhere in the vicinity of the intersection of Papermill Road and Main Street.

A Wrightington/Taber Connection?

In 1850, there was a Cyrus Taber living in the house of Richard Wightington, the miller. This Cyrus was a sailor:

As opposed to two others in the household who were nailors. This Cyrus was apparently born about 1824. I note this because Henry C Bradford, the brother of Hannah Bradford married Rhoda Ann Taber believed to be born in Fairhaven in 1838. She was also believed to be the daughter of Cyrus Taber and Patience Votar.

Travel down the railroad tracks a few stops to Fairhaven in 1850:

Here is a household headed up by Samuel Taber. Henry Bradford’s future wife Rhoda is living there along with two other Cyruses. Also two of the Tabers are Mariners. Patience Taber is listed as having a nervous derangement. Are we confused yet? The 1850 Census didn’t give family relationships.

Adelaide Taber

Adelaide from Robert the Miller or ironworker’s (or sailor in 1860) house. She ends up marrying a 62 year old carpenter in 1877:

Her mother is given as Ruhamah D Taber:

Further down on the same page of marriage records:

Rhoda Bradford (originally Taber) marries William. This is his second marriage also. So Adelaide was Ruhamah’s daughter. Ruhamah then apparently marries Richard Wrightington:

I think I’m getting into some complicated stuff. Adelaide says she was born in Wareham.

Cyrus Taber Born About 1824

Cyrus dies single in Wareham in 1885:

However, his mother is ‘Rheuhama’ Hathaway. So now I need to amend my story. Ruhama Hathaway must have married Cyrus Taber and had at least two children. She then marries Richard the Miller. So not as wild as it originally looked.

Cyrus Taber the Elder

There are some court records of Cyrus:

There is no date on this, but it is listed between an 1820 and 1822 case.

I assume that Cyrus the elder was around at least until 1839 when daughter Adalaide was born.

Ruhama Hathaway Born 1801

Turns out I already have her in my family tree:

Ruhama had Hathaway’s on both sides. I descend from Simon Hathaway who was also a son of Arthur Hathaway.

The Fairhaven Tabers

Samuel Taber Born About 1787

I’m hoping I can tie the Wareham and Fairhaven families together somehow. Fortunately Samuel remarries:

We learn his father’s name at least. These two families are not coming together that easily.

Cyrus Taber, Mariner, Born About 1810

I found 10 trees at Ancestry for Cyrus and they all give Samuel as his father. Samuel’s parents were Amos Taber and Deborah Hammonds. It looks like I am unable to make an easy connection between the Taber’s of Wareham and the Taber’s of Fairhaven even though there is a Cyrus Taber in each of the two families.

The Wrightington/Hathaway Connection

It looks like there was more of a Wrightington/Hathaway connection. In fact, there could be a story here. Ruhamah Hathaway born 1801 was originally the wife of Cyrus Taber the blacksmith from Wareham and Middleborough. He apparently dies and Ruhamah marries Richard Wrightington probably sometime in the 1840’s. Harvey Bradford is living next to or near Richard Wrightington in 1840. Perhaps he worked with Richard or for him at that time and/or prior to this time.Harvey marries Wealthy Hathaway who is a second cousin to Ruhamah.

Summary of Hannah T Bradford Snell’s Living Places

I have that Hannah was born in Rochester in 1838. This is based on her death record. A court case from 1835 names Hannah’s parents Harvey and Wealthy Bradford as being of Rochester.

Apparently, the family moved back and forth. I believe that Harvey worked in the nail or iron business in Wareham. Wealthy’s father Joseph Hathaway had died in 1815, so it may be that they lived for a time with Wealthy’s mothder at the Hathaway house. Or it is possible that Harvey helped work the Hathaway farm at this time.

In 1840, the Census has the family in Wareham. Based on my look above, they could have lived in the area of Paper Mill Road and Main Street. Wareham. They possibly lived near Richard Wrightington who at different times was listed as a miller, an iron worker or a mariner.

Harvey’s death was listed as being in Rochester, but this was based on his burial at Sherman Cemetery.

G.R. 7 is the Sherman Cemetery. Another possibility is that Harvey could have been buried elsewhere but a monument erected at this cemetery later. Hannah would have only been about 2 at the time of her father’s death if I have her birth correct.

In 1850, when Hannah was 11, she was living in Rochester. This was probably the High Street Hathaway House:

Hannah was living with her brother, mother, single Aunt Priscilla and grandmother Experience Cowing Hathaway. Here is says that Hannah was born in Wareham, so this is different than what I said above.

Hannah’s grandmother Experience died in March 1855. At the time of the 1855 Massachusetts Census taken on 20 September 1855, Hannah and her mother Wealthy were living with Mercy Snow.

In 1850, Mercy Snow was living at the house of Nicholas Snow, so this is likely the same house. Nicholas was likely her brother. Mercy was the single daughter of Nicholas Snow and Hannah Dexter.

In 1859, 20 year old Hannah marries. She and her mother are with Isaiah Snell in 1860:

The Census was taken on July 7, 1860. On July 15th, Otis Harvey Snell is born. Isaiah is listed between Gammons and Rounseville, so if the enumeration was taken in order, the family should have been living on Rounseville Road:

Isaiah appears to be listed as a shoe maker.

In 1865, Hannah may have been living in the same place. My records seem to indicate that Isaiah bought his father’s house in 1868, but I may be off. It appears that Hannah and Isaiah moved out of the house they were in because I still see Lydia Pierce and John King between Rounseville and Gammons. I’ve taken the 1865 Census and put the number of enumeration next to the house when I could identify it. I assumed, based on the numbering that Otis Snell was still living at Snipatuit Road:

One interesting thing was that I saw Henry Bradford, Hannah’s brother enumerated between family 16 and 18. That would put them possibly in the house listed as J.L. Braley. I listed Blackmer wrong as 34. That should be 35. That could mean that Hannah and Isaiah were living in the Bolles house or in the area. However, I didn’t identify families 37-41 on the map. These were:

  • Roxana Ashley (B Ashley on the map?)
  • Samuel B Staples, Wheelwright
  • Paul Ricketson, Farmer
  • William F Sherman, Mariner
  • Abraham Spooner, Laborer

By 1870, the family was definitely in the house that Otis Snell used to own. Ironically, Otis bought the Snow house where Hannah was living in 1855:

The above is from an 1879 map. E.M. Bumpas, blacksmith is enumerated next to the Isaiah Snell family in the 1870 and 1880 Censuses. Hannah died in 1889. I assume at the above location.

Summary and Conclusions

  • It is a little difficult to figure out where ancestors lived, but it can be rewarding
  • If an ancestor owned their land, that land may be traced through the Registry of Deeds. If not, there is some more guessing involved. The use of the census plus maps helps in that case.
  • Finding where an ancestor lived is helpful for the genealogy. It also adds color to the life and may bring about connections or lead to more information.
  • While looking for where Hannah Bradford lived, I found a clue to where her brother Henry Bradford may have lived.
  • After moving about in her early life quite a bit perhaps due to her father’s early death, Hannah settled down to the South part of Snipatuit Road once she married.


My Father’s Cousins’ Ancestry Thru-Lines: Part 2 – Bradford

I would like to look at my father’s cousin Joyce’s Bradford Thrulines. Our most recent Bradford ancestor was Hannah T Snell:

Hannah was born in Wareham in 1838 and married Isaiah Snell. This family lived in Rochester, MA where I grew up. The DNA that Joyce shares with these people is half Snell and half Bradford.

Harvey Bradford ThruLines

Harvey was born about 1808 in Plymouth, MA:

Harvey only had two children. Patricia is my second cousin on another line. These relationships are fairly close, so no evealuation is needed.

Samuel Bradford 1755

By the third set of Bradford ThruLines, we are already back to 1755. Harvey was the youngest son of Samuel. Samuel is important as the link between him and Harvey is weak. There is no known birth record for Harvey. Harvey is linked to Samuel through land records.

Robert and Joyce have a 9 cM match. In the expanded view, Ancestry is suggesting I evaluate Robert’s mother and grandfather:

The link between Barbara and her son would be a little difficult to prove. I assume he knew who his mother was. He and his brother are mentioned in an obituary. Barbara is listed as 11 months old in the 1920 Worcester, MA Census:

That is a little at odds with her posted birth of 1917. Here is her birth record:

This also shows that her father was born in Boston:

Oscar Bradford

Someone helped me out by saving this record:

This shows Oscar’s father as Alexander O Bradford. Here is the family on Washington Street, Boston in 1900:

I like how someone did a great job researching this family:

Here is Alexander the father in 1870 in Cambridge:

Too bad all my research isn’t this easy:

Now we have a middle initial and are getting back to Stephen Bradford and Hannah as parents to Alexander.

Here is Alexander W in 1850 in Duxbury:

Stephen Bradford was a cooper. I believe that Stephen’s father Samuel took over his father-in-law Stephen Churchill’s cooper business. So then he likely passed it down to his son Stephen. Here is a record I transcribed:

So easy with all the research others have done. As I mentioned above, Stephen is very important as being the brother of my ancestor Harvey Bradford. Here is some information I already had for Stephen on my own tree:

That confirms the ThruLInes between Joyce and Robert. The genealogy holds together. The DNA adds evidence that nothing got messed up along the way.

I should note that my cousin has a competing ThruLine that traces the lineage up through Harvey Stetson Bradford. I will probably look at that at some time.

Heading Up a Level to Josiah Bradford Born 1724

This is interesting:

Joyce shows 2 DNA matches through William Bradford and 10 DNA matches through an additional Samuel Bradford. That sounds confusing. That implies to me that 10 people got their genealogy wrong or that Joyce matches 10 people that descend from a different Samuel and Ancestry connected the trees in the wrong way (or perhaps a combination of the two).

Starting with William Bradford Born 1749

This looks like the easy part:

This shows that Liz is and Michael are 2nd cousins to each other and that they both match Joyce. Liz and Michael share a common ancestor of Josiah Bradford with Joyce. Ancestry would like me to evaluate these two lines. I’ll start with Liz and create my own tree for her:

Above is the family in Colleton, South Carolina. I’ve got to get them back to Bradford in Massachusetts. Richard’s mom above is supposed to be a Bradford. Here they are in 1880:

According to this Census, both of Amanda’s parents were born in South Carolina. That’s OK, it is still a while to get back to 1724. Here Richard is transcribed as Harven. I suppose for his middle initial.

Amanda’s death certificate is important as it gets us back to Bradford and Plymouth, MA:

That means that the 1880 Census was probably not correct.

Here is the 1850 Census – still in Colleton, S.C.:

So apparently Jesse was the one making the jump from Massachusetts to South Carolina. I wonder where that put the children during the Civil War?

Here is a flowery obituary for Jesse:

Jesse Bradford Born 1790 and Maria

The tree that Liz created has Maria as a Thornton. An Ancestry suggestion has her as Lovell:

I think that I would tend to go with this record, but it doesn’t really matter as I’m trying to find out more about Jesse.

Here is where I have Jesse on my Ancestry Tree:

This is the information for William Bradford born 1749 in Plymouth. William was the brother of Samuel Bradford, my ancestor. The bad news is that there is not a lot of information out there about Jesse. The good news is that the DNA matches give supporting evidence for the trees that we do have.

Michael’s ThruLines

Michael’s tree is not as extensive as Liz’s tree:

The 1910 Census joins Frampton with the Liz’s Wichman family above:

Now, the Other Samuel Descendants on the ThruLines

It turns out that the other descendants, I already know about. They descend either from my great-grandmother Annie Snell Hartley or one generation back. The Mayflower Families, which is one of the best resources for Bradford genealogy, has no birth date for Samuel Bradford. So differences in his birth date would be expected. In either case, he is still the son of Josiah Bradford and Hannah Rider.

ThruLines to William Bradford Born 1686

Now this is going out a ways. But let’s try it:

This shows as two matches for Joyce, but really amounts to one. CH is related more closely through Hannah Bradford. It is just spelled differently in his tree. I’ll try PK’s tree. PK’s tree goes up to Mary Bradford:

I’m not sure if the DNA test goes with the daughter or granddaughter of Prescott. From the ThruLines, it looks like the daughter. This Thru-Line would also support that my line goes up through Harvey to Samuel to Josiah to William Bradford. The ThruLines shows PK as a half 6th cousin. Ancestry doesn’t always get the half relations right, so I’ll check that out also.

I get a bit stuck before 1860 with my own tree:

Here is Charles and his mother in Boston. The father is presumed dead by this time. One tree had this reference:

That same tree has reference to an Averill Family Genealogy Book:

Here is more from the same book:

Here is some more on Daniel Averill from that book:

The section on Daniel mentions no Mary Gardner and no Charles Averill born in Boston. In fact all these children of Daniel are born in New Hampshire. PK’s tree has Charles born in 1845 to a Daniel who was born 1762. That would make Daniel quite old at Charles’ birth. 83? I’ll pull the plug on this ThruLine. There may be a connection, but I don’t see it right now. Another way to look at it is from the top down. William Bradford born 1686 had a son William born 1726, but he died the same year according to the Mayflower Families Through Five Generations.

My Father’s Cousin’s Harvey Stetson Bradford ThruLines

I had mentioned above that my second cousin shows different ThruLines for the same ancestors. I would like to look at this. There are only two Harvey Bradford’s that could be our ancestors. I have one and she has the other. I think mine is right, so I would like to disprove hers.

Here Holly has her line going up through her father Maury to Harvey to Charles Bradford. In the ThruLines I looked at earlier in the Blog, I had this:

That means that they can’t both be right.

My guess in the match between Maury and David is that David’s tree may be right but Holly’s may be wrong. Here is David’s tree in more detail:

For some reason, both trees go through Harvey S Bradford. David’s actual tree stops at Anna Maria Bradford:

Ancestry put the rest together.

A Tale of Two Harvey Bradford’s

Findagrave.com has this information for Harvey Stetson Bradford:

Here is some more on Harvey Stetson Bradford:

Another cousin took this photo:

This is from the Sherman Cemetery in Rochester, MA:

It appears that both these Harvey Bradford’s were born in 1809. Hence the confusion. However, one was buried in Illinois and the other in Rochester, MA.

So I have proven that Harvey Stetson Bradford was not my ancestor. I still don’t know if David above descends from either Harvey. However, as my ancestor only had two children (Henry Clay and Hannah Thomas), I would say that David did not descend from my ancestor Harvey Bradford:

Summary and Conclusions

  • The most important ThruLine I looked at was between Joyce and Robert. They show a DNA match and a common ancestor with Samuel Bradford (born about 1755) who was the father of Stephen on Robert’s side and Harvey on Joyce’s side.
  • It was easy to show the connection from Robert up to Stephen and Samuel based on research that had already been done.
  • I tried to connect Joyce to PK who showed a potential common ancestor in William Bradford born 1686. However, I found too many problems with PK’s tree to make that connection.
  • Finally I looked at Thrulines connecting another of my father’s cousins Maury to David. This showed ancestry to Harvey Stetson Bradford. But I showed that that Harvey Stetson Bradford was not my anctestor. There were two Harvey’s born in 1809. Harvey Stetson Bradford was born in Maine and died in Illinois. My ancestor Harvey (not Stetson) Bradford was Born in Wareham, MA and buried in Rochester, MA.


My Father’s Cousin Maury’s Hartley Ancestry Thru-Lines – Emmet and Howorth

In my previous Blog, I evaluated a Baldwin Thruline that my father’s cousin Joyce had. Turns out it wasn’t right, but lead to some interesting refinements in our shared Shackleton Line. My father’s first cousin Maury has this suggested person in his ThruLines:

A 3rd great-grandmother doesn’t seem that far back, so let’s take a look. Here is my great-grandfather’s tree:

I have that Edmund Emmet was married to a Sarah, but I don’t have the last name. Here is Isaac’s baptismal record:

I wonder where Soo Clough is. A clough is apparently a ravine:

(Northern England, US) A narrow valley; a cleft in a hillside; a ravineglen, or gorge

Apparently I had previously identified this in a Blog:

In the 1851 Census, Isaac gives his birthplace as Sou or Sow Clough:

I did find this Padiham marriage of Edmund to Sarah Collins, but this would have been after the children were married:

Padiham is near Burnley, so the date and place is off. Edmund Emmot is from Newchurch in Rossendale. Here is Newchurch in relation to Sowclough Road:

The above marriage is likely reflected the last birth below:

Habergham Eaves is South of Burnley.

Here is a tree with Sarah Broughton:

There are some problems with these dates. I have that Edmund Emmot was born 1759. I don’t know when Sarah was born, but I made a guess at 1765. If George Broughton died in 1692, it would have been difficult for him to have a daughter anytime in the 1700’s.

I did find this burial record from May 30, 1801:

This appears to be Lane Head above Bacup:


If I have this right, then the family moved and had a death of a young child. Actually, this area may be the better choice:

Next Victim: Mary Bridge

This is a new name to me. Here is Maury’s ThruLIne:

Maury matches Diana by a small amount of DNA and they show as potential 4th cousins. I’ve never heard of the name of Mary Bridge. In my tree, I have a Mary as the wife of James Howorth born 1768. I do have that James and Mary Howorth had a son named Abram born in 1814.

I’ll try to re-create Diana’s tree and see if I come up on the same place. Pretty soon on Diana’s side I am back to her maternal grandfather:

I have him born in 1869, but Diana has him born in 1878 in Stacksteads:

Here is Fred and family in 1871 in Bacup:

Here is Diana’s tree:

I’m trying to work towards Abraham Howarth on Diana’s tree. Here is an important marriage record:

I find this interesting because Elizabeth was living at Underbank, Bacup at the time of her marriage in 1859. My 2nd great-grandfather was living at Underbank when he married Ann Emmet in 1851. Ann’s mother was Esther Howorth. Small World. This makes me think I am on the right track or that there are a lot of coincidences.

So in 1859, Elizabeth was 21, so born about 1838. Diana has Abraham marrying Lavinia Clegg in 1844, so that is not right. However, Lavinia was Abraham’s second wife:

Parting Ways At Abraham

Here what I have for Abraham in my tree:

Abram was born in 1798 in Hogshead, South of Bacup. This appears to be him in 1851:

For some reason, his children only get initials this year. After a little searching, here he is in 1841 at Greens:


Next page:

Betty above is 4. She is hte one we were looking for. Fast forward to 1861. Here is Elizabeth saying she was born in Greens:

Drawing Out the Relationships

At this point I put all the people into a chart. But first, I have to fix my old chart:

Unfortunately, I have to send Lavinia back to Manchester. For some reason, I had two Abram’s in my tree. One was 1798 and one was 1814. Above, I was looking at the 1798 Abram. It seems like I remember writing to someone about Fred Taylor. I guess I’ll have to get back in touch. I created the above chart when I wrote this Blog.

Here is the correction:

I have Diana in yellow to distinguish from the green testers who have uploaded their results to Gedmatch for analysis. At least I don’t think she has.

Next, I’ll put the tree in chronological order:

I see I never looked into Mary Bridge. Maybe some other time.

Summary and Conclusions

  • This Blog went fairly well. I was unable to prove the first suggestion of Sarah Broughton in my line.
  • In the second part, I never got to Mary Bridge, but I did straighten out the Abram/Abraham Howorth Line.
  • The Taylor and Hartley branches had somewhat of a parallel history except that the Taylor branch went to Australia and the Hartley branch went to Australia.
  • I would still like to assess Mary Bridge. Also the Abraham line needs a last name for his wife Ann.


My Father’s Cousin Joyce’s Hartley Ancestry Thru-Lines: Part 1 – A Baldwin Leads to a Shackleton

I have been looking recently at Ancestry’s Thru-Lines. These include ancestral connections suggested by family trees and DNA matches. My father’s cousin is Joyce and she matches me on her maternal side:

So that is the side I am most interested in right now. Then I am more interested in Joyce’s maternal grandfather James Hartley’s side as that side is less defined than the Snell side.

Here are the ancestors of James Hartley born 1862 in Bacup, Lancashire, England:

Joyce’s Thru-Line suggestions start at her fourth great-grandparent level which is represented by the last column on the right above. However, I am not convinced of all the people that are already in that column – especially John Hartley, Anne Bracewell, Nathaniel Baldwin and Margreatt Baldwin. Part of the reason I’m not convinced of them is that I’m not totally convinced I have their children right: James Hartley and Betty Baldwin. They were just my best guesses.

James Hartley 1763 Thru-Lines

Ancestry shows the Thru-Lines for James Hartley incorrectly:

Joyce does match Ruth by DNA but John Pilling was likely not the father of John Pilling. John’s father was Mary Pilling who later married Robert Hartley. That would make Joyce and Ruth 1/2 3rd cousins once removed. The Thru-Lines for Mary Pilling is half right:

Richard is shown as a half relative which is right, but Ruth is shown as a full relative which is wrong.

Baldwin Thru-Lines

It would be interesting to look at the Baldwin Thru-Lines as Betty  Baldwin was a best guess that I made years ago for an ancestor. If I have the right ancestor, she was born in Bradley:

This appears the same Betty Baldwin that I picked to be Robert Hartley’s mother. She was born in Bradley. Here is Bradley at the orange circle below. Turns out that Nelson which didn’t used to exist grew up around it:

My thinking is, that if we can show a DNA match to the right Baldwin family, that would lend credence to my guess that I descend from Betty Baldwin.

Here are the Nathaniel Baldwin ThruLines:

My 2nd cousin Holly should be in the first column with Joyce. Let’s look at the two DNA matches on the right. It will be important to evaluate them:

Marilyn and Steve both match Joyce. Let’s look to see if their genealogy matches with what I think mine could be. When I click on the child of Nathaniel Baldwin, it goes to a site that has many trees managed by Helen. The first tree has over 50,000 people in it. I’ll look at that one. Here is part of her big tree:

Unfortunately, her daughter of Nathaniel is listed as private. Nathaniel’s wife is Margaret, so that matches with the birth record I had for my Betty Baldwin. Next, I have to look for a marriage for James Farrar. Here is one:

Here we have some competition for Betty. If this was the same Betty born in 1771, then she would have been 21 at the time of her wedding to James Farrar.  How do we reconcile that marriage with this one?

This is 9 years later, so if this was the same Betty Baldwin, she would be 30. There seems to be a few possibilities:

  • This Betty married twice, but wouldn’t she then be a widow rather than a spinster the second time?
  • These were two different Betty’s

My guess was that this could have been James and Betty living in a section of Trawden called Hole in 1841:

Now, I don’t know if this James and Betty are the parents of my Robert, or if they are another James and Betty. Dates for the 1841 were rounded up to the nearest 5 years. So if this is the same couple that got married in 1801, they would have been at the oldest 39 and 29. If this was a 70 year old Betty Baldwin in Hole in 1841, then that could fit in with her birth in 1771. That would mean that James Hartley would be between 76 and 80 at the time of the 1841 Census and would hae been born between about 1761 and 1765.

There were about four James Hartley’s baptized in the Parish of Colne between 1761 and 1765:

Ollin Hall is interesting because the family did live in the Hollin Hall area of Trawden. However, this was an Inghamite baptism. As far as I know, my Hartley ancestors were baptized at the Church of England.

A Few Maps

Here is a map showing Hole (near the bottom of the map), where a James and Betty Hartley lived in 1841:

In 1837, it appears that Mary Pilling (now Hartley) was living in Slack Booth:


If I read Mary’s baptismal record correctly, her Pilling parents were from Seghole:

The James Hartley from the 1841 Census is probably this James:

That would have this James born around 1863, which would most likely be the son of John and Anne Hartley born 1863. Here is a more original version of the burial record:

This is Little Lathe, which I take to be also Laith. Here is Little Laith:

Here is a confusing burial from 1840, a year before the 1841 Census:

This has Betty Hartley from a Hole House dying in that year. If she died in 1840, how is it that she appears to be living in 1841? Perhaps after she died, another Hartley relative named Betty came to live at the house to help out? At any rate, this Betty Hartley, if this was correct age, would have been born about 1775.

Next, I check out Little Laithe in 1841. It turns out that there was a different James Hartley living there:

Hartley’s, Hartley’s everywhere. This James was a little younger than the one at Hole.

Back to the ThruLines

I tried going from the top of the tree down – which is usually a bad idea. I’ll try the other way. I’ll try building a tree for Marilyn and Nellie Farrer. Nellie’s dad was Ernest. When he came to Ellis Island, the ship record listed his home as Accrington. Here he is in Accrington in 1901 at age 16:

Of interest here, Ernest’s mother was born in Colne.

She was a Foulds which I recognize as a Colne name. Here is the marriage record from Accrington:

I’m already back to the 1840’s:

Here is Alice in 1851 in what looks like Call in Great Marsden:

Alice’s mother was Alice Kippax:

One tree at Ancestry suggests that Alice’s grandmother was a Shackleton:

That is a name that is in my ancestry:

Henry Farrer Born 1847

The 1901 Census had Henry born in Brierfield. It turns out that this is not too far from Colne:

This appears to be Henry in 1861:

His widowed mother Christiana is heading the household. Henry is shown born in Marsden. His older brother is a railway porter. In 1901 Henry worked on the railway. In 1871, Henry was a railway engine fireman living in Colne:

Now I am starting to get stuck, because the tree suggestions for Henry give his mother as Sarah Greenwood – not Christiana:

If Sarah was the mother of Henry, she would have been about 51 when he was born. Here is some more information:

This clearly gives Henry’s father as Joseph. This must be Joseph’s marriage record:

This branch does not appear to bring me to Colne right now. Here is Deane and Over Hulton in relationship to Manchester:

This is likely Richard Farrar’s marriage record:

So my tree seems to go against the suggested trees at Ancestry. Here is Marilyn’s maternal side:

My guess so far, is that Joyce could be related to Marilyn on the Foulds branch. Hopefully the connection is not non Marilyn’s paternal side or on her maternal grandmother Bentley’s side.

Back to James Foulds

One of the trees above had John Foulds and Mary Shackleton for James’ parents:

Here we even have a Hartley as a witness. Here is the entry for James:

James was born in August of 1796 and baptized 22 January 1897. This is possibly Mary Shackleton:

Notice that there was a death of a Mary Shackleton less than a year before this baptism. Here is what I have so far:

Here is my tree for comparison:

There is a potential that Mary Shackelton born 1764 could be the sister of Nancy Shackleton born 1781. It looks like my tree could use some work:

I have Elizabeth born after both her parents died, so that can’t be right.

I also have that she was born in Hey Thorn. I don’t know where that is, but Hey is likely in Foulridge:

Bsaed on this exercise, I’ll take Elizabeth Shackelton out of my tree.

Also there was more than one John and Mary Shackleton, so that was confusing. On my Shackleton web site I have:

Very little is known about this family other than the father was a weaver. This family is not to be confused with the John and Mary Shackleton of Pasture. This John was a gentleman. He had 2 daughters that died fairly young with no children. According to Dennis Cairns, “Pasture House which is situated between Barrowford and the village of Roughlee. Our Shackletons lived at Pasture Meadow which is to the South of Trawden and Southweast of Hollin Hall.

Here is Pasture House:

Barrowford is to the West of Colne. Here is Pasture Springs:

I have that my John Shackleton died at Stone Edge, but that appears to be near Barrowford, so I may have the wrong person. Here is Pasture House in relation to Stone Edge:

Here is the 7 September 1788 will for this Gentleman John:

Will of John Shackleton of Pasture House, gent. — messuages called Stone Edge, Upper Lands or Burnt House and New House, and cottages called New Houses, all in Barrowford, with other specified properties there, to Trustees for daughter Jennet. To daughter Mary messuage called Fidling Clough in Thornton, co.York; also £1000. Pasture House, Whitticroft and other specifeid properties in Barrowford and Colne, to trustees for wife Mary for life, then to daughter Jennet, subject to annuity to mother-in-law Margaret Cowgill. To wife messuage in Thornton called Windle Field, and messuage in Kildwick, co. York, for life, then to daughter Mary. Etc. (Copy-)

Here is Jennet:

This must be daughter Mary:

Here is an excerpt from a book, Man’s Estate: Landed Gentry Masculinities, 1660-1900:

This book mentions John’s father and second wife, but not his two daughters. Here is John, son of Christopher:

All this shows, that the John I have in my tree is wrong:


Perhaps this marriage has a hint:

I don’t know if this helps or makes things more confusing. I had that Richard Farrar was the father of Joseph Farrar above, but that was on a different line. This could be the John of Pasture House:

The John may be the John of the marriage above, but that would make him only about 19 at the time of marriage.

This appears to represent three different branches of Shackelton:

Here is Park Hill:

I have noted Salter Syke above. Wicoller is part of Trawden, so more likely related to my branch of Shackleton. Also note the spelling is a bit different.

Just to confuse things further, a John Shackleton from Heptonstall married someone from Great Marsden. Let’s hope he moved back to Heptonstall:

Summary So Far

First, I showed that my connection to Marilyn’s ThruLines was not through my supposed Baldwin ancestor. Instead, it could be that the connection could be on my Shackleton side. Along the way, I ruled out the birth and death of my ancestor John Shackelton as that pair of birth and death dates belonged to another John Shackelton. That means that means that Christopher should also not be on my tree:

So that makes it interesting that Nicholas and Joyce show a ThruLine based in Christopher Shackelton:

Here is Nicholas’ tree:

Again, Ancestry wants me to evaluate Nicholas’ tree. Nicholas has his ancestor from Kirkby, Malham near Skipton, Yorkshire:

I think I’ll skip Nicholas for now as I don’t think my Christopher is right.

Summary and Conclusions

  • I went through an exhausting review of Marilyn’s tree to see if her supposed Baldwin line matched with my supposed Baldwin Line
  • I was unable to get Marilyn back to Baldwin
  • I was able to find a Shackleton in Marilyn’s line who lived in the area where my Shackleton ancestor lived.
  • I also was able to refine my Shackleton Line. Through additional research, I was able to separate a different more famous Shackleton Line from mine.
  • I found an additional ThruLine for Joyce with an erroneous Shackleton ancestor I had in my tree and decided not to follow that up.
  • ThruLines were helpful in correcting errors in my tree in this case.
  • There may still be a connection between Marilyn and Joyce on the Shackleton Line.