Raw DNA Phasing Six Siblings with One Parent – Part 2 Heterozygosity

Homozygosity – Zero to Eighty in One Day

In my previous post, I discussed Homozygosity. In that post, I got my brother Jim from zero phased to 80% phased in one day. Although raw data phasing is considered advanced, the principal of homozygosity is very simple. It just means that you have two alleles at a location that are the same. If your parent has two alleles the same, then you got that allele from that parent’s side. If you have two alleles the same, then you got that allele from both your mother and your father.

Heterozygosity – Two Different Alleles at a Location

Heterozygosity is a little more complicated. It means that you have two different alleles at the same location. Genetics tends to be binary which to me is very simple. Binary is yes or no. You either have XX alleles at a location or XY at a location. A heterozygous results is XY.

Whit Athey and Heterozygosity

Whit Athey has a paper on Raw DNA Phasing here. This is his third principle:

Principle 3 — A final phasing principle is almost trivial, but it is normally not useful because there is usually no way to satisfy its conditions: If a child is heterozygous at a particular SNP, and if it is possible to determine which
parent contributed one of the bases, then the other parent necessarily contributed the other (or alternate) base. This principle will be very useful in the present approach. 

Where is Jim Heterozygous?

I need to look at Jim’s Raw Data File. I’ll ask Access to find Jim’s alleles that are different:

Jim is heterozygous at a little under 200,000 locations:

Where am I going with this? In the last line above, Jim is AG. If I know mom is A, then Jim has a G from Dad at that location.

Getting Dad Alleles From Mom

In this Query, I am taking all of JIm’s Mom allele’s that have no corresponding Dad alleles. These are the allele’s that he got from his Mom being homozygous. Then I linked those results to Jim’s heterozygous results. That ends up looking like this:

There are over 96,000 locations where we can fill in a Dad allele for Jim. In the first line above, Jim has a C from his Mom. Jim’s results are C and T, so the T has to be from Jim’s Dad.

Putting It All Together – Adding Jim to My Other 5 Siblings

I could figure out how to get the T into the JimFromDad Column above. But I really need to get Jim into the Table I already have with his 5 other siblings and Mom. It would be nice to add Mom’s FTDNA results to that table also. Right now that Table has 26 columns and I want to add more.

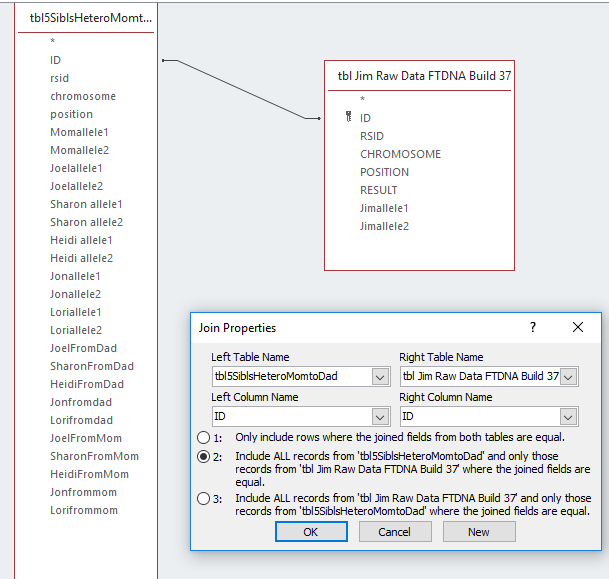
Here is the structure of the existing 5 sibling table:

I wasn’t too consistent on my capitalization. The sibling Dad alleles are grouped together as are the sibling Mom alleles. This is for comparison. These sets of Mom and Dad alleles will form a pattern that will determine the crossovers. The above table is called tbl5SibsHeteroMomtoDad, so it is at about the same stage that I am with Jim.

I’ll try this query to add in Jim’s Alleles 1 and 2:

Here I made an unequal join, but I don’t think that will work. I want everything from Jim’s list and everything I already had in the 5 sibling list. This will probably call for an Append Query.

In order to perform an Append Query, I need to have the same column headers. I copied the 5 sibling table and pasted it as a six sibling hetero mom to dad table. Then I added some columns for Jim:

I’ll also add some Mom and Dad allele columns for Jim. Next I open up Jim’s original download table into a Query:

I select Append at the top and choose the Table I want the data to be appended to:

I choose View to see what I have and it shows 720,449 records which sounds right. Then I choose Run.

This didn’t get me what I wanted. It added an extra row for Jim. When I sort by RSID, it looks like this:

It is giving Jim an extra row for his results, which I don’t want. Abort this mission.

A Right Join and a Left Join?

I can go back to my original thought. However, it will take two steps.

First I want to note that there are 942,647 rows in the 5 Sibling Table. There are 720,449 in Jim’s raw data table. I don’t want to lose any data along the way. I put an ‘is not null’ into Jim’s allele 1 column and got 720449 rows of data, so one query was enough. I like this so much, I’ll make a Table out of it:

This didn’t work so I tried repairing and compacting the Access database again. That seemed to solve the problem.

Now I have a new six sibling table. For five siblings, I have the Mom and Dad alleles of the first three steps. For Jim, I just have his raw data included so far.

Mom Vs Mom – Ancestry and FTDNA Results

Now I am wondering if I need to add Mom’s FTDNA raw DNA data to my table. Mom has 701,478 rows or positions at AncestryDNA. Mom has 711,398 rows at FTDNA. That is about 9,000 rows difference, so I guess it is worth it. It could make the Table more complicated for comparisons. If I can can combine, mom’s alleles into two columns instead of four, that would be better.

Here is my comparison of FTDNA vs. AncestryDNA for my mom:

This query will return all the RSID’s that are in FTDNA but not at AncestryDNA:

That is over 23,000 results. I will need these, if I am to recreate Jim’s results.

Getting Mom’s Extra FTDNA Results into My Six Sibling Table

First, I created a Query to find out how many RSIDs mom had from FTDNA that were not already in the six sibling table:

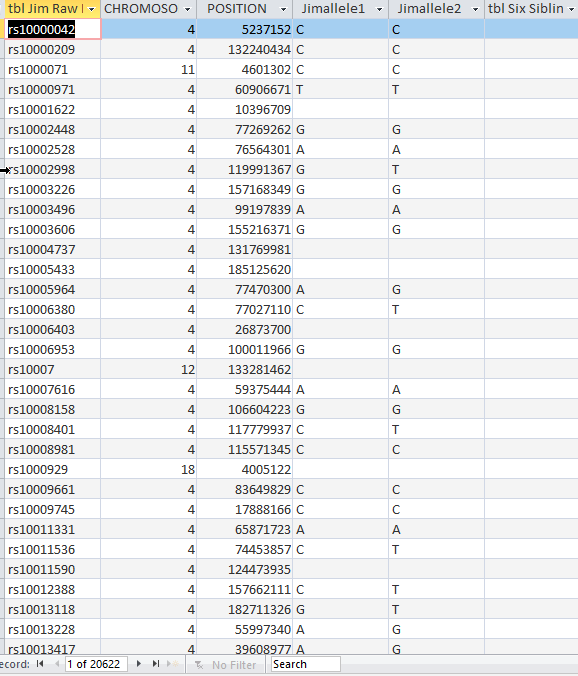
This tells me Mom has 17,935 positions tested that are not in the Six Sibling Table. However, if those are positions that Jim has, I will want to add those also. I checked and Jim has 17,835 positions tested out of mom’s 17,935. I was curious, so I checked Jim’s positions that weren’t in the Six Sibling Table and got 20,622. These are the details that bog me down.

Appending to the Six Sibling Table

I want a good Six Sibling Table, so I’ll append the 20,000 positions that Jim has that are not in the table.

Here is my Append Query:

The Query says to add only Jim’s raw DNA data to the Six Sibling Table that isn’t already there. When I view what is to be appended, I get the right amount of rows.

When I hit the Run button, I get this error:

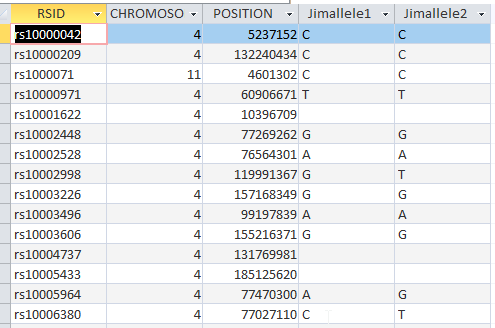
I was wondering if that would be a problem. I don’t want the extra rsid column. I need to save the underlying Query first. I did that and had the same problem, so I made a table out of the Query.

That looks better. I think this will work:

This worked. So now my master table has 963,269 rows. Bigger is better as long as it is good data.

My plan was to add my mom’s alleles, but so far I have only added Jim’s. When I now check the positions that Mom has that are not in the Six Sibling Master Table, I only get 100. There are actually only 99 extra rows as one was a header that I deleted:

I’ll follow the same procedure. I’ll make a small table for Mom and then append it. I’m not sure of the significance, as Mom may have no siblings corresponding to these alleles at this time.

Here is the new Master Table with Mom and Jim appended:

One More Master Table Adjustment

On the Six Sibling Master Table I added a place for Jim Dad and Mom alleles:

I probably should have done this before I phased Jim. However, the advantage is that I have Jim’s results separate from this table that I can check on. I can now re-do the processes to get Jim’s phased alleles or try to copy what I had into this master table. [Note I try to copy Jim’s results below, but the results are not good, so I end up recreating his results in the Master File that has the results of all six siblings in it. See section called Plan B below.]

I’ll try to use an Update Query to get Jim’s phased alleles into this master table.  Here is my Google search for Update Query:

Actually I thought of an easier way:

Here I took the whoe Six Sibling Table and replaced Jim’s phased alleles where he had none. I only get one shot at this, so before I do this, I’ll add Jim’s heterozygous phased alleles to his two homozygous alleles.

An Append Query for All of Jim’s Phased Alleles

I appended Jim’s Heterozygous phased alleles to his homozygous phased alleles.

Here is the point at which Jim’s phased alleles are based on what he got from his mom to what he got from his dad. There are only two problems:

  1. The name of the Table is now wrong, so I need to change it;
  2. I never added in the alleles that Jim got from Dad. That is OK as I have the information to do it.

Adding Jim’s Heterozygous Dad Alleles Based on Mom’s Results

Now I am back to where I was before I took a detour of incorporating Jim and my Mom’s FTDNA results into my existing five sibling table.

Here I’m going to cheat a little and look to see what I did in the past:

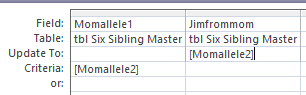
Here’s my sister Lori. Back when I knew more what I was doing, I had an Update Query whcih said, ‘When Lori’s allele 1 was not the same as her allele 2 [heterozygous] and Lori had allele 1 from mom, put Lori’s allele 2 in her Dad spot’. Seems like that should work for Jim.

When I press View, I didn’t get any results. I have a guess as to the reason. This may have to do with the situations where Jim got his Mom allele and he had no results for himself. I tried i this different ways and could not get this to work unless I took out the expression: <>[Jimallele1].

This makes me think that something is wrong with the Table. I checked for duplicates in the table and got 96,222.

So this is good to know. At rs1000002 there are two results. One has Jimallele 1 and 2 rfesults and one does not. However, at rs10000300 there are no Jim alleles and there is only one result.

Plan B – Work with the Six Sibling Master Chart

I checked the Six Sibling Master Table for duplicates and didn’t find any. I think I’ll just work with that Table.

Here is Step one from Whit Athey:

Principle 1 — If a person is “homozygous” at a location—that is, having the same base on each of the two chromosomes of a pair, then obviously at that location it is possible to know with certainty that both chromosomes of the pair have that base at that location, but this is an almost trivial form of phasing. 

I had a little practice trying to get the Update Query to work. Now I’ll try it on Jim’s results in the Master File. Unfortunately, I am still getting no results. I decided to go ahead and run the Update Query even though I saw no results in the View mode. This was after making a backup up the Six Sibling Master File. It looks like the update worked.

The Update Query was quite simple. It said if Jim’s allele 1 and 2 were the same, then give that allele to his Dad and Mom side.

Updating Mom’s Homozygous Alleles to Jim

The next Update Query will be similar:

This says if Momallele 1 and 2 are the same, give Jim one of those on his maternal side. Here is the warning:

Here are some of the results.

I hope to catch the blue line in the next query.

Updating Jim’s Heterozygous alleles where Jim has a Mom allele.

This Update Query says when Jim is heterozygous and he already has his allele 1 in the mom spot, put allele 2 in the Dad spot.

I am down to a mere 34,000 rows on this Update.


Next, I want to switch the alleles:

When Jim’s allele 2 is in the Mom place put Jim’s allele 1 in the Dad place. That should fill in these blanks:

Here is a summary of what I have for phased alleles for me and my siblings:

One interesting thing is that Jon has 751,171 maternally phased alleles. Jon only tested at 668,942 positions. The additional results must be where Mom had results at positions that Jon didn’t test at. That is assuming that I didn’t mess up somewhere.

One More Query for Fun

This is looking for childrens’ missing alleles from Mom when Mom has two alleles that are the same. I found a few:

These are likely positions that were not tested by my siblings. I made a quick Update Query to add those Mom alleles in for my siblings.

Summary and Conclusions

  • I started out looking at my brother JIm’s heterozygosity. I found out where he could have an allele assigned to his paternal side in the case where we knew his materal allele.
  • I worked on getting Jim’s results into the master file I have for his other 5 siblings. I also added some more of my mom’s alleles that were from FTDNA and not included in her previous AncestryDNA resutls.
  • I tried to get JIm’s alleles phased before I brought them into the five sibling file, but I ended up with duplicate results.
  • I decided to work with the Six sibling file which had no duplicates and recreate Jim’s phased alleles based on the principles of homozygosity and heterozygosity. I was able to do this quickly with Access Update Queries.
  • I now have a large master file with 30 columns. These columns have the raw data for my mom and her six children as well as their alleles that have been phased so far. I will be working with the last 12 columns in the upcoming Blogs. These are the patrernally and maternally phased alleles. They will form patterns that will tell me where the crossovers are.


Raw DNA Phasing Six Siblings with One Parent – Part 1 Homozygosity

I have written many Blogs on raw DNA phasing with my siblings and my mother. I have done this phasing using a Whit Athby paper and MS Access. I had my last sibling tested this past Summer, so thought I would see how his phasing would work using this method. The goal of this phasing would be to get four files of data representing the DNA from my four grandparents. I have four such files already, but they were created by M MacNeill a while ago and he didn’t have all my siblings’ data at the time. I would like to learn how to upload these files on my own.

Jim’s Raw DNA

Jim was my last brother to be tested. He was tested at FTDNA as that was the kit I had at the time. The first step is to find Jim’s DNA download from FTDNA and extract it. However, before I do that, I need to know what build to download. As I look at my old blogs, it appears that I was working in Build 37. Gedmatch has historically used Build 36. However, Gedmatch is being migrated to Genesis. Here is a comment I found on Facebook:

All Genesis tools natively work in B37 *meaning that all matching is done based on B37), but we decided to map all of the B37 positions to B36 and B38 when printing out segment start/end positions, with the choice given to the user which to display.

We will begin to migrate this to other tools as soon as we can. I hope you find it useful.

Build 37 DNA

All this to say that I want Build 37. I assume that I used Build 36 for Gedmatch, so I’ll do a new download for Jim:

I chose Build 37 Raw Data Concatenated. Unfortunately, my computer wants me to find an app to extract this file.

In the past, I have used Notepad, so I’ll try that. The gz file is about 6.4 MB. I can see Notepad was the wrong thing to open this with:

So I guess I need Winzip. I downloaded that and then opened Jim’s file. It opened as a csv file, but I saved it as an Excel File as that is what I will be using in Access. Jim has double A DNA:

Actually the DNA at the first position of his tested Chromosome was AA. He got an A from his dad and an A from his mom. Jim has a lot of DNA

This shows that Jim has 720,450 tested DNA positions. That is pretty good. However, there are some positions that don’t have results indicated by –. Between my mother, me and my five siblings there are about 4 million autosomal results to look at.

One thing that I notice that is different from this AncestryDNA file:

AncestryDNA has a separate column for allele 1 and allele 2. That would be better for me as I am trying to separate these alleles out.

This looks better. However, when I try to import this into Access, I get this error:

My guess is that Access does not like the dashes where there are no results. So I’ll take out every dash in Jim’s DNA results. That was close to 60,000 dashes. I tried that, but I still got the error. One on-line suggestion was to compact and repair the database. That seemed to work, but there was this problem:

I didn’t realize that there was a new header at line 702542. That imported like this:

Also for the AncestryDNA files, the X Chromosome shows as Chromosome 23, which should work better. My import to Access took out the ‘X’. After I removed the internal header and changed the X Chromosome to 23, I imported Jim’s raw DNA with no problems.

Giving Jim some Maternal DNA

Now Jim’s DNA is in shape for doing something with it. The next step is pretty simple. Every time my mom has two alleles that are the same, we know that allele is maternal for Jim. I originally tested my mom at FTDNA, so it would make sense to download her DNA from there.

Importing Mom’s DNA to MS Access

I already learned a few things from downloading JIm’s DNA from FTDNA. I used the same steps for my mom, except that I didn’t delete the dashes to see if that would make a difference. That gave me an error, so I deleted the dashes. Now I am in business.

My mom has 711,398 locations tested at FTDNA. This is a bit less than Jim’s  720,450 tested locations.

Next, I want to see what happens if I compare Mom’s ID’s with Jim’s ID’s:

Here at Access I have an equal join between the RSID fields of both tables. That results in 709,632 positions that Jim and Mom have in common. When I compare the positions between the two, I get 712,452. That is more than my mom had, so that doesn’t make sense. Actually, I shouldn’t be comparing by position, because those are positions along each of the 23 chromosomes. There may be repeats. That is good to know.

Where is Mom Homozygous?

If Mom’s Allele #1 is the same as Allele #2, that is called homozygous. I’ll perform this simple query on Mom:

I asked Access to show my where my Mom’s Allele 2 is the same as Allele 1:

Mom has that in 500,995 places. However, next, I need to get rid of the blanks:

I added Is Not Null to the criteria on the Result Column:

That gets me down to 496,136 homozygous positions. That means that more than 2/3 or almost 70% of Mom’s results are homozygous. Those are the alleles that will be Jim’s maternal alleles.

Where is Jim Homozygous?

Where Mom is homozygous, we’ll add a Mom allele to JIm. But first, where Jim is homozygous, we will add a Mom and Dad allele. I created a simple query in Access:

I’m creating two new columns for Jim. One will give me the alleles that Jim got from his Dad and the other will give me the alleles that Jim got from his Mom. In the criteria row I have that Jim’s allele 1 must equal Jim’s allele 2. When that happens, put in Jim’s allele 1 into the column. That gives me this:


That gives me over 500,000 rows of paternal and maternal alleles for Jim. However, I do have blanks. When I filter the blanks out, I get 491759 rows. That is a fast way to get almost 1 million alleles for Jim. Next, I’ll make a table of this query in Access. When I do this, I notice that Access has changed my query:

Access liked this better as it was simpler. I would think that JImallele2 does not have to be there twice, so I took one out and got the same result:

Access is trying to teach me to make better queries.

Adding Maternal Alleles from Mom

Here is a summary of where we are for Jim:


Just by assigning Jim’s own homozygoius alleles to his paternal and maternal sides, he is now 71% phased. I also see that mom had 496,136 homozygous alleles. These need to be added to Jim’s homozygous results. However, I want to be careful:

  • When I add Mom’s alleles, I don’t want to erase the ones I already gave to Jim
  • There may be homozygous alleles that mom had that Jim didn’t even test for. These could be added to Jim as bonus alleles.
  • In adding mom’s homozygous alleles to Jim’s list, we also have to add in where the position of those alleles are on the Chromosome and the RSID.

First, I note that mom has 496,136 homozygous alleles. This is more than Jim’s homozygous alleles.

First, I’ll create a query for Mom’s homozygous alleles.

Here I want there to be a non-blank result and I want Mom’s allele 1 to be the same as allele2.

Next, I’ll check to see how many of Jim’s homozygous alleles are the same as mom’s homozygous alleles.

I’ll do this by an equal join on the RSID which is a unique identifier. Here is what I get from this query:

However, there are still blanks there. I had trouble getting rid of the blanks, but I can temporarily get rid of them by filtering the results.

This gets rid of about 17,000 blanks.

This tells me that Mom has 496,136 homozygous alleles, but 381,721 of those Jim already has. That means we need to add 114,415 maternal alleles to Jim’s list. That would get his AllelesFromMom up to 606,174.

Next, I want to get a list of all of Mom’s homozygous alleles that Jim doesn’t have, so we can add them to Jim’s list. There is a little trick to getting this in
Access. First I create an unequal join:


On the query above on the left are all of Mom’s homozygous alleles On the right are Jim’s homozgous alleles that match Mom’s homozygous alleles. The #2 radio box is checked. That means I want everything on Mom’s side and everything where the RSID’s are equal. However, in the criteria, I’ll put an ‘is null’ on JIm’s side:

This adds 97,451 of Mom’s homozygous alleles to JIm. This is less than the 114,415 that I was looking for. One guess is that these are positions that Mom had tested that Jim did not. Somewhere I lost 7,000 of Mom’s homozygous alleles. Or this may have to do with the blanks in some of the tables. I was able to get rid of the blanks in Jim’s table and the new number came out right:

Adding 114,000 Maternal Alleles to Jim

Now that I’ve found 114,000 maternal alleles for JIm, I’d like to add them to his table. There are probably a few ways to do this in Access. One way is called Append Table. I’ll try that as I will need that later on in the process. If only I remembered how to do that. I could put Jim’s table into Excel and just add Mom’s table. However, I’m not sure Excel will appreciate the large files.

The directions that I found for Append Query said to use the data you want to copy first. That was in this Query:

What I want to add is from a Query called Mom Homo Jim Missing. These were Mom’s extra alleles. I chose to append these to a table called Jim Homozygous. But on second thought, I want it going to a new table, so I’ll copy Jim Homozygous and call it Jim Plus Mom Homozygous. First I want to review the results using the view button. I guess it looks right. It only shows the records to be added. Then I push Run and I get a warning saying that this cannot be undone.

Here is what the Appended Table looks like:

This is the point at which the appending took place. What I wasn’t expecting was that Access added the ID. This is the ID that Access originally assigned to the raw data. So now I have Jim’s ID’s and Mom’s ID’s in the same Table.

Phased Allele Update Alert

These two operations based on homozygosity alone put Jim’s phased alleles at over one million. Bing, bing, bing. Jim is already almost 80% phased. Maternally, he is close to 88% phased.

Other Phasing – Visual

I’m not the most experienced raw data phaser in the world, but I have worked on three, four five, and now six sibling raw data phasing. I have also done a lot of work with three, four, five and six sibling Visual Phasing. Here is Chromosome 1 using the Steven Fox Spreadsheet:

I can use the raw data phasing to confirm the Visual Phasing. I can also use the Visual Phasing to know where to look for crossovers. For example, I already see a problem with the map above in the bottom right corner. I will need to change the crossover designations there.

The other reason stated at the top of the Blog is that I should be able to create a file to upload to Gedmatch for each of these four grandparents. That could make searching for DNA matches easier.

Summary and Conclusions

  • I started phasing the sixth of six siblings based on homozygosity.
  • Using homozygosity alone, I got my brother Jim up to 80% phased.
  • Raw data phasing is considered an advanced topic, but the basics are quite simple. If you have two alleles that are the same, one must be from your father and one from your mother. If you are a parent and you have two alleles that are the same, you had to have passed down that same allele to your child.
  • I also used MS Access which is best suited for large databases.
  • My goal is to get four grandparent files to upload to Gedmatch (or Genesis). In the past, I have run out of steam on these projects.
  • I will be able to use my past work on visual phasing as a roadmap to finding crossovers and assigning grandparents.
  • I should be able to use my past raw data phasing experience to streamline the process.
  • With six siblings, I am expecting good results. However, as in the Visual Phasing process, the more siblings you have, you will have more combinations of sibling comparisons you have to look at.
  • Next up, I expect to look at heterozygosity.


Fun With an AncestryDNA Lentz Circle

My Lentz Line has been difficult to nail down. The genealogy has been difficult and it has been difficult to assign a lot of DNA to Lentz ancestors

My Lentz Circle at AncestryDNA

Ancestry has been helpful in the Lentz area. Here are my AncestryDNA Circles:

Lentz is one of my smallest circle with 9 members:

Six of those 9 members are from my family. That leaves two other groups with a total of three people in them. In the Deborah Family group, there are two Deborah’s. They appear to be mother and daughter. I built out the tree of the mother and found a common ancestor in John Lentz. Then I found the tree of the daughter Deborah and she had already built out her tree as seen here:

John Lentz is on the younger Debbie’s mother’s father’s father’s line or her great-grandfather Davenport’s Line. This matches up well with my Lentz Web Page:

I was unclear as to whether John had one or two wives. Debbie has identified the wife as Elisabeth Riehl. I didn’t follow the line down of William Andrew. However, I have more information on my Ancestry Tree, which puts my Web Page out of date:


Lentz DNA

One interesting thing is that I do not match either Deborah at AncestryDNA. They do, however, match my mother and some of my siblings. Here is my mom’s match with the elder Deborah:

What is more interesting is that the younger Debbie uploaded her DNA results to Gedmatch. This is what the match looks like between Debbie and my Mom:

By DNA, my mom, Gladys and the younger Debbie could be fourth cousins. However, Debbie and her mom match my mom at about the same amount of DNA. That means Debbie’s mom passed down all the Lentz DNA that matches my mom to her daughter. This DNA match is on the shortest Chromosome.

Visual Phasing for My Siblings – Chromosome 22

I performed visual phasing on my DNA. Here is what I had for Chromosome 22:

This matches up with what Gedmatch shows as Debbie’s matches with my family:

In this case the reportable matches start at about 15M, so that is where Jim, Heidi and Lori have Lentz DNA shown in green on the left hand side of my Chromosome 22 map above.

A Lentz DNA Tree

I have drawn a tree of the Lentz descendants who have had their DNA tested. I had missed Debbie, so she is not there yet:

I am on the left side of the tree. I also descend from the Nicholsons and get a lot of matches with that family. The right side of the tree is more specific as I have no Nicholson relatives there, but the relationships are further out. I am already tracking two people from the William Andrew Line there.

Here are the two Deborah’s added in:

This shows that my mom is a fourth cousin to the elder Deborah and I am a 5th cousin to the younger Deborah.

Here is how Debbie matches Radelle, Al and Stephen on Chromosome 12:

This suggests triangulation between these four people which would indicate a common ancestor:

My mom matches Radelle and Deborah, but on different Chromosomes. Hence, the Ancestry Circle.

Painting Debbie’s Match to My Mom

This is what I had previously for my mom’s John Lentz DNA based on her match with Radelle. That match is in dark green.

I need to add Mom’s Lentz DNA to Chromosome 22:

This doesn’t look like much, but it doubles what my mom had on Chromosome 22 previously.

Summary and Conclusions

  • Reviewing my AncestryDNA Circles lead me to a Lentz descendant who I had overlooked.
  • One of the people in the Circle had uploaded her DNA to Gedmatch. I had seen her match before, but didn’t know exactly how we connected on my mother’s line.
  • Because Debbie uploaded her DNA to Gedmatch, I was able to tell exactly where she matches different Lentz descendants.


Leeds Color Analysis at Gedmatch

I have created Leeds Color Analyses at AncestryDNA, FTDNA and MyHeritage. I thought that I would try a Color Analysis at Gedmatch. Gedmatch has DNA results from 23andMe, AncestryDNA, FTDNA and MyHeritage, so it will be interesting to compare the results.

Adding Color to Gedmatch

I’ll start by going down my One to Many Match List at Gedmatch:


The people above the green box are too closely related to work for the Leeds Method. The people in the green box share great grandparents with me on my Hartley side.

Leeds Method for the Hartley’s

I’ll put my Gedmatch number in the first spot and my father’s cousin Joyce’s Gedmatch number in the second section:

Choosing ‘Display Results’ gives me this:

There are perhaps 100 or so of these results. The way these people match me are on the first ‘Shared’ column. The way they match Joyce is found in the second column marked ‘Shared’. I would like to go down to about 15 cM with my matches. The problem with this list is that there are no names. I do, however, have Gedmatch numbers and emails. I copied my shared matches with Joyce that matched me down to 15 cM. That was 151 matches.

Working with MS Access

It seems that I need to work with MS Access to make this easier. Unfortunately, I’m a little rusty at Access. First I set up a new database in Access. Then I imported my 151 matches with Joyce into Access. Then I copied my ‘One to Many’ match list at Gedmatch into Excel and took out the columns I didn’t need. Then I imported that spreadsheet into Access also. It sounds like a lot of work, but it saves time in the long run.

My pared-down Gedmatch Spreadsheet looks like this:

It’s too difficult to get rid of the buttons, check boxes, and arrows, so I just leave them there.

Here is what my two tables look like in Access:

I just need to connect these two tables by the Gedmatch ID#. That will create a new table with the Gedmatch ID# and name.

Here is the design of my query:

The ID is the Gedmatch # from the People Who Match Both Kits (me and Joyce). One thing that was important was that I added a ‘Y’ in the Hartley column. That was in lieu of a color.

When I view the results, I get this:

I now have Gedmatch ID, name, match amount to me and that they are in the Hartley group. Access tells me I have 151 people in this Query. This saves looking up 151 Gedmatch ID#s and copying and pasting the names into a table.

Carolyn and the Nicholson Clan

The next non-Hartley on my ‘One to Many’ list is Carolyn. I followed the same procedure for Nicholson, but this time I added in whether the match had a tree at Gedmatch:

Anita and Rathfelder Matches

I did the same for Anita. I chose down to 10 cM on the people that matched both Anita and myself but got this as a result in my Access Query:

The query showed only the results above 15 cM. This is because my One to Many List at Gedmatch only includes 2,000 matches.  Currently, my smallest match on the One to Many list is 13.4 cM. There are a few ways around this. One is to use the Tier 1 list of matches. Another would be to use a list of my maternal matches. However, I will just keep this small list for now. So far, the only problem I see using this method is that I don’t include the original person that I was comparing everyone to. So I need to go back into my list and add in Anita, Carolyn and Joyce.

Emily – Frazer and McMaster

Emily and I share Frazer and McMaster Ancestry. I am able to find 443 matches shared between Emily and myself. These matches correspond with my FTDNA AutoCluster Analysis:

The Frazer cluster above is the first orange one. It corresponds to many matches on Chromosome 20. When I add all these matches, this is what I get:

  • One surprise is that Judy who is the lead person for Lentz/Nicholson also shows up in the large Frazer/McMaster group. When I run my paternally phased kit, I don’t see Judy on my match list, so there must be some glitch there.
  • I am somewhat skeptical of all the green matches.
  • The column with the GED/Wiki information should come in handy.

Summary and Conclusions

  • I was able to satisfy my curiosity as to what a Leeds Color Analysis would look like for my Gedmatch matches.
  • I have made sure that some of my most important matches are posted at Gedmatch.
  • This is a good baseline analysis. It may be possible to improve on this analysis by use of paternally and maternally phased results.
  • After seeing the results, it turns out that my Rathfelder cousin Catherine had a slightly higher match with me than Anita, so I could have used Catherine’s results to come up with the Color Analysis.
  • Using MS Access sped up the process in creating this Gedmatch Color Analysis.
  • It would probably help to have an extra column to indicate which matches have a common ancestor with me. Or these people could be highlighted in some way.

I took my advice from the last bullet:


One other anomaly was the that the highlighted Lentz/Nicholson common ancestor for Joshua came out as a blue Hartley shared match. Perhaps there was some glitch with Gedmatch. Below a match level of 30 cM, it is difficult to find common ancestors with a few exceptions.


Leeds Color Analysis on My MyHeritage Matches

I have had good luck with MyHeritage matches. I have matches there that I don’t have at other places.

Adding Color to My MyHeritage Matches

I’ll start with my father’s first cousin Joyce. She will represent my Harltey side. Actually, her brother Jim will also represent the Hartley side. I went down a ways on people who matched Joyce and me like this:

Technically, I think that I’m supposed to look at each of these matches and see who their top match is. Next, I went through some shared matches between Joyce’s brother Jim and me. This added a few people and got me up to 50 Hartley shared matches.

Two Sisters on my Rathfelder Side

I have the same situation on my Rathfelder side. I’ll start with Anita and then add in some of Inese’s matches that Anita didn’t have with me:

If I want, I can sort these by the DNA match amount to get them back into order.

Ronald on the Clarke and McMaster Side

Ronald is the next match out. He is at the level of third cousin on the Clarke side and fourth cousin on the McMaster side, so he is doubly related. A lot of DNA analysis has to do with putting matches into groups.

I’m surprised by all the matches. I have only looked at three groups and I already have 121 matches. I did include Ronald’s two children, which I didn’t really need. I kind of like doing the color analysis this way, as I am starting out with people I already know about.

Molly – I Know, But I Don’t Know

I know that Molly matches on my mother’s maternal side. However, I do not have a tree for Molly, so I don’t know exactly where she fits in. Molly triangulates with Danielle at MyHeritage. Danielle also has a tree which I will look at. In fact, I’d like to try to build out Danielle’s tree. I built her tree out, but didn’t find the connection. One of the problems is that her match level is lower than that of Molly’s. This just confirms that I need to keep this match at a generic Lentz grandparent level for me. I feel like this match cluster is very mysterious. The match with Beth indicates a Lentz/Nicholson connection, but I didn’t see this connection with the other matches.

Sandra – From the Netherlands

I need to get to Sandra from the Netherlands, because I have a cousin that I tested after her. Her relative (Great Aunt?) married someone after WWII and moved to the US, if I remember correctly. I think that these last two groups are Lentz:

Cousin Paul on the Frazer Line

Emily matched Paul but was already taken by Ron above. That is OK because the Ron lighter green group is Clarke/McMaster. The darker green group is Frazer/McMaster. Both Paul and Emily descend from Frazer and McMaster. Emily has to match Ron on the McMaster side, because Emily is not related to the Clarke family.

Kathleen and a Hartley England Cluster

Part of the reason I look at DNA is to break down a brick wall on my English Hartley side. Kathleen appears to match the English ancestors of my Hartley’s, though perhaps not the Hartley’s themselves.

Here is a respectable 192 matches in colored clusters:

  • The Lentz group tends to be mysterious. I don’t know a lot about that group.
  • The first Hartley group and the last Hartley group don’t match each other. That is probably because the first group has Colonial Massachusetts roots and the last one represents Hartley ancestors in England. My Hartley line came to the United States after the US Civil War.
  • One good thing about this method is that it starts with a match that is somewhat known or well-known and then drills down to the matches of that match.

I can sort the matches by the highest matches to lowest matches to get a more traditional looking Leeds Color Chart:

There are more Rathfelder matches in orange at the bottom because I brought those matches out a little further than the other groups.

Summary and Conclusions

  • Performing a Leeds Color Analysis on my MyHeritage matches showed some interesting results. It appears that the matches were more evenly spread out among my four grandparent groups. I don’t know if this is because MyHeritage matches are more representative of my four grandparents or because of the way I performed the Leeds Method.
  • This Leeds Color Analysis was inspired by the AutoCluster Method that recently came out. The AutoCluster method does not cover MyHeritage at this time, so it is worthwhile to perform a Leeds Color analysis at MyHeritage.
  • The analysis brings up questions and avenues of research to further pursue. The method shows what I don’t know, but it also seems to bunch ancestors together. For example, it seems to separate out my paternal grandfather’s colonial ancestors from his Lancashire, England ancestors. Likewise, it appears to separate out two Lentz Lines, but the distinction there is less clear right now. The distinction may between the Lentz/Nicholson line (the Nicholson’s came to the US from Sheffield, ENG in the late 1800’s) and the older US Colonial Lentz and collateral lines.
  • Next – A Leeds Color Analysis at Gedmatch


Making Sense of My FTDNA AutoClustering with a Leeds Color Analysis

AutoClustering is a new approach to looking at DNA matches. The progamming was created by Evert-Jan Blom. Right now the analysis is working better for FTDNA than it is for AncestryDNA. In a previous Blog, I looked at my 23andMe and FTDNA clusters, but had some trouble identifying many of the clusters. I was hoping that a Leeds Color Analysis would shed some light on my Clusters.

FTDNA AutoClusters

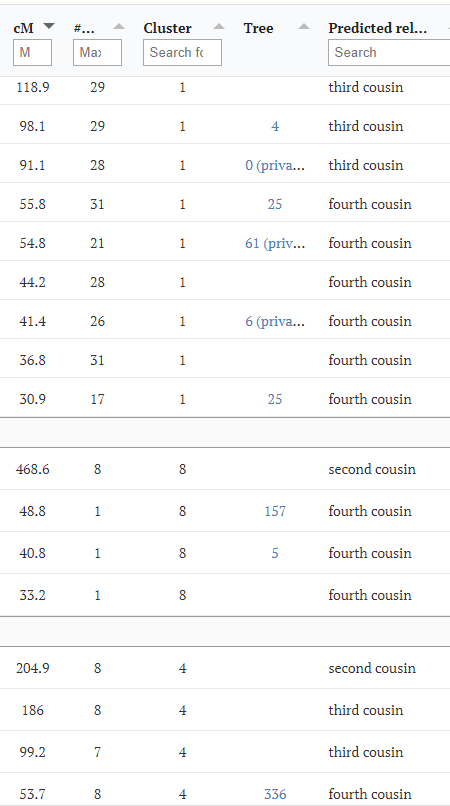
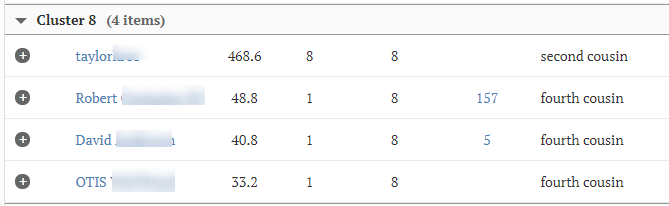
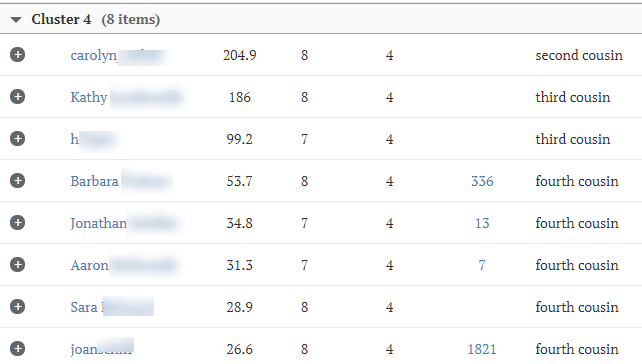
These are the 33 Clusters I came up with at FTDNA. I decided that FTDNA pads their DNA a bit. This padding problem blew up my orange Cluster 1 where there are a ton of matches on my Chromosome 20. These are on my Frazer grandmother’s side.

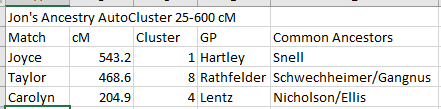
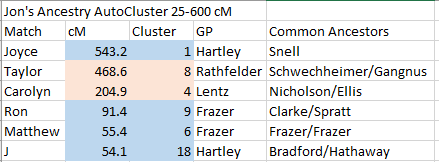
Here is a summary of some of my AutoClustering that I did previously:

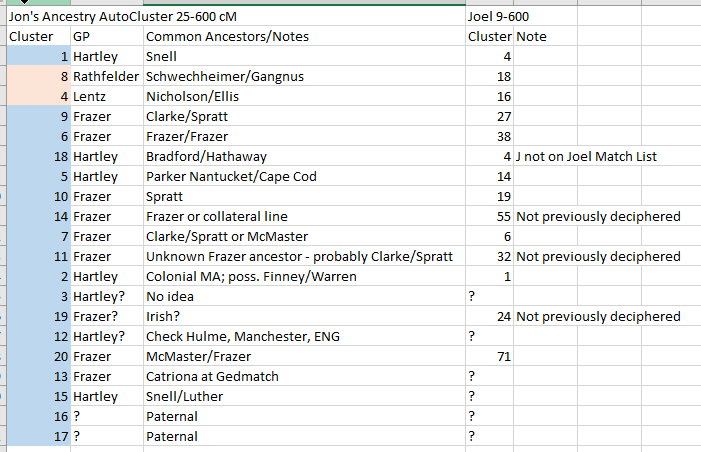
The FTDNA results are in the middle column. It looks like I figured out 6 of the 33 Clusters.

Can the Leeds Color Analysis Help Figure Out More Clusters?

The Leeds Color Analysis also creates clusters, though not as graphically as the AutoCluster method. The good thing about the Leeds method is that it doesn’t rely on a  computer program and it requires some interpretation from the user. These could also be considered negatives.

Here is what I came up with using a Leeds Color Analysis of my FTDNA matches:

  • The first time a name came up as a match I gave them the color over their name.
  • If someone matched someone who matched someone up higher in the Cluster, I noted this on the spreadsheet.
  • I went out as far as FTDNA’s predicted 2nd to 4th cousin matches. This was 88 matches.
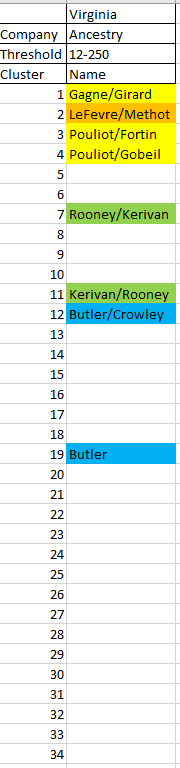
  • This represents 21 Clusters. Some are not technically clusters as there is only one person in the cluster. I assume that if I went to lower cM matches, I would get more matches in these one person ‘clusters’.
  • I identified three out of four of my grandparents

Starting with Hartley

In the Leeds Analysis, I used my father’s cousin as the lead Hartley person. He did not show up in the AutoClustering as he was too close a DNA match compared to the thresholds I used. However, the second person in the Blue column is Benjamin. He matches my father’s cousin Jim and becomes the lead person in the AutoClustering. A search for Benjamin in the AutoCluster shows that he is in Cluster #10.

Cluster 10

The problem is that Cluster 10 only has three people in it:

In the Leeds Color Analysis, there were 20 in the Blue column. When I go to my match with Benjamin at FTDNA and choose ICW, I get three people. So that makes sense. This is just one flavor of Hartley. A look at the ancestral names of these matches makes me think that this could be a Colonial SE Massachusetts branch. I’ll call this a Snell/Bradford Line as that covers all my Colonial ancestors:

I could be wrong, but that is my best guess right now. Next, I filtered for Hartley (blue on the Color Analysis) and added a column for the AutoCluster number to keep track of the Cluster number:

The other two people in AutoCluster #10 were not in the Leeds Color Analysis.

Going Down the Blue List

It would seem logical to go down the Blue list and put an AutoCluster numbers in for each person. I find the results interesting:

I would trust the Clusters except for #6 as that shows more than one color. I was a bit surprised that they didn’t all relate to AutoCluster numbers. I’m not sure why that is. Part of the reason is that I went by FTDNA predicted relationship and AutoCluster probably goes by total DNA match in cM.

I plugged these number back into my AutoCluster Summary:

Notice that I had one Hartley in Cluster 4 which I previously had as Frazer. Turns out that was a mistake and she should have been in Cluster 2. It all works out. It turns out I made another mistake and there is no obvious Hartley Cluster 8.

Corrected FTDNA Cluster Summary

I suppose it would be possible to further break down the Hartley into Colonial or non-colonial, but I’ll hold off on that for now. The Hartley List worked well, so I’ll move on to Frazer.

Plugging Leeds Frazer Colors Into AutoCluster

Here is what I get:

Again, I’m unsure why the people at the bottom of the list are not in clusters. The Clusters I found were not shared with other colors, so that was good. Now I feel like I am getting somewhere:


These are different flavors of Frazer in green. I also have Clarke who was my Frazer grandmother’s mother from my last look at AutoCluster. Frazer’s married Frazer’s. Frazer’s married McMaster’s who married McMaster’s. It gets complicated.

I now have 13 out of 33 Clusters identified. That is a good start. I have other ideas on how to identify other clusters, but that can wait for now.

Summary and Conclusions

  • I got stuck trying to identify many of my AutoCluster results from FTDNA.
  • Using the Leeds Color Analysis, I was able to put many matches into two major grandparent categories. I was able to cross-reference these matches to the AutoCluster.
  • My next idea is to use chromosomal analysis to identify the clusters. By this, I mean that I will compare the matches to my visual phasing results. This should get the clusters into the correct grandparent area.


Mom’s DNA AutoClustered

AutoClustering was down for AncestryDNA today, but now it appears to be working again. This time I wanted to try to autocluster my mom’s DNA. I meant to lower the threshold from 50 to 15, but apparently did not. I’ll take a look at what I got.

Mom only got three clusters. This could be a lesson in what not to do. The first cluster is Nicholson.

Cluster 3 – Rathfelder

I have blogged about this match. The common ancestor is at the level of Hans Jerg Rathfelder and Juliana Biedenbinder:

Green Cluster #2

I am less certain of Cluster 2. These two people don’t have trees and I have not been able to get in touch with them. I was in touch with a shared match who had Schwechheimer ancestry. This ancestry is also from Latvia, so that would be my best guess for this Cluster.

That’s as far as I get with this small autocluster. The orange is a maternal cluster. Clusters 2 and 3 are paternal for my mom as far as I can tell.

Here is my AutoCluster at Ancestry using the same default settings:


I had one maternal cluster (Nicholson) and four paternal clusters. My mom’s cluster of 7 Nicholson’s translated to a cluster of three for me at the preset thresholds. This makes sense as I got about half of my mother’s Nicholsn DNA.

AutoClustering My 23andMe Matches and More FTDNA

In my previous Blog, I looked at AutoClustering my AncestryDNA and FTDNA matches. In this Blog, I’ll look at 23andMe. I have to confess, that I have never had a good feel at working the DNA matches at 23andMe. I was hoping that AutoCluster would give me a boost in figuring out what I have there.

Here is my AutoCluster at 23andMe:

Now I am up to 45 Clusters. I used a slightly lower threshold than I used at FTDNA, and got different results (20 cM at 23andMe vs. 25 cM at FTDNA). At FTDNA, the first two clusters had 108 members and Cluster 2 had 10 members. At 23andMe, the first two Clusters are a bit more even at 66 and 65 members. Also I note that the green Cluster 2 is quite closely related. All 65 members match each other.

Identifying the 23andME Clusters

My first thought is to figure out what these clusters represent. Which line is which? I do have a few known cousins at 23andMe.

Cluster 8: The Lentz/Nicholson Line

My mom has a cousin Judith who is on the Lentz Line. She is on Cluster  8.

Judith also descends from the Nicholson family as does at least one other person in Cluster 8.

My Cousin Jennifer: Hartley Side

Another point of reference is Jennifer who is my 2nd cousin, once removed.


This corresponds with my Hartley’s at AncestryDNA:

Steve with Clarke Ancestry


I’ve blogged about Steve who is a 23andMe match. He has Clarke ancestry and is in Cluster 19:

Cluster 19 is quite a ways down on the list.

Cluster 2 and Chromosome 20

I have written a few Blogs on my Chromosome 20. I have many matches there on my Frazer grandmother’s Irish side. These Chromosome 20 matches appear to correspond with my Cluster 2. Here is one Blog I wrote on my Chromoosme 20 about 2-1/2 years ago. In that Blog, I reasoned that the matches may be on my McMaster side:

In my previous request for an AutoCluster at FTDNA, I had set the lower threshold at 25 cM and that had filtered out a lot of the Frazer side matches. At 23andMe, I lowered the threshold to 20 cM which would explain the larger cluster.

Deciphering FTDNA Cluster 1

If FTDNA is like Ancestry and 23andMe, then the yellow Cluster should be a Hartley Cluster. First I checked the top match. It turns out that FTDNA over-reports these matches:

Roger shows a match of 67.3 cM with me, but his top segment is 12.3. Here is what the FTDNA Browser shows:

The browser shows one small match at Chromosome 20. This is where I have a lot of Frazer matches as described above. Theresa is also in FTDNA Cluster 1:

Thesesa also has a relatively small match corresponding with her 13.1 cM largest segment on Chromosome 20. That means that even though I tried to avoid my Chromosome 20 overmatching problem by raising the cM threshold to 25 cM, FTDNA managed to add in tiny cM’s and up the totals for these matches.

It is unfortunate that FTDNA has small matches that come out as large. I don’t know if this is as big a problem for others as it is for me. Basically I have a large group of distant relatives that I can’t connect with in Cluster 1.

A Comparative View: Three Companies

Here is a comparison of the three AutoCluster runs I have done with three companies. A better comparison would be for me to rerun the Ancestry results with a lower threshold:

  • I changed the Ancestry Cluster 1 name from Hartley to Snell. That is because the cluster goes back to Snell and beyond my Hartley ancestors for some of the matches.
  • In the three analyses Clarke went from Cluster 2 to 6 to 19.
  • I noted a special Chromosome 20 issue that I had. This didn’t come up at Ancestry as the threshold was set low. I may be able to identify this group later at Ancestry when I am able to run an AutoCluster at a lower cM threshold.
  • The Ancestry AutoCluster analysis only went up to 5 Clusters based on the strandard set AutoCluster thresholds.

FTDNA Cluster 2

The above summary points out that I have not yet figured out FTDNA Cluster 2. So far, I don’t have a definitive answer for this Cluster. The people tend to match me on my Chromosome 10. I have tended to associate their ancestors with Colonial Massachusetts.

FTDNA Cluster 3

This Cluster appears to match on Chromosome 22. I think that they are Irish in background. My Chromosome 22 (Joel) is all Irish Frazer on the paternal side:

At least one of my matches from Cluster 3 is also listed at Gedmatch. I have a paternally phased kit which she matches. That is how I can tell that the match must be on my Irish Frazer side.

Back to 23andMe: Cluster 4

Cluster 4 has 17 people in it (or items according to AutoCluster).


Two of these “items” are listed as unknown. Next I need to identify one or more of these people in the list. John listed 8 surnames, but none of them sounded familiar. So far, these matches are matching me on Chromosome 3. Here is the match with Kris at the top of the Cluster 4 list:

From visual phasing, I know that has to be either Hartley or Rathfelder DNA (at the level of my grandparents).

I recognize some Hartley names in that area of the match and they aren’t in Cluster 4. That means that this has to be a Rathfelder side match.

I’m not getting very specific with these Clusters. Part of the reason is that 23andMe does not emphasize ancestral trees. So if I ever meet these cousins, I can introduce them as my Rathfelder Line Chromosome 3 cousins. From one of my other maternal Chromosome 3 matches, I see that I have traced one of these families to a German Colony in Saratov, Russia. I have not yet made the connection between them and to my ancestors who lived in a German Colony in Latvia.

So, Where Are We?

Here is a summary of some of the clusters:

I had the best luck with AncestryDNA. This is partly because I having been working with them more. Also partly because I used lower thresholds, I had the more obvious clusters and only five clusters. Ancestry also has the most matches and best genealogical trees.

FTDNA came in next as they do have some genealogical trees. This is where I tested first, so I have some familiarity with how they work. Their matching algorithm causes a perfect storm for my Irish Chromosome 20 matches showing that they match much more closely than they should. I expect that this is true to a lesser degree with some of my other matches.

23andMe was the most difficult as they focus the least on genealogical trees. It would take a bit of time to contact some of the critical matches there. I believe that 23andMe have more test results than FTDNA, so they have that going for them.

Summary and Conclusions

  • So far, it has been easiest to interpret the AncestryDNA clusters. I would like to take the cM levels down once some of the bugs have been worked out.
  • I got many more clusters at FTDNA and 23andMe, but some of the clusters descriptions are more vague than I would like.
  • I would like to look more into the Hartley/Snell clusters. I am interested in Hartley’s that don’t match Snell’s as my genealogical brick wall goes back on my Hartley line – pre-Snell.
  • It would seem that I should be able to cross-reference the clusters. Even though the matches are different at the different companies, the common ancestors are the same.
  • This utility is new, so people are still experimenting with it. For example, is there a cluster sweet spot that isn’t too high or too low. Obviously, I have 32 third great-grandparents representing fourth cousins. This may be a good number of clusters to shoot for. There may be those in the 3rd great-grandparent level that may be too obscure to have clusters. However, this could be off-set by 4th great-grandparents with a lot of descendants that would make good clusters.
  • A lot of the clusters have two people in them. Is it worthwhile looking at such small clusters?
  • The AutoCluster utility has given me a fresh look at my DNA matches. I have also been entering some of the larger matches into my match spreasheet.


The AutoCluster Craze

It seems all the cool genetic genealogists are using AutoCluster at geneticaffairs.com. Here is the welcome page for this new DNA analytical tool:

I have decided to try it. I have seen some screen shots. Autocluster appears to be a way of easily clustering your DNA matches to see which ones go with which.

I registered and first tried Ancestry where most of my matches are. I added Ancestry and it showed all the people that I am linked to through Ancestry. There is a blue  autocluster button to select:

The second button is for my profile and I chose that. Then there are three choices:

I chose A. I see now that if I was in doubt, I should have chosen A so that was good. In not too long a time, I got an email giving my 20 closest DNA matches. I knew this already. I also got a spreadsheet and the important graph:


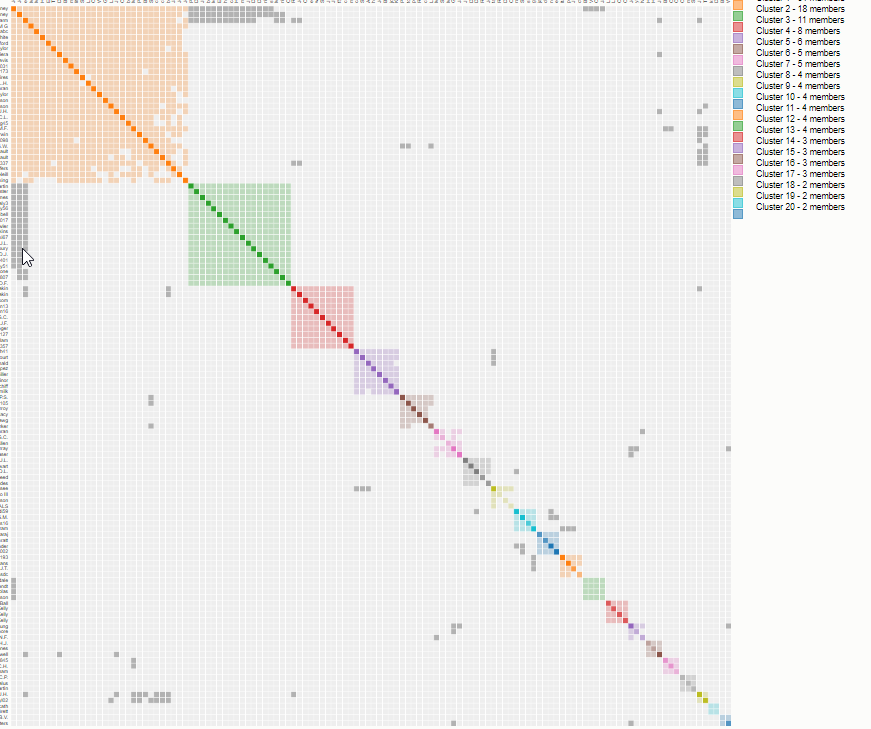
On the top and sides of the graph are names of my matches and how they match each other. The Key above shows 28 matches. This is based on the default values:

This forces my matches into a fairly narrow range.

What Do the Clusters Mean?

The clusters are on the idea of “birds of a feather flock together”. These are matches who match each other. The first orange cluster would be people who descend from my Hartley great-grandparents. This couple had 13 children. That means that I have a lot of 2nd cousins and some remaining 1st cousins once removed, then 2nd cousins once removed.

The Snell Side

As I look at the Hartley cluster more closely, I see that there is also a Snell subcluster within it that is not Hartley:

That is an important distinction as I try to separate  Hartley and Snell DNA.

A Small Maternal Red Cluster: Lentz

Hartley is on my paternal side. The only cluster on my maternal side is the red one. Here is my tree up to my 2nd great-grandparents;

The orange box is around my Hartley/Snell ancestors. The red box is around my Nicholson ancestors. This corresponds to the red cluster in the chart.

The Purple Frazer Cluster

Gladys is the third person in the purple cluster. She is in my Frazer DNA project. Here is how we match:

What is also interesting is that Gladys does not match the first person in the purple cluster. However, Gladys matches possible Frazer relative #2 who matches possible Frazer relative #1. Now what is very interesting is that I had that the match [that I am calling Frazer relative #1] has a McMaster ancestor. I have tried to show in the past, that “Frazer relative #1” has this ancestry through Marriainne below:

Although the “Cluster” is not proof that I was right, it seems that it provides strong evidence that I was right. It appears that Match #1 has Frazer DNA even though she doesn’t know she has Frazer ancestry. Even though I did a simple cluster, it appears that the results are quite powerful.

The Green Clarke Cluster

I have written quite a bit on this line. The people I match with are aware of their McMaster ancestry. I match these people on their McMaster Line but more closely on their Clarke line.

Actually, the last person in the cluster isn’t sure how his Aunt fits into the picture. However, I have not seen the family tree.

The Last Cluster

This last cluster is a little harder to nail down with only two people. Note that there is a link to the Clarke Cluster above. I had originally thought that this might be a McMaster Cluster, but the last person in the cluster has Spratt ancestry. The reason that I thought that this might be a McMaster Cluster is because the person matching from the Clarke Cluster had McMaster and Clarke ancestry.

I’ll keep an open mind and put both names into the mix.

Cluster Summary

I am very happy with this new tool as are other genetic genealogists.

These are the lines above that I have identifed using a simple threshold cluster technique. I have Hartley/Snell, then the earlier Snell. I have Frazer and Clarke. Then I have either Spratt or McMaster for the very small cluster. For my maternal side, so far, I only have Nicholson.

Trying FTDNA

Next, I added the FTDNA website to the AutoCluster Program. This time I lowered the lower threshold to 25 cM. Perhaps this will take longer to run. This will be a good chance to look at my FTDNA matches as I haven’t checked them out in a while.

This time, instead of 5 clusters, I have 33. My first Cluster has 108 members instead of 16. I assume that Cluster 1 at Ancestry is the same as Cluster 1 at FTDNA, but there are not a lot of people that have tested at both places. I would need to lower the threshold at Ancestry and then see if I saw any common names.

Frazer Cluster

The Frazer Cluster below in purple is Cluster 4:

I recognize my 2nd cousin once removed who is the first match. These Frazers tended to intermarry. This clusters carries an overlapping look that I also saw at Ancestry – even though there are different Frazer ancestors in the Ancestry Cluster versus the FTDNA Cluster.

Rathfelder Cluster

Beneath the Chart is an analysis part:

The first cluster to come up there is Cluster 9. That is likely due to the large match with my 2nd cousin Catherine. She is on the Rathfelder side which was missing in the high threshold Ancestry Cluster Analysis.

Cluster 9 is the Blue Cluster on the lower right above. It would be worthwhile pursuing the other two in the cluster. According to the tabular analysis above, Pamely has a tree. The link brings me right to Pamela’s tree. It goes back to her grandparents. So if I were to expand Pamela’s tree, I might see where the match is. The Rathfelder’s were from Latvia, so that is an easy place to notice.

Cluster 6 – Clarke

I could recognize this Cluster by one person who had Clarke as his middle name.

FTDNA Clusters

With 33 Clusters, it would take to long to look at all of them in this Blog. However, I am curious as to the 33 Clusters that came up.

Summary and Next Steps

  • The AutoCluster Tool is very helpful with AncestryDNA. This is because AncestryDNA doesn’t have the Chromosome Browser to check matches.
  • I would like to figure out why I have one large cluster at FTDNA versus all the small clusters
  • I would like to try this at 23andMe to see how it works there.
  • If nothing else, this tool should help focus my DNA research.
  • I would like to be able to cross-reference the clusters. For example, between AncestryDNA and FTDNA.
  • I would also like it if there would be a way to combine the clusters from the three companies.
  • Further, it would be great to add MyHeritage to the mix.


A Possible Hartley Match at MyHeritage and Visual Phasing

I recently had a message from Julie at MyHeritage. She matched my brother Jim’s DNA. We also both had Hartley’s in our ancestry. She wanted to know if any of her Hartley’s sounded familiar to me. According to Julie, “…2 Hartley sisters married 2 soldiers in the House of His Excellency British Ambassador at the Court of France, ” This didn’t sound familiar to me. I don’t know of any of my Hartley ancestors marrying in France.

Julie’s DNA Hartley Match

Here is Julie’s DNA match with my brother Jim:

Julie also matches my sister Lori here:

This was Julie and Lori’s only DNA match and corresponded with Julie and Jim’s largest match on Chromosome 7. However, none of these DNA matches were very large.

Visual Phasing of Hartley DNA

I have visually phased all my sibling’s DNA as well as mine. Here is Chromosome 7:

Here in the beginning of Chromosome 7, Jim and Lori both start off with Frazer DNA shown in blue. Those areas correspond with the matches with Julie at the start of Chromosome 7. That means that the match on Chromosome 7 cannot be a match with Hartley DNA. This is a case where the visual phasing came in handy. If Jim and Lori matched Julie on Hartley DNA, it would be worthwhile looking further to see if there was a common ancestor.

Frazer DNA?

As I mentioned above, these DNA matches are quite small. That indicates that these matches could go back quite a way. My known Frazer ancestors were from Ireland. I notice that Julie has ancestors from Ireland. I suspect that that is where the common ancestors could be.

Here is my grandmother’s Frazer tree:

I have some missing ancestors in the bottom right part of the tree. It is possible that is where the match is.