Using M MacNeills Raw DNA Phasing Spreadsheet and My Problem Chromosome 10

I have written many blogs about phasing my own raw DNA. One of the things that was bothering me while going through the process was the presentation of the results. It is possible to phase millions of bases using the raw DNA results from one parent and at least 3 siblings. But once the DNA is phased, how can those results be best portrayed? In my previous Blog on the subject, I was able to figure out a fairly simple way to show my results, but the outcome was not totally satisfactory.

chr7patmatmap

I liked how I was able to get the grandparents’ surnames at least in the first 2 bars. I also liked how I had a simple scale at the bottom. However, one of my bars went too far. Also, my simple chart started at zero and Chromosomes start at different positions. I was able to fix the bar going too far today. Excel makes these bars based on distance rather than positions, so one of my equations was wrong.

I told M MacNeill <prairielad_genealogy@hotmail.com> of my concerns and he sent me his spreadsheet. One feature I really liked about the MacNeill Spreadsheet is that it had a place for cousin matches at the bottom. Below is the first Chromosome where I used my phased raw data from my mom and 3 other siblings to create a MacNeill Chart.

chromosome15macneill

Sharon’s maternal first little segment didn’t work out perfectly, but that didn’t bother me. I know that the beginning and ends of Chromosomes can have small problematic segments. Note at the bottom that my match to Carolyn in yellow shows where my maternal crossover is in the upper part of the chart where I go from red to orange.

My Chromosome 10

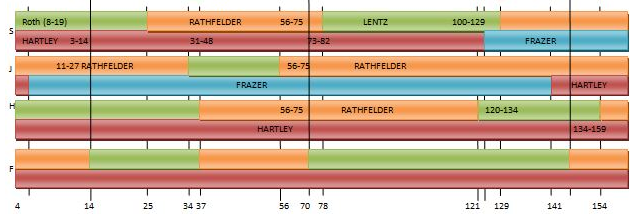
I am looking at my Chromosome 10 because, for one thing, I have had trouble trying to visually phase this Chromosome in the past. Here is my attempt at visual phasing from early in 2016:

chr10visphase

Here is another try including additional cousins that tested:

10r1visphase

Note how different the maternal (lower) side is. I switched most of the maternal grandparents around.

Here is the MacNeill spreadsheet showing just the cousin matching part:

cousinmatch10macneill

I have some good matches here. Blue is Hartley, green is Frazer, yellow is Lentz. Red is Rathfelder. This makes it clear that my chromosome is mapped wrong. I need more Hartley and Lentz. The above chart includes my brother who I had tested not too long ago.

Here is another try with my brother’s DNA results included:

10visphase3

My sister Sharon (S) has a better look now on her maternal side. I got rid of the small purple segment.

Looking At the Raw DNA Phasing – Paternal Side

I have two spreadsheet summarizing the results of the many hours of work it took to phase my family’s DNA  from the raw data. One spreadsheet is for the paternal side phased DNA and the other is maternal. I have patterns for both sides. They are based on the order of my siblings: me (Joel), Sharon, Heidi and Jonathan. So an ABBB pattern would mean that Sharon, Heidi, and Jonathan all get their DNA from one grandparent, and I get mine from the other. Here is the paternal spreadsheet:

dadpatternchr10

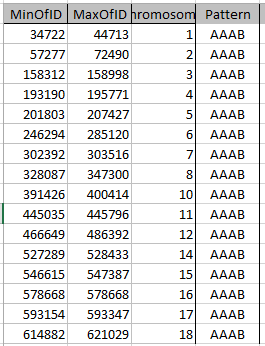
These patterns go logically one to the other. The first pattern goes from AABA to AAAA at position 2,605,158. The B changed to an A in Heidi position, so the crossover goes to her at that position. I have a column called GaptoNext. This is based on the number of tested SNPs between patterns. When this number is large, I suspect an AAAA pattern. That was the case above highlighted in yellow. Except there is a problem. To go from ABAB to AAAA means 2 changes, and there should only be one change (or crossover) at a time. This caused me to look at the bases.

A Paternal pattern missed

Here is what I found.

chr10patternmissed

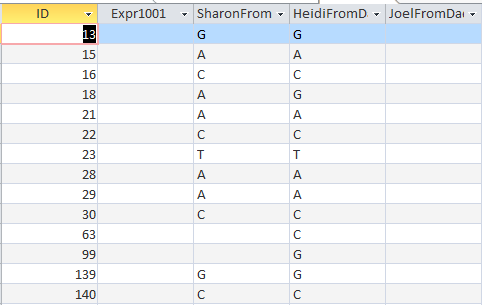
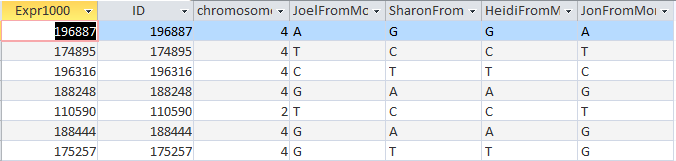
I had missed an AABA pattern at Build 36 Position 30,683,878. I took another look by setting my MS Access query so that Sharon and Heidi would have a different base from Dad:

chr10rawpatterns

This shows that the there is a change from ABAB to AABA even sooner than I thought between ID 400008 and 400045. This is an ID I created that sequentially numbers the tested SNPs. You can see another way I missed this pattern, because I didn’t fill in the missing bases. TTC? should be TTCT. CCT? should be CCTC.

What does the missing pattern represent?

The pattern of ABAB TO AABA is actually my crossover (Joel). It is a bit more difficult to see than the others. That is because the ABAB pattern is the same as BABA. The change of BABA to AABA is my change of the first B to the first A. Naturally, I put myself in the first position. In rough terms, that gives me a paternal crossover at about position 30.5M. This is a good location as it does not interfere with a large match that I have with an unknown paternal DNA relative named Shamus:

shamus

Here is my corrected Dad Pattern for Chromosome 10:

dadpatternchr10corrected

I have gone from 6 to 8 crossovers as the previous correction lead to another one. I also took out one of Heidi’s crossovers that I had wrongly identified. So fixing one problem fixed a lot of others. It helps to describe the start and stop of each pattern and to describe each crossover. The important results are the person and the last Position column. These show who the crossover belongs to and where that crossover occurs on the chromosome. I then entered the paternal crossover results into the MacNeill Spreadsheet and got this:

patchr10chart

I took out the large space between the siblings. The problem is that the space is now the same as between the maternal and paternal phased part for each sibling. Excel has no happy medium that I’ve found.

The blue is Hartley and green is Frazer. The raw phasing in the upper part of the chart matches with the cousin matches below. It is interesting that some of the cousin matches define the crossovers. For example, the Jim to Sharon match gives Sharon’s crossover. Also the Paul to Sharon match gives Sharon’s other crossover. The Paul to Jonathan match gives Jon’s first crossover.

The Maternal Side

Hopefully resolving the maternal phasing will be easier than the paternal side. My visual phasing only showed four crossovers. Here is my unfinished spreadsheet showing 5 crossovers (under the Person column):

maternalchr10

Here, it looks like I already added an AAAA pattern to the end. That was because the AABA pattern ended at about 114M and the Chromosome itself ends at about 135M. My GapstoNext column showed that gap as almost 20,000 SNPs. My question now is: should I add an AAAA pattern to the beginning also? Perhaps. An AAAA pattern means that 4 siblings match and all got their DNA in that area from their maternal (in this case) grandmother. Those results were consistent with how I had the visual phasing done. In fact, the visual phasing indicated that the 4 siblings should all get their maternal DNA from the Lentz side up until about 60M. Let’s take a closer look. This gets at my first note above in the spreadsheet image. There were only 3 single SNPs showing the AAAB pattern and they were spaced a long way apart – over 10 Megabases each. In this case, I will disregard those 3 widely spaced patterns as some type of mistake and stay with the AAAA pattern. Once I made the change from the AAAA pattern to the AAAB pattern, that brings us up to about 60M for my (Joel’s) first crossover. That seems to fit well. That leaves us with 4 crossovers – one per sibling as opposed to the two per sibling on the paternal side.

First I’ll compact the Gedmatch browser results, then show the raw DNA Phasing results on the MacNeill Chart:

gedmatchcheckofrawphase

chr10phasemap

When I compare the results, I see a problem I had with the visual phasing. The next to the last crossover looked to belong to Sharon, but instead it belonged to Heidi. Also Jon’s second paternal crossover should have been marked as an “F” above. That was just a typo. The third J for Joel crossover that I had above was not a crossover. In the middle, the 2 close crossovers of J and S should be instead S and J if I’m reading the MacNeill Chart correctly. It looks like all the FIRs and HIRs, etc. match. Once I did the raw DNA phasing, it is obvious how the gedmatch browser results had to match the raw DNA phasing results. Before, I did the raw DNA phasing it was not so obvious.

I’m happy with the results. I get to pick whatever colors I want for the four grandparents. It still would be nice to have some sort of labels or color key. After a hard day of phasing DNA, it is rewarding to see the results displayed so nicely. Thank you Mr. MacNeill.

A few observations:

  • The 4 siblings did not inherit any Rathfelder DNA (brown) on the left side of Chromosome 10
  • Lentz DNA (yellow) is missing from the right side of the Chromosome for the same 4 siblings
  • As I have my mother’s DNA results, that would make up for the missing DNA from those 2 maternal grandparents
  • Short segments of Hartley DNA (blue) are missing near the beginning and near the end of the Chromosome (i.e. none of the four siblings inherited Hartley grandfather DNA in those areas).

Summary

  • M MacNeill has the best display that I am aware of for mapping phased DNA.
  • The final mapping is like the final exam where previous mistakes are brought out, but there is a chance to correct them.
  • The phasing process is difficult, but there are built in checks and balances to find and correct mistakes or missed patterns.
  • The raw DNA phasing procedure (I use the Athey method) would generally be used if a parent has been tested and the visual one is used if a parent has not been tested. However, the visual phasing as developed by Kathy Johnston is important to use as a framework for the raw DNA phasing as well as a check for the end result.
  • The raw DNA phasing results appear to be better than what I was able to get using the visual phasing. Not because the visual phasing method is bad; more because I have not mastered it.
  • If you are using someone else’s spreadsheet, it is a good idea to know how they work in case anything goes wrong.
  • After writing many blogs on visual and raw data DNA phasing, it is nice to see everything come together using the MacNeill Spreadsheets and Charts.

More Dicks DNA – Marilyn’s Brother

I just finished 2 Blogs on the Henry Dicks Line which is a parallel line to my wife’s Christopher Dicks Line. Then I heard that Marilyn had her brother tested. Marilyn is on 2 different Christopher Dicks Lines.

Henry Dicks Line Updates

In other news, I found out that Eric’s dad, Claude, has been tested for DNA. What is more it is Claude that Eric believes to be likely related on the Henry Dicks Line. The confusing part was that Eric was in a Triangulation Group with my mother in law Joan and Joan’s half Aunt Eshter. So isn’t that confusing. That means that for now (as I understand it) Eric’s TG with my wife’s side of the family may not refer back to a Dicks ancestor. I’ll take Eric off the TG Matrix for now and put his father into the Dicks family comparisons. The good news is that there are a lot of Dicks descendants around. The bad news is that is is difficult to keep track of all of them.

I also got this note recently from Crystal from the Henry Dicks Line:

In looking at Ivy’s ancestors, We also share another ancestor. We are both related to The Vatchers as well as the Matthews and the Dicks. Burgeo is so small that you bound to be related in 2 or 3 different ways going way back!

In addition, Crystal tells me she has extra Dicks DNA on her dad’s side as shown here on this Henry Dicks Chart. Her mom’s side of the Dicks line leads up to the first pink rectangle. I have Crystal in a slightly different green to make sure I don’t forget she is in two Dicks Lines.

henrychartnew

Back to the Christopher Dicks Line and Marilyn’s Brother

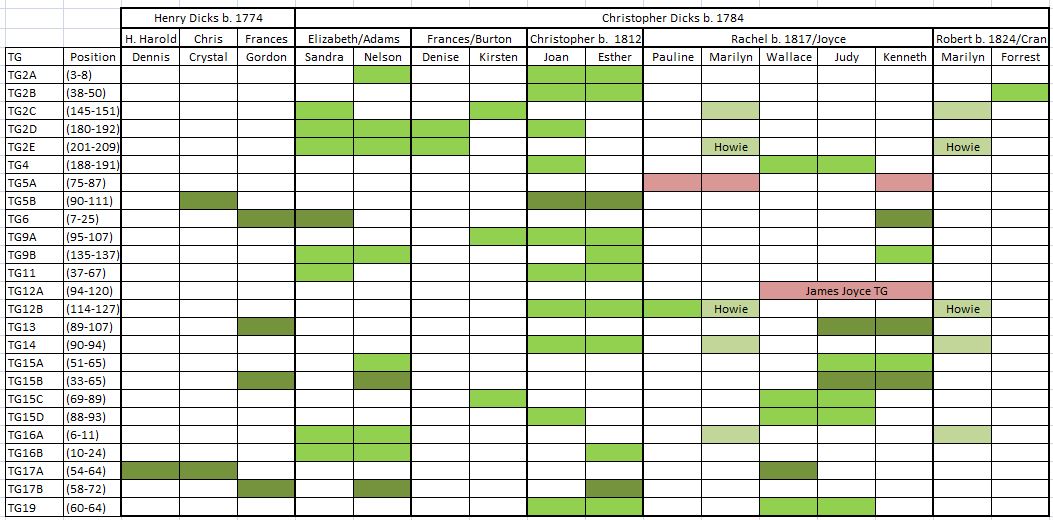
Here is an updated Christopher Line Chart. All I did was add Marilyn’s brother Howie to an old chart I had:

marilynsbrotherchart

The chart is getting tiny. So I will point out that Marilyn and her brother are on the Joyce and Cran Lines. The Joyce Line is the large Line to the right of center and the Cran Line is on the right. That reminds me of something I brought up in an email. My wife’s 1/2 great Aunt Esther has 2 Dicks Lines also. One is through Christopher. The other one she doesn’t share with Joan due to the 1/2 part. However, I noted that Esther is in 3 TGs that she does not share with Joan. In those 3, she shares all 3 of them with people from the Adams Line. The Adams line is the one on the left.

esthernonjoantgs

These are the non-Joan, Esther TGs. They all have Nelson in them and two of them have Sandra. I just need to check to see if Esther’s other Dicks ancestor might fit in. “Hi Sandra, any room for Esther’s ancestor?”

However, when I look at Esther’s tree, this is what I see:

estherstree

Assuming that this tree is right, there is no room for Jane Ann Dicks in Sandra’s tree. That is because Jane Ann was b. 1841 and Sandra descends from Elizabeth Dicks b. 1809 who married Thomas Adams. Sandra would have descended from a male Dicks. I will leave this as a mystery for now. Perhaps the 3 TGs above between Esther and Nelson are non-Dicks TGs.

Marilyn’s Brother and Claude

Now I will compare all those who have Dicks ancestors. I will look especially at Marilyn’s brother and Claude (Eric’s) dad who may have Dicks ancestors. This resulted in 754 lines of matches. However, each match is listed twice, so there are only 377 matches. A lot of these matches are between close relatives. There would be a lot more matches if I had included Eric and Larry in the mix.

Chromosome 2

Here we have a complicated stretch of DNA:

tg2dicks

This may take a bit of explaining. Previously, I had this as two TGs:

  • TG2D (180-192) with Sandra, Nelson, Denise and Joan
  • TG2E (201-209) with Sandra, Nelson and Marilyn

I see now that Denise should have been in the TG2E. Now we can add Howie to TG2E also. There is another way to look at this TG. That would be that it is a larger TG and that Joan’s DNA didn’t extend to the higher end of it and Marilyn and Howie’s DNA didn’t extend to the first part of it. A few other things:

  • Kenneth and Judy are not in this TG. As they both descend from a Miller line, that would be a likely source of their DNA match.
  • Kirsten also does not appear to be in the TG. I’m not sure how to explain the matches between Kirsten and Marilyn and Kirsten and Howie. The simplest explanation would be that Marilyn and Howie are in the TG through their father’s side and match Kirsten on their mother’s side. However, I don’t know enough about everyone’s genealogy to know if that is feasible.

Here is the larger TG drawn out:

tg2chart

This was a little tricky to draw. What this is supposed to represent is that Sandra, Nelson and Denise are in the larger TG. Joan (in yellow) is in the first part of it and Marilyn and Howie are in the second part or it. I guessed that Marilyn and Howie might be in the box on the right as none of the other four Joyce line descendants are in this TG.

crossovers

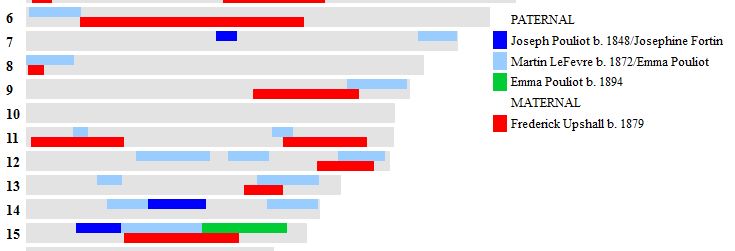
I can give a likely reason Joan dropped out of this TG and Marilyn and Howie dropped in. It has to do with crossovers. Let’s look at Joan first. Joan has 2 copies of her Chromosome 2 as we all do. One is maternal and one is paternal. Joan’s Dicks DNA comes from her maternal side. Joan’s maternal DNA is made up of her mother’s two parents DNA joined together (recombined). Those 2 parents were Joan’s grandfather Frederick Upshall and grandmother Daly. Joan’s maternal Chromosome 2 is alternating between Upshall (whose mother was a Dicks) and Daly.

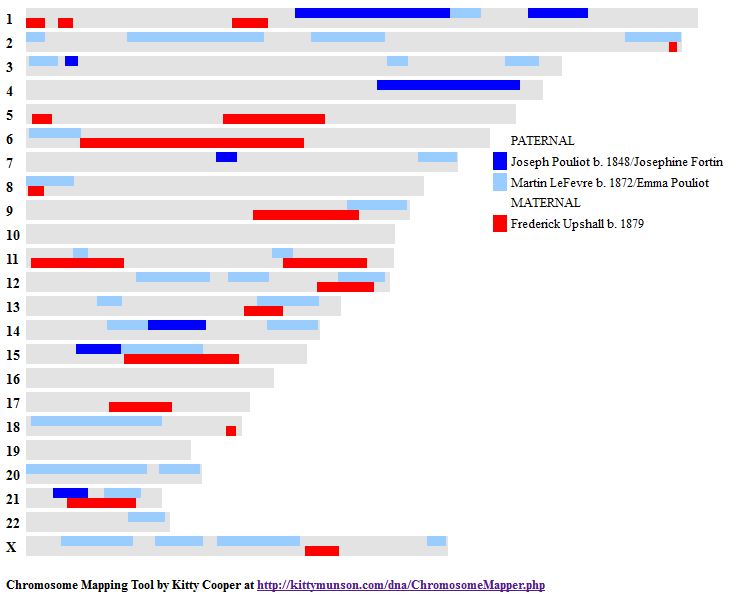
Here is a map of my actual Chromosome 2 showing the alternating pattern:

joelchr2

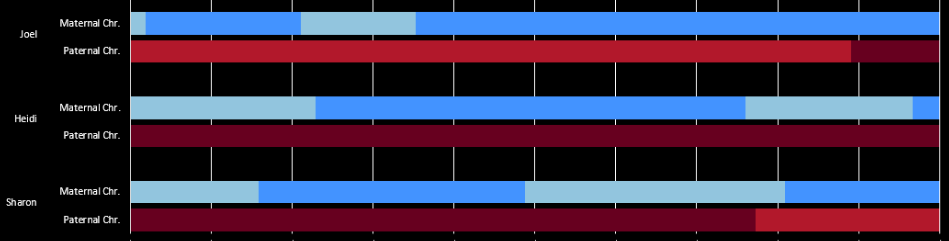
This chart was created by M MacNeill [prairielad_genealogy@hotmail.com]. It is possible to map this out if you have 2 parents tested, or if you have one tested and 2 or 3 siblings tested. There is even a way to map your grandparents with siblings and no parent tested. In the case above. Light blue represents my maternal grandmother and dark blue is my maternal grandfather. The light red is my paternal grandmother and the dark red is my paternal grandfather. Everyone’s DNA follows the same type of pattern. The actual configurations where the changes are will be different. The place where a color goes from one to another is called a crossover. Sometimes there is no crossover or recombination and you will have all your DNA on a particular copy (maternal or paternal) of a chromosome from one grandparent instead of two.

Back to the TG at Chromosome 2:

chr2joan

Notice what Joan’s matches with Sandra, Denise and Nelson have in common: they all end around 192M. That should be the place where Joan’s DNA switches from her grandpa Upshall to grandma Daly.

Here is Joan’s Chromosome 2:

joanchr2

This shows her matches with:

  1. Esther
  2. Nelson
  3. Sandra
  4. Denise

To the right of the one blue bar on top of the 2 green bars is where Joan drops out of this Dicks TG. I can almost map Joan’s Maternal grandparents from this gedmatch chromosome broswer. Here is my guess:

joanchr2map

A few notes:

  • Joan’s Daly grandmother is not from Newfoundland
  • Another possibility could be that the Upshall segment could extend to Joan’s matches with #2, 3, and 4, eliminating the first Daly segment I have.

Another interesting question is: Why doesn’t Esther match Joan where Joan matches Nelson, Sandra, and Denise? The answer would be that Esther has Upshall DNA in this area rather than Dicks and Joan got Dicks DNA in this area. It’s a bit confusing as you have to picture what is happening on each side of the match between Esther and Joan.

Marilyn and Howie’s appearance in TG2

I’d like to bring up an interesting point about siblings. Siblings represent the only relationship where you will find appreciable FIRs. FIRs are Fully Identical regions. Here is Marilyn’s match with her brother Howie on Chromosome 2:

marilynhowiechr2

This shows that Marilyn and Howie match each other along the blue line. That is from 0 to 147M. Then they don’t match from 147M to 182M. Then they match again to the end of the Chromosome 2. Above the blue bar are green and yellow areas. The yellow is how we match everyone other than siblings. The green is the FIR. That means a double match. As siblings, Marilyn and Howie share all their 4 grandparents: 2 Paternal and 2 Maternal grandparents. Looking at Marilyn and Howie’s Chromosome 2, I can know what the green, yellow and red regions mean:

  • Green – Marilyn and Howie both share a maternal grandparent and a paternal one. We just can’t tell which one right now.
  • Yellow – Marilyn and Howie both share a maternal grandparent or a paternal grandparent. Again we can’t tell which one right now.
  • Red – Marilyn and Howie share the DNA of neither their maternal nor paternal grandparent.

Here is the 2nd part of the TG at Chromosome 2:

tg2marilynhowie

The appearance of Marilyn and Howie in this TG is clear: 201M. I just found out recently that there is a way to expand matches to great detail as shown in the Gedmatch Chromosome Broswer. Here is Marilyn and Howie expanded at around 201M:

marilynhowiechr2-201

This is difficult to see. The number in the middle is 200M. That is one tick mark away from 201 where Marilyn and Howie enter the TG. Another interesting thing is that Marilyn (Molly) above gets out of the TG at 208 and Howie gets out between 212 and 218.  What does all this mean?

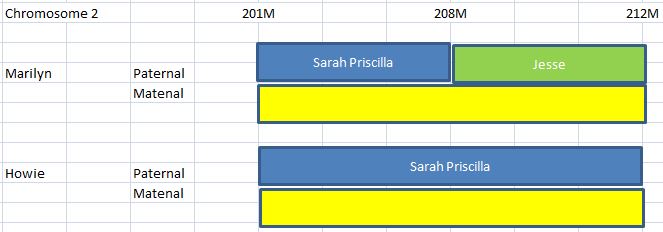
  • Based on the expanded view, Marilyn and Howie are FIR from a little after 195M. They jump into the TG at 201. FIR means that Marilyn and Howie share the same 2 grandparents – one maternal and one paternal. However, without the comparison of another sibling, this is difficult to see. I am assuming that from 195 to 201M, Marilyn and Howie share the same 2 grandparents, but not necessarily the same two as after 201M. At 201M, Marilyn and Howie both get their DNA from their paternal grandmother Sarah Priscilla. Sarah is the one with Dicks DNA.
  • At 208M, Marilyn drops out of the TG before Howie.

Here is an expanded view of an already expanded view of Marilyn and Howie at 208M:

chr2-210

Every little tick mark [^] is 1M. So 2 ^’s before 210M is 208M. That is where Marilyn and Howie go from FIR to HIR. An HIR is a Half Identical Region. That means that Marilyn and Howie match one grandparent (on the maternal or paternal side) and they don’t match the other grandparent (on the opposite of the maternal or paternal side where they do match). This is easier to show by mapping it out:

chr2map

It is clear that from 201 to 208, that Marilyn and Howie are in a TG. They are also FIR. That means that they have 2 grandparents the same (one paternal and one maternal, here represented by blue and yellow). The TG identifies the paternal grandparent as Sarah. She is the one that descends from the Dicks family. We don’t know which Maternal grandparent that Marilyn and Howie got their DNA from. We just know that it is the same grandparent.

At 208M, two things happen. Marilyn exits the TG and is now in an HIR with her brother Howie. HIR means that Marilyn gets her DNA from one grandparent (on the maternal or paternal side). On the other side from where she gets her DNA, she doesn’t get her DNA from the other. In this case, that means that she continues to match the same maternal grandparent and switches the paternal grandparent that she gets her DNA from from Sarah to Jesse.

All this is to say that it is helpful to have a sibling or more tested.

Chromosome 12

Like the TG at Chromosome 2, the TG that Howie is in at Chromosome 12 is not new. It has been described previously. Here is what it looks like in a spreadsheet:

tg12howie

The difference is that there is a Joyce Line TG within an apparent Dicks TG (in gold). Also within the gold TG there are single matches of people from the Henry Dicks Line. That could mean a few things:

  • The green matches are in non-Dicks lines
  • The green matches are with Dicks lines. If that is true, that would mean that the gold TG must point back to the wife of Christopher Dicks who I have as Margaret b. 1789.
In TG2, I had missed Denise in part of the TG. Previously I had missed Pauline in this one. Part of the reason I may have missed Denise in TG2 is that her match with Marilyn was less than 7 cM so didn’t show up at Gedmatch at threshold levels. In this case Marilyn doesn’t match Pauline, because she drops out of the TG right around the spot where Pauline joins in the TG (127M).

Here is Joan compared with Esther, Howie, Marilyn and Pauline:

joanchr12

In the above browser image, Joan’s maternal grandparent mapping would likely go Upshall, Daly, Upshall. One can see where Howie and Marilyn jump into the TG in the 2 yellow bars. You can also see how Marilyn (#3) jumps out of the TG on the right and Pauline (#4) jumps in (green bar).

For comparison, I will show the same matches from Esther’s point of view:

estherchr12

Esther’s view has to be exactly the same for #1 as they are comparing the same 2 people (Joan and Esther). Esther’s view gives a crisper indication of Marilyn’s crossover.

Chromosome 12 is shorter than Chromosome 2, so it should be simpler. Here are Marilyn and Howie compared at Chromosome 12:

mhchr12

Marilyn and Howie have 3 HIR’s, one FIR and one area where they don’t match either of their grandparents. In that area where they don’t match, if Marilyn got her DNA from her her maternal grandmother and paternal grandfather, for example, it would mean that Howie would have to get his DNA from his maternal grandfather and paternal grandmother.

We have more detail on the positions from the TG:

tgpauline

Howie and Molly jump into the TG at 114M. Molly jumps out at 126M and Howie jumps out at 132M. Actually, he had to as that is the end of the Chromosome!

Looking at Marilyn and Howie’s expanded view of Chromosome 12, their FIR starts at 101M. That switches to an HIR at about 126.5M. That corresponds where Marilyn gets out of the TG. It also corresponds where the green goes to yellow in the Gedmatch Chromosome browser in the image above.

mh12map

This looks similar to the Chromosome 2 map of Marilyn and Howie. This time I was a bit more brave due to my experience with Chromosome 2 and mapped their DNA to the beginning of their HIR rather than just to the beginning of where they jumped into the TG (113M). The reason for this is for there to be a change at 113M would require a double crossover for these two which is unlikely. Another note is that the yellow grandparent in this example may not be the same as the yellow one in Chromosome 2. It is just meant to represent one of the maternal grandparents in each case.

One More Question On Crossovers

I’m learning this as I go along. I had determined a crossover above at 126.5M above where one sibling left the TG and the other stayed in. However, I did not have a crossover at 114M where both siblings entered the TG. Why is that? I had a crossover at 126.5 because the chromosome browser verified that the siblings were switching from a FIR to an HIR at 126.5. To me, this verified the crossover in conjunction with the change in TG at the same location. At 114M, there was no change:

chr12pos114m

Above is the close-up view of Marilyn’s match to Howie on Chromosome 12 between positions 110 and 120M. The whole area on either side of 114M is FIR. That likely indicates no crossover at Marilyn’s and Howie’s grandparent level. However, it was Marilyn’s great grandmother Bertha Joyce that had her grandparents’ Dicks and Joyce DNA recombining into a crossover. It is likely that this TG represents the DNA that Bertha Joyce received from her grandparents probably sometime around the American Civil War. I note that the TG that I looked at above at Chromosome 2 followed the same pattern. The crossover was where one sibling left the TG and the other remained. Where the two siblings started in the TG, there was no change in the FIR region to an HIR.

So the answer is that there was a crossover at some point at position 114M, but quite a while before the time period that we are looking at here. So it is hidden in my map above.

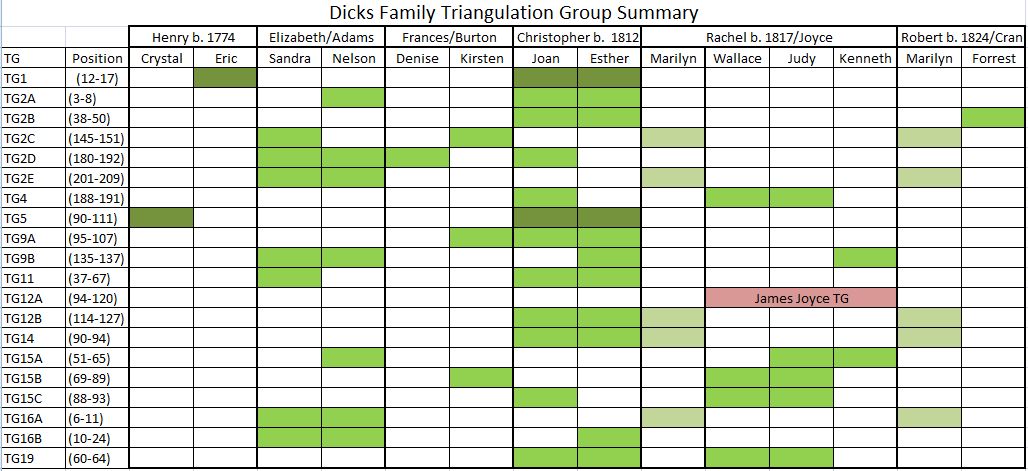
Dicks TG Matrix Update

dicksmatrixupdate

  • Here I took out Eric as his father Claude (who is believed to be the one descended from the Dicks family) was not found to be in a TG. Eric was in a TG with Joan and Esther, but that must have been on his maternal (non-Dicks) side.
  • I didn’t add 2 extra columns for Howie, but put him in the appropriate boxes where the existing TGs for his sister Marilyn were.
  • I added Denise to TG2E and Pauline to TG12B. That was an important addition for Marilyn and Howie as it seem to indicate that their Dicks DNA comes from the Joyce rather than the Cran Line in this case. Recall that in TG2E, I was suggesting that this might represent the Cran line for Marilyn and Howie.

The All-Dicks Comparison

autosomalmatrix

The top left box are the Christopher Line descendants. The bottom right box is the Henry Dicks Line descendants. This now includes Claude and Howie. For an interesting comparison, run down the two columns of Molly and Howie and see how the total cMs of their matches differ.

Summary and Conclusions

  • I didn’t add any new TGs by the addition of Marilyn’s brother Howie and Eric’s father Claude.
  • Marilyn and Howie are the first known Dicks descendant siblings to have their DNA tested. So I took advantage of that to explain how crossovers work and how they are important in mapping DNA.
  • The combination of the sibling comparisons and TGs made it possible to partially map two of Marilyn’s and Howie’s paternal grandparents on portions of Chromosomes 2 and 12.
  • I also showed a likely scenario for Joan’s crossover point within a TG which would lead to mapping segments that she received from her maternal grandparents
  • I clarified a few issues and refined the Dicks Triangulation Group Matrix


DNA Phasing of Raw DNA When One Sibling is Missing: Part 10

In this Blog, I would like to portray my phasing results in an Excel Bar Chart if possible. This has been one of the most difficult parts a phasing my DNA for me.

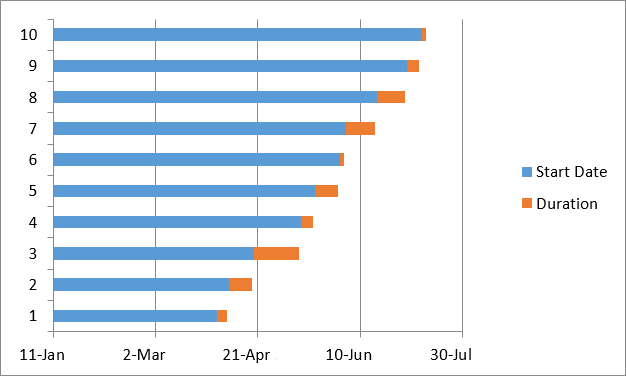
I have looked at Stacked Bar Charts in Excel as they seem to be the closest to what I am looking for. Today I looked at a method for producing Gantt Charts at ablebits.com which seems to hold some promise of application for DNA mapping:

bar-chart-excel

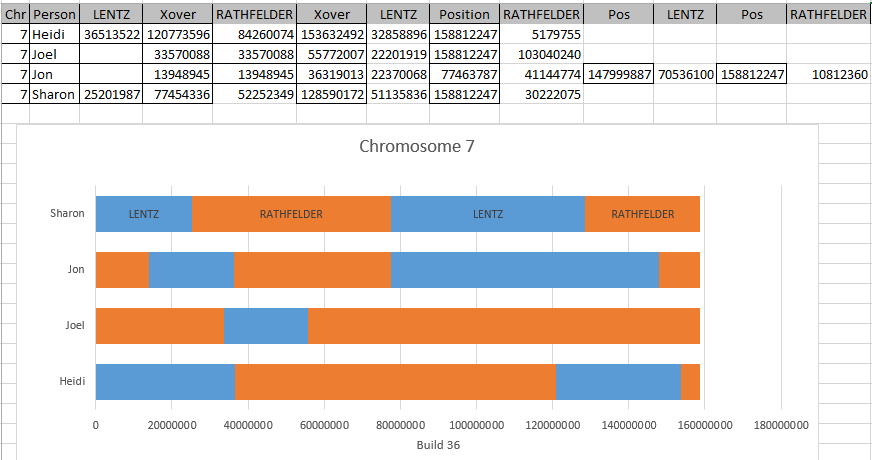
I had my Maternal Patterns’ Starts and Stops from my last blog. I took those and converted them to Build 36 and put them in a spreadsheet:

momcrossoverstable

Start is the ID# I was using. Start36 is the Chromosome position of the Start of the pattern in Build 36. App ID is the approximate position of the Crossover. Then I have that same location in Build 37 and Build 36. Following the logic in the Ablebits.com tutorial, I have the first Maternal Crossovers for Chromosome 7 in my simplified Chart:

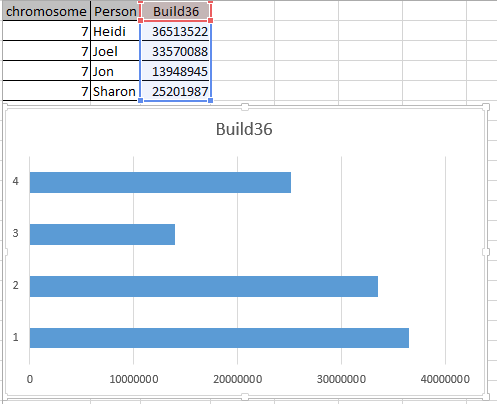
matfirstxover7

I got this by choosing the Build 36 column and choosing Insert Stacked Bar. I suppose a better Title would have been Chromosome 7 Maternal Crossover rather than Build 36. This was taken from my Column Header. The goal is to get a 2 color bar above. However, I already see a problem. The bar needs to be different colors for different people. Well, I have to start somewhere.

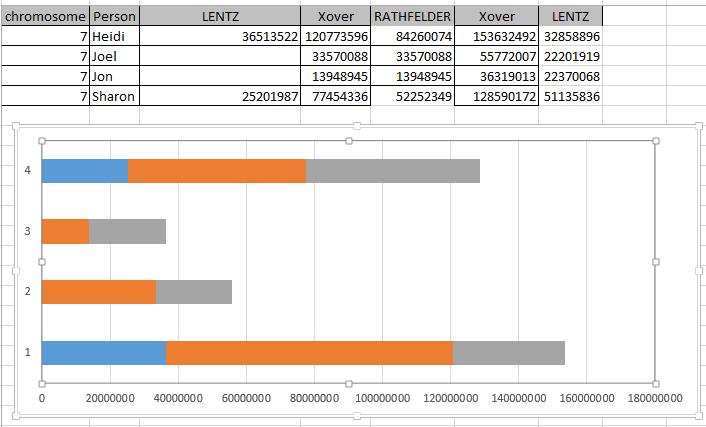
Next, I put in the next crossover location for each person. I took this position and subtracted from it the first Crossover to get a length.

step2crossexcel

You may note that the Bar Chart inverts the original order. It gives Sharon a 4 which is now on top. Here is my visual phasing of Chromosome 7 that I am trying to replicate:

chr7visphase

My Excel Bar Chart order is Sharon, Jon, Joel, Heidi. My visual phasing order is Sharon, Joel, Heidi, Jon. The 2 maternal colors I have above are green and orange representing Lentz and Rathfelder. If I keep orange as Rathfelder, that means I want to change bar 2 and 3 (Joel and Jon) on the Excel Bar Chart. One way to do this is to move over the first Crossovers for Joel and Jon in my spreadsheet:

modchart

However, that made the 2 male siblings’ first maternal grandparent match too long. I needed to move the start over 2 places in my spreadsheet:

mat7revised

Now the Chr7 Maternal Crossover column can be called Lentz and the 2length column can be called Rathfelder.

Next, I added another column for the next Lentz portion of DNA:

chr73rdxover

I was hoping that if I named the next column Lentz, that Excel would give me the same blue as the first Lentz. I was able to right click on the gray and change it to blue. I then added another Rathfelder segment. For this to work in Excel, a Rathfelder length is added rather than a start and stop location.

chr7xover3

Again, I had to reformat the Excel-chosen color to be consistent with what I had for Rathfelder. I chose the last position for Heidi and Sharon as the highest that I had as this was their last segment. After a bit of wrangling with Excel, I was able to get this:

chr7

So that is the presentation. However, I notice that on my visual phasing, I had 5 segments for Jon and only 4 here. I missed his last Rathfelder segment. I had ended Jon’s Chromosome too early. Here is the correction:

chr7corrected

It still looks like one of Jon’s crossovers in the middle of the Chromosome may be off, but I’ll have to figure that out later.

Paternal Bar Chart

Now that I have something that looks like a maternal Chromosome Map, I need the paternal side to go along with it. It looks like if I add 4 more rows to my spreadsheet, I may have it.

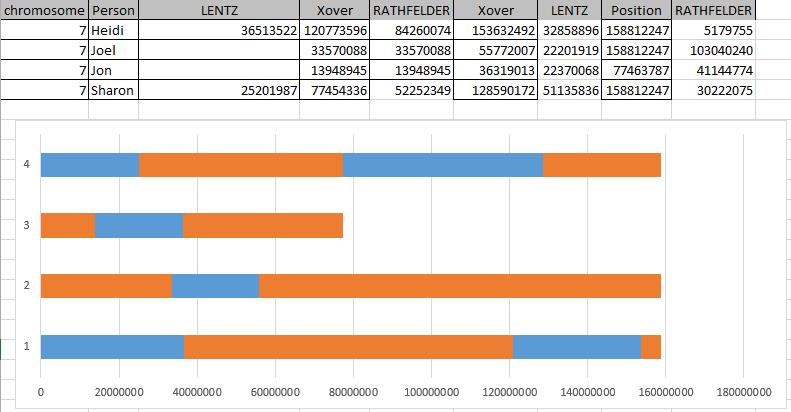
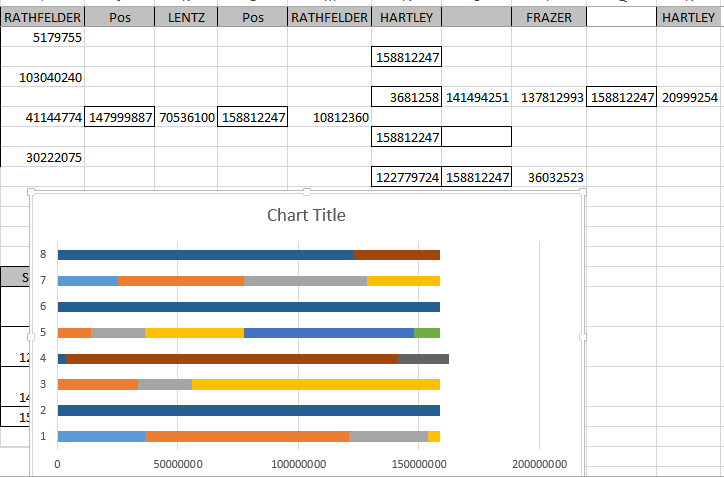
I did this and I added Hartley and Frazer (my paternal side grandparents) to the right of the maternal side grandparents. I had to make a new chart that came out like this:

chr7matpat

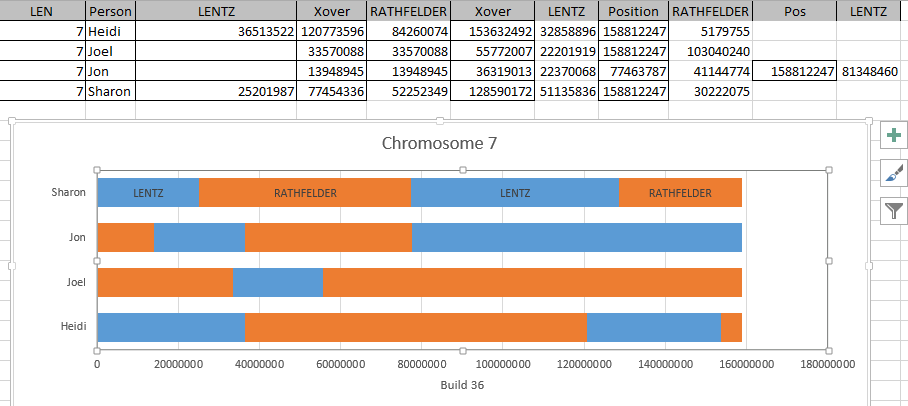
Here #4 is my Paternal DNA. I found it a bit disconcerting that my paternal side was longer than the maternal. Here I’ve added a bit of formatting and made the colors consistent (one color per grandparent):

chr7patmatmap

Well, I guess I’ll just leave this imperfect. It will give me something to work on later. I did change the scale from millions to M’s to be easier to read.  The above shows that Jon and Heidi share their paternal grandfather’s Hartley DNA un-recombined on Chromosome 7.

Summary and Conclusions

  • Learning how to phase my raw DNA has been interesting and time consuming
  • Delving into the A’s, G’s, T’s and C’s promotes understanding of one’s DNA
  • I owe a lot to M MacNeill and Whit Athey in learning how to do this phasing
  • Due to the data intensive nature of phasing, I would recommend the use of MS Access or some other database software.
  • An understanding of Excel or similar spreadsheet software is also important.
  • I had tested my brother Jon as an afterthought. It turned out that his test results were important in determining the phasing of the 4 siblings.
  • I have the overall skeleton of the phasing with crossovers. There is still a lot of work to complete the individual Chromosomes and trouble shoot problem areas.
  • Further, I have not worked on the X Chromosome due to the different nature of that Chromosome. My brother and I are already phased. My sisters are not.
  • Once these maps are done they will be a reference to all matches to my 3 siblings and myself.

DNA Phasing of 4 Siblings When One Parent Is Missing: Part 9

Mom Patterns

Up to this point, I have phased 4 siblings based on 3 principles outlined by Whit Athey. I have looked at the bases the 4 siblings had from their Dad. Those Dad bases made up patterns. Based on those patterns, other Dad bases were added to those siblings within those pattern areas. After those bases were added, mom bases were added where the siblings were heterozygous. The changes were documented in a Base Tracker.

Start stop using access min max – AAAB Mom Pattern

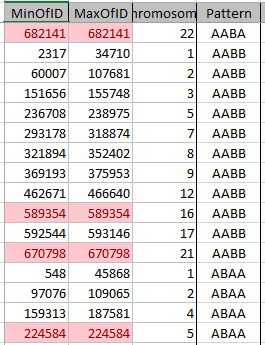
I can just look at my previous Blog to see what I did for my dad pattern. The results of this query:

mompatternquery

get copied to this spreadsheet where I added a column for Pattern:

mompatternspreadsheet

That was my big time saving step from my last query. Before I run each Min Max Total Query, I check a regular Select Query to make sure I have the right pattern. For example, here is my ABBA Mom Pattern check:

abbacheck

In a few minutes, I have 111 Start/Stop Mom Pattern pairs. This time, I’ll add conditional formatting to point out the one position patterns:

startstoponepattern

These single patterns tend to mess me up as I’m looking for patterns, so I’ll take them out of my spreadsheet, but not out of my Access data tables. There were 10 of these. I don’t know if that is a lot.

Getting better starts and stop for the mom patterns

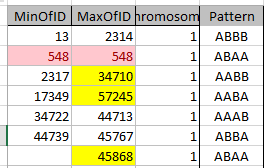
The next step takes a little while. I look at the [now] 95 Start/Stop pairs for the various patterns. I highlighted the overlapping areas in yellow:

mompatternoverlaps

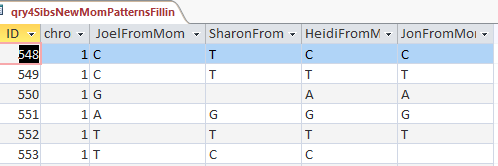
Actually, the first pattern overlaps into the second also. Some of these may be caused by single location patterns. For example at Chromosome 1, when I got to ID# 548 I find this:

momchr1

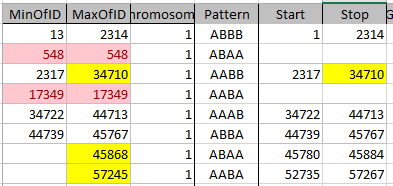
There is an ABAA Pattern, but it only lasts for one position and then is on to an ABBB pattern. I copied the end location for ABAA and put it at the end of Chromosome 1 to check later and made note of the one position pattern:

onepatternchr1mom

After that, it makes more sense that the ABBB pattern Stop at 2314 goes into an AABB Pattern Start at 2317. Here is the adjusted Chromosome 1 for my siblings’ Mom Patterns:

cleaneduppatternsmom

I moved the first Start to the Start of Chromosome 1 and last Stop to the end of Chromosome 1 as they were already pretty close to those positions. All combinations of patterns are represented here except for ABAB. I don’t have a start and stop for the single patterns as I’ll be taking them out later.

Filling In Mom Patterns

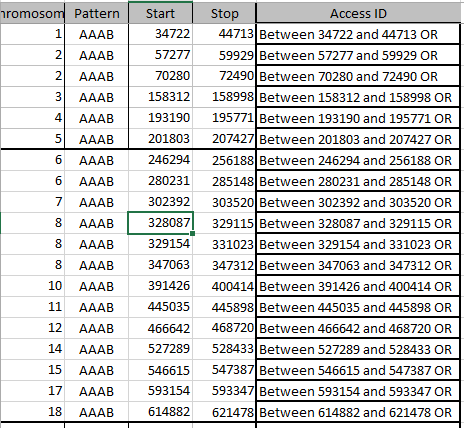
Now that I have all the mom patterns and their starts and stops as well as I can, I will fill in the patterns. I’ll start with AAAB. First I use the Concatenate formula in Excel to get my starts and stops in Access language. Then I sort the patterns in Excel:

mompatterssorted

I have 19 AAAB Mom Patterns. Next I go into Access and create an Update Query using the table called tbl4SibsNewMomPatternsFillin. In the AAAB Pattern, I will want to fill in the missing A’s.

updatequeryaaabmom

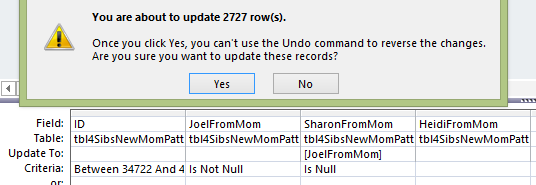
This looks like a good query, but I want to track how many bases I’m updating, so this query would make it difficult to track that as I’m adding bases to Sharon and Heidi. So again, I will go with the simpler query.

aaabsimplerupdate

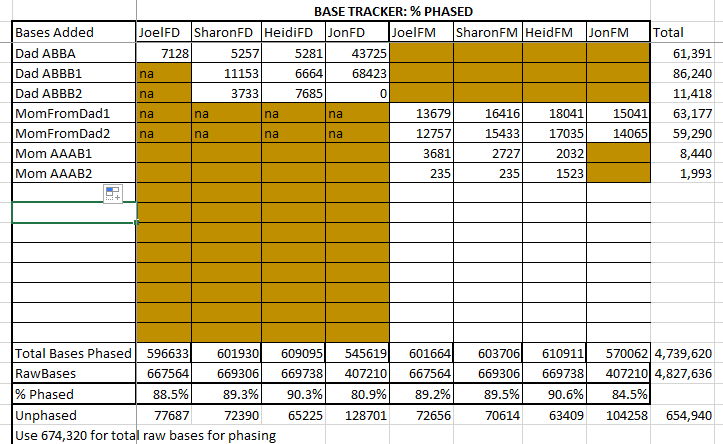
Here is the first Mom Pattern Fill-in update on the Base Tracker:

basetrackeraaabmom

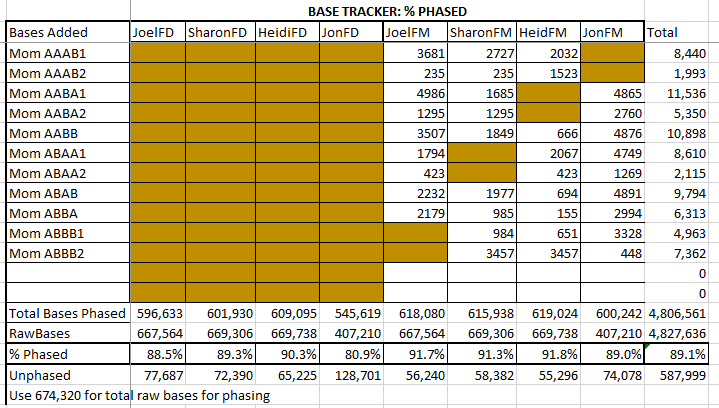
I continued the same process down the Mom Patterns, filling in what was missing from each of the siblngs:

momfillinupdatetracker

In each case for each pattern, I added less than 5,000 bases to each sibling. I also added to my spreadsheet a percentage of overall phasing which is now at 89.1%. This is how the 4 siblings are phased on average. Jon, who tested with the Ancestry V2 is bringing the other siblings’ overall average down.

Principle 3 – Dad Bases From Mom Bases

This is the icing on the cake for me. After all the work of determining Patterns and Starts and Stops, I have an easy step to add bases. Principle 3 says if you are heterozygous and you know one of your bases is assigned to one parent, then the other base must be assigned to the other parent.

I had to look at my previous blog to see how I did this. Let’s see if this looks right:

udatedadfrommom

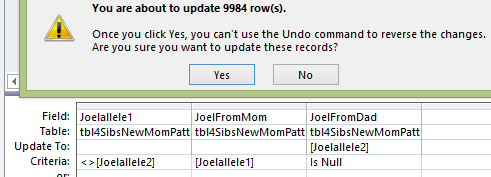
The first column makes sure that I am heterozygous as my 2 alleles are not the same. The 2nd columns says that I know that I got allele2 from Mom. The 3rd column says to put my allele1 as the one I got from dad. That seems to make sense. This results in 9523 rows of updates in 22 Chromosomes. In part 2 of this Update Query, I switch the alleles:

dadfrommomforjoel

This says if my allele1 is from Mom assign allele2 to be from Dad.

Summary of Pattern Filling In and Dad Bases from Mom Bases

btdadfrommom

Here the overall phasing is 90%, but I had a pretty strict measure of phasing. It involved alleles that Jon was not even tested for. Here we are getting a diminishing return. I could continue the process, but I won’t.

Next Steps

Now I have a good idea where all the crossovers are. I need to assign those to siblings. Then I need to figure out how to portray the final results.

Assigning Crossovers to Siblings

I might as well jump right in. I’ll try a Chromosome that McNeill has mapped. Actually, he only did the 3 siblings at the time, so it may be a little different.

Chromosome 7 Crossovers

This has been mapped by MacNeill to 3 siblings. Let’s see how my mapping compares. Here is the mom pattern:

momstartstop7

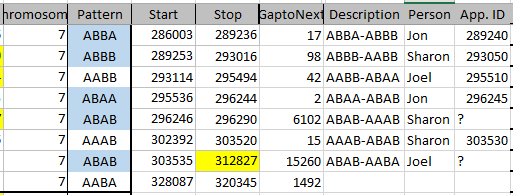
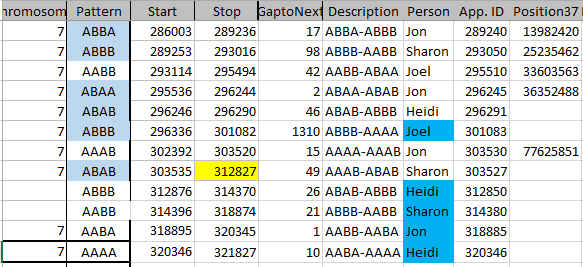
Here I have by my own ID’s the start and stop. Then I have gap to the next pattern. This may indicate an AAAA pattern. Under description, I have what the pattern changes are. Then I have the person assigned to the Crossover. Then I have the approximate location of the Crossover. The first line I have the description as ABBA to ABBB. Here, Jon (in the last position) was matching with me as I’m in the first position of course. Then he changed to match with Sharon and Heidi. So I assigned the crossover to him.

Look at the 5th line. The pattern is ABAB to AAAB. This goes through a gap of over 6,000 ID’s. That usually means there is an AAAA pattern there.  AAAA could go to AAAB easily, but to go from ABAB to AAAA would take two crossovers. I don’t have a good idea where the crossover is, so I’ll go to gedmatch. The good news is that I have already tried using visual phasing on this Chromsome:

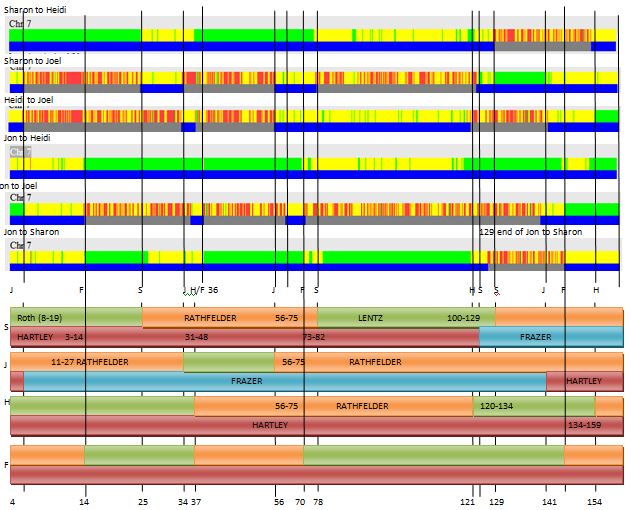
chr7vismapjon

The crossovers that I looked at above in my spreadsheet were on the maternal side. So that would be the top part of the bar (green-orange). It looks like I have 11 or 12 maternal crossovers, if I did it right. Looking at the top part of the image above, notice the non-match areas. These have no blue bar below and have red areas above. These are important. The reason is that if there is any of these areas at any place, there cannot be an AAAA pattern for maternal or paternal. That means that all 4 siblings cannot match the same grandparent in any of these areas. The only potential AAAA patterns, then are at either ends of the Chromosome or in the middle. The middle locations are about 60-70M. Also note that I have Rathfelder as the same match for each sibling from 56-70M.

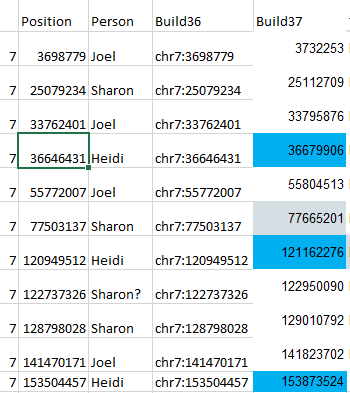
There is a discrepancy between my spreadsheet crossovers (7) and the visual above (11 or 12). The other problem is that I need a double conversion from my spreadsheet. The spreadsheet is in ID’s which refers to Build 37 locations and Gedmatch is in Build 36.

Before I start converting numbers, I’ll look at what I have for the Dad Crossovers.

dadpatterncrossover7

Here I added a position number for the Chromosome (Build 37). This matches up with the visual phasing above. What is missing would be the crossover for Joel after an AAAA pattern at the beginning of the Chromosome.

Where is Heidi?

As I look at the maternal visual phasing, I see that Heidi has 3 crossovers. On my spreadsheet, she doesn’t have any. One can be explained as going onto the right end of the Chromosome to an AAAA pattern, but what about the other 2 crossovers, in the middle of the Chromosome? I got these positions from an old file where I compared myself to my 2 sisters. Then I put those in a spreadsheet and converted them to Build 37:

findingheidi

The Chromosome position numbers in blue were where I had Heidi’s crossovers. I then went to my Access Database.

Heidi found

heidi

Here is an ABBB Mom Pattern that I missed. Going through the list, I updated my crossover list:

updatedchr7xover

Now I am up to 12 Maternal Crossovers. The AAAA patterns tend to fit in naturally. Note next to the first blue ‘Joel’. There would be no way to go to an ABBB pattern to an AAAB pattern without 2 changes. That is why an AAAA pattern is required within the other 2 patterns.

Paternal Crossovers – Chromosome 7

crossoverschr7

Here I only show 2 crossovers, where on my map above, I show 3. I am just missing my own crossover from AAAA to ABBB. This is at the beginning of Chromosome 7. Here is my database table for my Dad Patterns:

chr7dadpattern

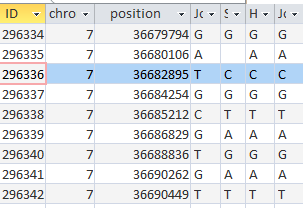
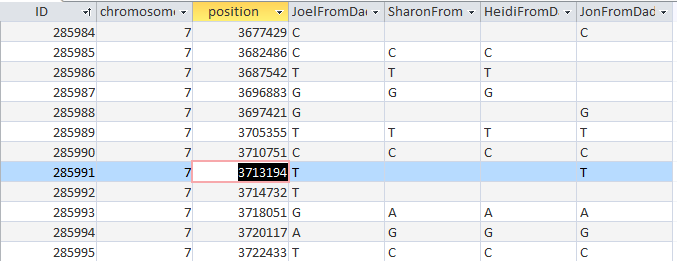
The position I have highlighted would still be an AAAA pattern as I have A??A. So that is the last position with that pattern. Id 285993 is the first spot I have the ABBB pattern, so I chose the crossover as ID# 285992 (under App. ID):


dadcrossover7

Here is what MacNeill had for 3 siblings at Chromosome 7:

macneill-chr7

What is now clear from have 4 DNA tested siblings is that my first crossover is paternal and not maternal. For my first crossover to be maternal, I would have had to have gone from an AAAA pattern to an ABBA pattern which would have been a double crossover. Having my brother Jon (the last ‘A’) tested made that clear.

Summary

In this Blog, I have looked at the Mom Patterns created by 4 siblings. Based on those patterns I have filled in alleles from other siblings. I have also filled in alleles for heterozygous siblings. This is based on the Mom allele being known and assigning the other allele as from the Dad. Then I looked at assigning crossovers to the various siblings. Based on the Patterns, it seemed clear who the crossovers should be assigned to. I then checked the crossovers I had with a visual phasing based on gedmatch. This showed where I was missing crossovers, which I was able to add using Chromosome 7 as an example.

Next: How to show the final results?

DNA Phasing of 4 Siblings When One Parent Is Missing: Part 8

Dad Patterns

In my last Blog, I looked at the Whit Athey 3 Principles and used MS Access to assign bases to the paternal or maternal side for the 4 tested siblings of my family. The next step is to look at Dad Patterns. I have been doing this by querying for a pattern and then scrolling down for start and stop positions. This has been quite tedious. It occurred to me that there may be another way to do this.

MS Access Min Max Functions

Access has a function that finds a minimum or maximum value in a group. In this case the group can be Chromosome.

AAAB Dad Pattern – Access to the rescue


aaabminmax

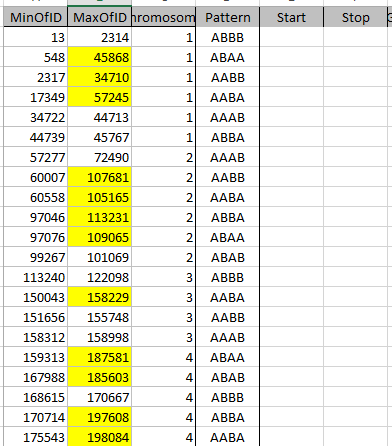
To get the total line I hit the summation [totals] icon in the Show/Hide Group. This adds a Group By to each field to in the Total row. Here I looked for the Minimum and Maximum ID for each chromosome for the AAAB Dad Pattern. That is where Joel’s base from dad was the same as Sharon’s. Sharon’s base from dad was the same as Heidi’s and Heidi’s base from Dad was different from Jon’s. Here is the output for the AAAB Dad Pattern:

aaabminmaxresults

This step has revolutionized my work as it saves me from scrolling through 100’s of thousands of dad base AAAB Patterns.  This takes about 2 minutes vs. the old way which seemed like an hour.

The upside of this method is that it is fast. The downside is that it only finds the minimum and maximum of a pattern within a chromosome. It doesn’t find all the breaks in the patterns within the chromosomes.

Using this method, in a couple of minutes I have 91 Start and Stop locations for all the possible patterns – except for AAAA.

Here are the sorted results for Chromosome 1:

dadpatternchr1

Note that there are some overlaps that will need to be resolved. However, there also clean breaks such as between ABBB and ABAB. ABBB stops at ID# 19797 and ABAB starts at 19837. Also note the last line. AABA has the same Min and Max ID#. This means that this is a single AABA pattern apparently within the AABB pattern.

Looking at the Table

In this step, I’ll look at tbl4SibsNewDadPattern and use the Access Pattern Mins and Maxes to get more accurate Start and Stop points. My spreadsheet above shows that ABAA starts at ID 52. I scroll up from there:

chr1tabledadpattern

At ID# 18 I see ?AG?. I can imagine that being an ABAA pattern, so why not start the ABAA Dad Pattern at ID# 1? Out of 680,000 ID’s, that doesn’t seem too much of a stretch.

Next it seems like the ABAA should stop somewhere before ID# 6605. I’ll hasten the process by a query that looks at the case where Sharon’s base from Dad is not equal to Heidi’s Base from Dad:

abaa-stop

Clearly, there is a break at ID# 5127, so I’ll use that.

chr1dadpatternstartstop

Here, I’ve added a finer Start and Stop for Dad Pattern ABAA. What that means is that in this segment of Chromosome 1, I got my DNA from one of my dad’s grandparents as did Heidi and Jon. Sharon got here DNA from the opposite paternal grandparent.

Here is the Start/Stops filled in:

chr1dadpatternfilledin

I highlighted the 57205 as a reminder that I needed to add an extra ABAA pattern in later. There is a gap between ABAA and ABBB of 1477 ID’s where there is a likely AAAA pattern, which means the 4 siblings got their DNA from the same paternal grandparent.

Finished Start Stop Dad Pattern Spreadsheet

I took out the single patterns and re-sorted by pattern. Then I wrote a formula to get the locations in Access language:

dadpatternstartstop

Next I made a copy of my working table in Access to a new table called tbl4SibsNewDadPatternFillin. I’ll use this to fill in the Dad Patterns.

Filling in the First AAAB Pattern

In this pattern, I will be filling in all the missing ‘A’s of the AAAB pattern. I won’t fill in the B as I won’t know if an ‘A’ or a ‘B’ belong there. Here is my first update query:

aaabupdate

This says if I am missing a base from dad in any of the AAAB Pattern areas that I am in and Sharon has that base, I’ll take the base she has. I can save a little time, by adding on to that query:

joelaaabfromsharonheidi

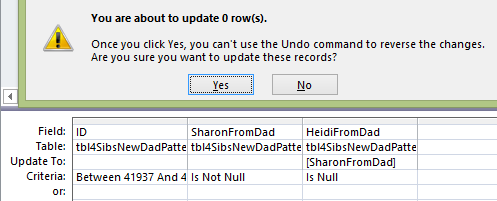
It is important to put the second ‘Is Not Null’ and ‘Is Null’ on a separate line as that is the ‘or’ line. Otherwise, I would only get the Sharon from Dad and Heidi from Dad bases where they equaled each other.

First I run the query to make sure it shows what I want.

aaabqueryex

It does [although, see below. For one thing I missed the ID criteria in the 2nd line of criteria!]. If I had the criteria all on one line, I wouldn’t have gotten the Heidi from Dad bases where Sharon is missing a base (ID# 63) and visa versa. I will want to check my query later, so I can check it at least two ways. One way is to check at ID# 63 and 99 to see if that base was added. The other way is to see if the Update Query updates 49094 lines as that is the number of lines in the above query.

When I went to run my query, I got this error:

udateaaaberror

Before I give up on this double query, I’ll try one more thing:

heidiorsharonaaabtojoel

Here I say if the conditions I mentioned above apply give either Heidi’s base from Dad or Sharon’s base from dad to me. I note that the update is for 49094 rows, so that seems on the right track. The reason why I don’t mind doing a double query here is that either Heidi’s base from Dad or Sharon’s should always be the same in an AAAB pattern.

I ran this and now I am checking ID# 63:

erroraaab

Unfortunately, Access gave me a -1 instead of Heidi’s C Base from dad. Part of why I wanted to do the one query is so I wouldn’t have to add the 2 queries. However, instead, I’ll just add a line to my base tracker:

basetrackernew

That means that I am back to my simpler query. Sharon should add 3975 bases from Dad to my bases from Dad:

3975row

Heidi was going to add over 2200 of her bases from Dad before Sharon gave me hers. Now it is a lower number:

heidibasestojoel

Now check Line 63:

line63

My base from Dad still isn’t filled in. But that is a good thing. When I checked my double query above, it gave me areas outside the AAAB Pattern area. ID# 63 is actually a different pattern. So that is why the number was so high also. The lesson learned is to keep the queries simple.

Now I’ve updated my Base Tracker for the AAAB Dad Pattern:

aaabbasetracker

Note that the Heidi from Dad Bases didn’t go up in the second round of this query. After she had gotten her extra Dad bases from me in the AAAB region, Sharon didn’t have any extra ones to give to her that I hadn’t already.

nodadbasestoheidifromsharon

AABA Fill-in

This time Heidi will be left out and Joel, Sharon and Jon will get new bases from dad based on others from the AABA areas. This is the same simple query as before, except that the ID#’s are different:

aabafillin

Here is Jon’s first bases from Dad from one of his siblings:

jonfromdad

This brings up an interesting point. There may be cases where Jon has a phased base at a location which his DNA test didn’t cover.

AABB Fill-IN

Here there should be Bases for all siblings. Wherever there is an A and an missing A, add it, and the same for B. Again my first query is the same except for the ID#’s:

aabbfillin

On the AABB bases from Dad, Jon doesn’t have a lot to add to Heidi’s bases, but Heidi has a lot to add to Jon’s:

aabbbasetracker

abaa dad pattern fill-in

Here we start with Joel being updated with Heidi’s bases from Dad because Sharon is the lone B.

abaa

There are more rows updated as the ABAA Dad Patterns had more regions than the other patterns.

In my last update query, I made a mistake:

jonfromjoelmistake

I’m not sure if it makes a difference. I said that in the case where my base from Mom is not null, give Jon my Base from Dad where he doesn’t have any. To check, I run the correct query:

abaaquerymistake

This shows that there are still 2063 bases that didn’t get added to Jon from my bases from Dad. I will add them now. Plus I will add that number to the previous 29113 bases I added to Jon’s bases from Dad from my bases from Dad.

abaatracker

As there were 3 siblings the same in this pattern, I again took 2 rows to add the bases to the table.

ABAB Dad Pattern Fill-in

ababtracker

Jon now has more bases phased than he had tested on his paternal side. He already had more than he had tested on the maternal side.

ABBA and ABBB Dad Pattern Fill-ins

basetrackersummary

As expected, Jon made out best in this Pattern Phasing.

Mom Bases From Dad Bases

This is the part of the project that seems ironic. My dad who wasn’t tested for DNA is now supplying bases to his children that were from their mom. Here I’m looking for where the siblings are heterozygous. In those cases where there is now a Dad base from the patterns and a mom base is missing, we can fill it in.

First, I am making another copy of my table called tble4SibsNewMomPatternFillin.

Here is my first Mom from Dad Update Query:

joeldadfrommom

It says where I am heterozygous and my Dad base is my 2nd one put my first base in as the base I got from Mom, but only if she doesn’t already have a base there. The last part is just an extra precaution so that I don’t overwrite anything.

In the next query, I just reverse the Joelallele1 and 2 to get 12,000 more rows of phased DNA:

momfromdad2

Summary of Mom Bases from Dad Bases

trackermomfromdad

Check the numbers

I have been adding up the rows added. But now I will check my table to see of the Total Bases Phased added up. And the answer is:

countfromtbl

The numbers are pretty close. The above Heidi from Dad is higher than my tracker. I’m guessing the table sums are correct and mine are a little off. The means that Heidi’s paternal phasing should be a little lower.

Part 8 Summary

  • The use of MS Access Min and Max functions to get Dad Pattern starts and stops saved a lot of time
  • It still takes time to verify those starts and stops
  • The Base Tracker makes it easier to track the numbers and the process. It is also interesting to see how the % phased goes up with each round of updates
  • I wasn’t expecting the numbers from my base tracker and actual updated bases to reconcile perfectly, but most of the numbers did. It is possible the discrepancies are from the 2 minor errors I made and tried to correct along the way.


DNA Phasing of 4 Siblings and One Parent: Part 7 (Starting Over)

In my last blog, I found a few errors when I was checking some odd results. This lead me to think that it would be better to start the phasing process from the beginning. The beginning means using 4 siblings’ raw data and my mom’s raw data. This time I will be more methodical and keep track of the results. I have a new spreadsheet called The Base Tracker. Every step that I take, it will keep track of the bases from each sibling when they assigned to a parent.

A New Table

First I’ll create a new table from the raw data. I’ll start with my mom, me and my 2 sisters as they are all tested using Ancestry Version 1.

3sibtable

I called the table tbl3Sibs.

Next, I combined tbl3Sibs with Jon’s Ancestry V2 results into a new table called tble4SibsNew. I made sure I had a right connect on the arrow. That means that I wanted everything in the 3Sibs table plus what was in Jon’s information. If I had left it an equal join, I would have lost the bases that are in Version 1 but not Version of the AncestryDNA results.

mergejonwsibs

It is important here to connect by rsid. I made the mistake of connecting by IDs last time. As the different AncestryDNA test results versions had different ID’s, this produced crazy results. I also used only Chromosome 1-22 as there are too many special cases for the X Chromosome.

tbl4sibsr1

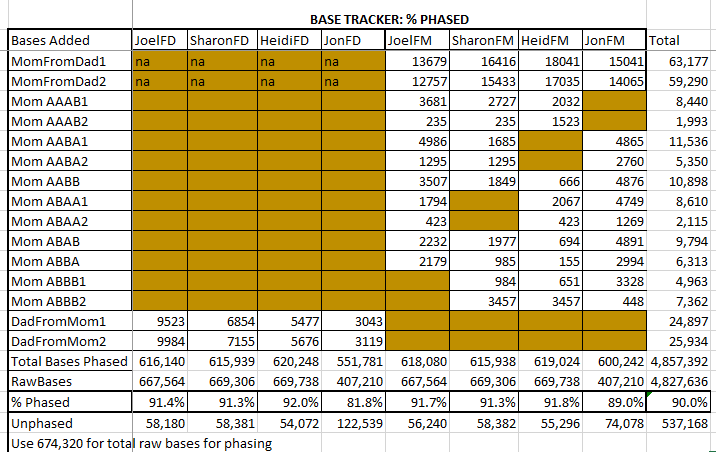
Then I used a count function to count the number of bases each sibling had. I also figured out how many blank lines there were out of the 682549 and subtracted those 8229 sibling blanks from the total to get 674,320. I’ll use that number to figure out the percent phased. This is the Count Query showing the Totals button in the Access Ribbon:

countrawbases

The results of this query were put in the RawBases Row below.

My New Base Tracker: % Phased

basetracker

The first column has the step taken. P1 is Principle 1. JoelFD is the Joel from Dad column, so all the Dad bases are on the left and mom bases are on the right. This table will give me the % phased for each sibling.

Principle 1 Query – Homozygous Siblings

This Principle is on the Principles from a Whit Athey Paper where you have 2 bases the same and each one is from each parent. The last time I did this, I may have had too much in a query at a time. This time, I’ll do the query separately for each sibling.

First, I opened up my tbl4SibsNew in design view and added more fields to put the new dad and mom bases.

newbasefields

First, I copied the table, so I’d have the raw data table with no additions. I called my new table tbl4SibsNewPrinciples. That is where the phased bases will go.

Here is a simple Principle 1 Update Query for me:

joelprinciple1

It says where I am homozygous, put both those bases in my JoelFromDad and JoelFromMom columns in the new tbl4SibsR1Principles.

joelprq

That little query phased over 900,000 of my bases into Paternal and Maternal sides.

I was interested in seeing the effect of Jon’s testing using AncestryDNA V2:

jontracker

Jon has a ways to go to catch up on being phased. This is due to the differences in AncestryDNA V1 and V2.

Principle 2 – Homozygous Mom

Here if my mom has the same base twice, one of those has to go her child. Here is a query to update my mom bases. As my dad’s DNA was not tested, he gets a non-applicable in that column.

joelpr2

Note that I have a criteria ‘Is Null’. This means only update this base if there is a blank there already. Here is the Principle 2: Homozygous Mom summary:

p2summary

Here I don’t know why my Principle 2 Bases were so low. I think it is because I made a mistake above, so I’ll do these steps over from the beginning.

Here I get more consistent results for my mom bases:

pr2joelfix

Here is the revised Principle 2 Summary:

prtrackerrev

Jon’s results also changed to be more realistic to where he was after Principle 1. I can also use the Access Count function to check these numbers:

countpr2

All the numbers match up except for JonsFromMom. For some reason, the spreadsheet is showing a higher number of Total Bases from Mom for Jon of 540956. If I subtract that from his Principle 1 bases from Mom, I get 272250. I’ll put that in as his Principle 2 bases from mom and assume that I made a mistake in writing down Jon’s Principle 2 base from Mom number.

pr2summaryreconciled

I suppose it’s like reconciling my bank statement. I assume that these are Jon’s mom bases filling in where Jon didn’t have test results that lined up with the AncestryDNA V1 results for his mom and siblings.

Moving On To Principle 3: Heterozyous Siblings

This works when the child is heterozygous and has one base phased to one parent. Then the other base is phased to the other parent. It appears that this would have to work just from the mom side for now to fill in the dad side. That is because we haven’t filled in the ‘fromDad’ side with any Heterozygous sibling results yet.

pr3joel

This query says in the situation where I am heterozygous and I get my allele2 from mom, assign my allele1 to be from my dad. But only do that where there isn’t already a JoelFromDad base there.

However, this raises a question. Here is the same query without the ‘Is Null’ criteria:

pr3joellarge

As you can tell, I am beginning to doubt my work. The question is, if there has been no previous addition of Joel bases from dad based on my heterozygous results why is there a difference between the two queries?

I checked Sharon’s results and found that she didn’t have the same situation. Where she was heterozygous, she didn’t have any bases from dad assigned to her.

Here is a query showing my problem:

p3problem

It is not a problem for phasing, but more for what I will enter into my Base Tracker. Fortunately, I can do a Count Query:

countjoelfromdad

This shows that my JoelFromDad bases have gone up by 25589 somehow since I last tracked them. This means that I should use the larger number for my Base Tracker.

Here is the Principle 3 Summary in my Base Tracker:

p3summary

In a few hours, I’ve phased over 4 million bases. And that time includes making mistakes and fixing them. All siblings are phased at over 80% at this point except for Jon. His Paternal phasing is lagging at only at one half.

I suppose that this is the time for me to say that it takes 20% of your time to get 80% of the result and 80% of your time to get the last 20% of your result.

Summary Part 7

  • After making mistakes, it feels good to start with a clean slate
  • Principals 1-3 of the Athey paper are easy to implement using MS Access
  • If a mistake is found, it is usually good to start from a clean table of data and fix it from there
  • The Patterns don’t lend themselves as well to Access and take more time to get
  • Having a Table to track the work and results is helpful and interesting.
  • In the next Blog (Part 8), I will be back looking at filling in the Patterns areas

Raw DNA Phasing of 4 Siblings Using One Parent’s DNA: Part 6

In my last Blog, I was still playing catchup in going from my original 3 sibling phasing, to incorporating my brother’s new DNA results.

Missing Principle 2 for Jon

Here is Principle 2 from the Whit Athey Phasing Paper I’ve been using:

Principle 2 –If data from one of the parents are available, and that parent is homozygous at a SNP location, then another almost trivial phasing is possible
since obviously that parent had to send the only type of base s/he had at that location to the child
I checked this in MS Access. Here is the query:
homozygousmom
This says if mom is homozygous, here allele1 is the same as her allele2. For those if Jon has null values in his FromMom column, then I skipped this step.
homomomerror
Clearly, I did mess this step from position one. As I was doing my previous steps, I thought that Jon’s results were very sparse.
principle 2 fix

For this, I will again use the update query.

homomomfix

In this case, I didn’t bother writing ‘Is Null’ under the JonFromMom column. That is because even if there is something in there, I would just as soon overwrite it, as this is such a basic principle. I only missed 481,000 rows.

second part of fix

Now that I have mom’s bases, I will go back and fill in Jon’s dad bases based on his mom bases. Those are also Principle 2 fillns where Jon is heterozygous. I don’t mind doing these updates in Access as they are so easy.

dadsbasefrommomjon

This says in the case where Jon is heterozygous and his mom has allele1, put Jon’s allele2 in as Jon’s allele from Dad. This query says if a Jon’s has allele1 from his Mom, the allele2 has to go to his dad.

jonallele1fordad

So that is an easy way to update over 7,000 rows in a few minutes.

Next, On to Mom Patterns

It’s a good thing that I added these mom bases to Jon, because now it is time to look at mom patterns. From Athey:

In the next step, we use the pattern on the mother’s side to fill in as many more cells as possible. Finally, we can project the information in those newly filled cells back to the father’s side using Principle 3 again.

 This procedure will be the same one that I used for the Dad Patterns.
aaab mom pattern
 I might as well go in alphabetical order. In this pattern, Jon will not match the other siblings.
aaabmompattern
This works, but it doesn’t include the areas where there are missing mom bases. So I will use it to get rough ID’s. There were about 45 AAAB Mom Patterns that I found. Perhaps the rough ID’s will do.
AAAB Quality Control

My spreadsheet counts the numbers of ID’s between patterns.

aaabqc

619 is close to the cutoff that I had set. I went back to the original spreadsheet and found other AAAB patterns between the Stop and next Start. So I can combine those 2 AAAB Chromosome 15 patterns. I checked another pattern with about 700 ID’s from the Stop to the next AAAB Start. However, there was another pattern between, so those were a valid Stop and Start. There were about 45 AAAB Mom Patterns or about 2 per chromosome which seems like a lot.

ABAA Mom Pattern

The query should be similar to the previous one. If Sharon isn’t the same as her siblings, we will have an ABAA Pattern.

abaaqpattern

This pattern was easier to figure out. There were about 35 of them.

aaba Mom pattern

This is the one I should have done second if I had wanted to stay in alphabetical order. I checked a few with differences of about 500 between Stop and next Start, but they looked OK. There were a few single allele patterns.

aabb mom pattern

I have 3 criteria for this one:

aabbmompatternquery

I had to enter that Sharon’s allele from mom could not be the same as Heidi’s allele from mom or I would get a lot of AAAA Patterns. When I looked for these, there appear to be 19 AABB maternal patterns.

abab mom pattern

Again, this is a bit out of alphabetical order. This query is not unlike the previous one.

ababq

When I make Heidi’s mom base different from Sharon’s mom base, that gives me the ABAB pattern:

ababresults

Here I have Excel on the left where I am entering the results from the Mom Patterns that I found in Access.

ababworksheet

The jump in Chromosome 4 from position 6M to 37.9M indicates a change in pattern. That is entered in Excel on the left. The change from the previous pattern is shown as 7544 ID’s. ID’s should be the same as SNPs.

A change in Chromosome is an obvious Stop and Start:

ababex

There were about 30 ABAB mom patterns for me and my 3 other siblings. I’ve done:

  • AAAB
  • AABA
  • AABB
  • ABAA
  • ABAB
abbb mom pattern

It looks like this must be the last Mom Pattern. This is the mom pattern where I show my individualism – unlike my siblings who have the same mom base:

abbbq

Here’s an ABBB example:

abbbex

In this case on Chromosome 9, there is a jump from position 38M to 71M. However, the SNP (or ID) count between the two is only 190. That means this must be an area where the SNPs are not counted for some reason, so I would think that I could continue the Mom Pattern through that area. However, when I look at my Access table, I see this:

chr9ex

Above ID 370485 is a different pattern of AABB in the last four columns. This would have come out when I merged all my patterns and I would have had to fix it then. However, I might as well get this as good as I can now. As it is, there will be a discrepancy to work out:

chr9discrepancy

The AABB pattern started at 369193 which is before the ABBB Pattern stopped at 370295. This means I need to go back to the Table:


chr9problem


Here is position 370295 where I had the ABBB Pattern ending. However, this is a a very small pattern, going only up to ID# 370290. Before that is the AABB pattern again. Here the AABB Pattern picks up again.

chr9aabb

Here is how I corrected my Chromosome 9 Mom AABB Pattern:

chr9aabbcorrected

However, note that I had to break my 500 ID/SNP rule. That 51 represents the tiny ABBB Pattern between two AABB Mom Patterns.

Here is the start of the AABB pattern at 369193:

morechr9issues

First note, that it would actually start at 369192. Before that is a single ABBB pattern. Then above that in the first row is an ABAA pattern. The first row is the end of an ABAA Pattern that I already recorded in my spreadsheet at ID# 369181, so that doesn’t need to change:

chr9abaa

At 369190 there is a single pattern of ABBB. This will be noted in my spreadsheet, but not entered as a start/stop position.

Re-Sort the Mom Patterns by Pattern

Now I have 426 lines of Mom Pattern Locations. I need to sort them by pattern and hope there are not many weird issues like I found in Chromosome 9. I will also take out the single patterns. When I do this, I get quite a mess. Here is Chromosome 1:

chr1mompatternsorted

Here we have quite a few nested patterns.

chr1fix

The first AABB pattern is a single, so I can take that out, but what do I do with the AABB Stop? It looks like that was a single also, so I can take that out.

chr1fix2

The AAGG is between a CTTT and an AGG? which would turn out to be an AGGG. What I had previously described was a single pattern going to another single pattern within a valid non-single pattern.

Next, starting at ID# 6608 I have three starts in a row which cannot be good. Looking at the first two patterns of ABAA and AABB, they look like they could be good.

fixchr1

I’ll add a ‘G’ where the cursor is above and call that the end to a very short ABAA Mom Pattern.

chr1fix3

Here is the corrected ABAA stop. I highlighted the next ABAA Stop in yellow as that will need work.

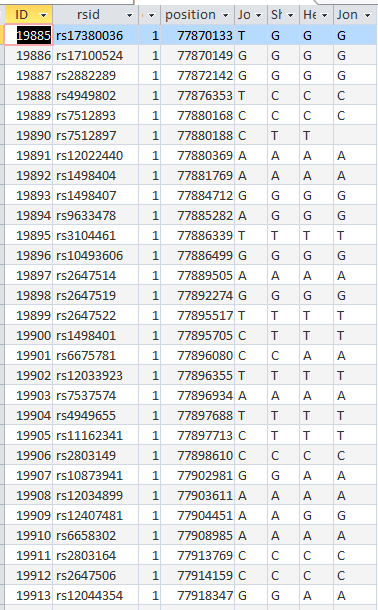
Next I’ll look at the ABBB Start at 19885. It looks like I missed the previous AABB Stop at 19884.

chr1fix4

 At least that makes for a clean cut. I made a note of my correction:
chr1fix5
I also made note to look at the next AABB Stop (in yellow). Now there is a Start for an ABBB followed by a Stop for an AABB which looks fishy. Here is the area following ID# 19885:
chr1table
It seems that there are about 5 ABBB patterns followed by a single AABB Pattern, a single ABBB pattern and another AABB Pattern. As this looks confusing, let’s look at the full table for the single ABBB Pattern area at ID# 19905:
fullspreadsheet

Time for Quality Control

Are there any errors here? Principle 1 says that if a person is homozygous, then one base is from the dad and one is from the mom. I have CC and Jon has TT. My assignment is correct, but Jon is missing a T from his dad.
Let’s look at this Query:
jonqc
This looks for missing Dad bases for Jon that should be there where Jon is homzygous. It turns out he is mising about 1300 results:
jonqcresults
I ran this query to see if Jon was missing any mom bases and he wasn’t. I also ran this query for myself and saw that I was missing dad bases. I will have to re-run this update to the current table. This is not a problem as this is an easy thing to do in Access.

Just Like Starting Over

Based on the errors that I’ve found, I will start from scratch in Part 7

Raw DNA Phasing of 4 Siblings Using One Parent’s DNA: Part 5

In my past 4 Blogs on the topic, I have started the phasing of my siblings raw DNA using my mother’s raw DNA. I used Whit Athey’s applicable paper on the subject, MS Access and have checked my results with the work that M MacNeill’s similar analysis of my raw DNA. I started out using 3 siblings in the analysis. Part way through, my brother’s results came in, so now I am looking at 4 siblings.

I parted a bit with the Whit Athey analysis in that where he went to a visual analysis, I decided to look for the change points in the data. I then used those points to perform an Access query to update the various patterns found. When I left off my last Blog, I had just located Starts and Stops for the 7 different paternal patterns for the 4 siblings.

Sibling Patterns in an Excel Stacked Bar Chart

Today I was getting a headache trying to find a way to put the paternal patterns information into Excel in a Bar Chart. Here is the best I could do for the first 2 Chromosomes:

pattern-bar-chart

The spreadsheet data format is above. I chose Stacked Bar Chart. Then I had to transpose the row and columns. The slight glitch is that I had to create an extra duplicate pattern when that occurred to get the results in one bar per chromosome. I used the end point for each pattern. The bar assumes the start is at zero for each chromosome which isn’t totally accurate, but close enough, I suppose for a bar chart. The bar chart is meant to represent all the paternal changes in patterns for me and my 3 siblings.

When I check the change in patterns to the number of crossovers in the work of M MacNeill, it appears that I have missed a pattern change on each of the above crossovers. Hopefully, I will find them as I go through the process and re-check my work. I guess I’m batting 2 out of 3 now.

Finding the Two Missed Paternal Crossovers

It is possible that they aren’t missing at all. Perhaps in all the work I did to represent the information in an Excel Chart above, I misrepresented the work I had done. Here is my spreadsheet for Chromosome 1:

chr1startstop

Here is what M MacNeill has for Joel, Heidi and Sharon’s paternal Starts and Stops on Chromosome 1:

macneillstartstopchr1

It looks like MacNeill has 6 paternal starts and stops. I don’t count the last one as that goes to the end of the Chromosome. Again, I run into the conversion issue between my Build 37 and MacNeill’s Build 36 work. Here is what happen when I put the approximate crossover locations side by side:

macneill-checkchr1

This shows that we both have 6 crossover, which is good. It gets a bit confusing. Note that I had to add a crossover at my position 23289397. That is because there was a gap. That is the gap where the 4 siblings must match the same paternal grandparent. Normally, there shouldn’t be any gap between the Stop from one pattern and the Start of the next one. So it turns out I’m doing better than I thought. That is encouraging to know. For the last pattern, I don’t have an entry, because the crossover is at the same spot as the Stop of the previous pattern.

However, I am comparing my 4 sibling work to MacNeill’s 3 sibling. Also MacNeill had a start of 742429 and mine was higher. That means that there must be a pattern between 742,429 and 1,062,638. I checked, and there aren’t many extra locations there. I suppose I did as well as I could do. I do wonder where Jon’s Chromosome 1 crossovers are, though. Perhaps he has a double crossover with another sibling or one that is very close in location to another sibling.

Gedmatch Check

Here is how my 3 tested siblings and I look compared to each other at Gedmatch in the browser:

chr1-4sibs

The lines don’t match up perfectly, but I have for 3 crossovers for Sharon in a row. I am J, my brother Jon is F and only has one crossover of his own. These are the combined paternal/maternal crossovers. When I map it out using a visual method, it appears that Jon may have no recombination in Chromosome 1.

jonvisphasechr1

If that is true, it would make him a good candidate for finding Frazer or Lentz relatives at Chromosome 1.

assigning Paternal crossovers for Chromosome 1

Assigning crossovers is getting a little ahead of myself, but I would like to see if I am on the right track.

assignxoverchr1

Here the Dad4Pattern represents Joel, Sharon, Heidi and Jon. There appears to be a logic to assigning these crossovers that I have in the XSib column. The first crossover I have going to Sharon. That is between the first Stop and the second Start. Sharon’s B in ABAA goes to an A in the AAAA homozygous region. That means all siblings match the same paternal grandparent in this region. The next crossover goes to me as I’m represented by the A in the ABBB pattern. The 3 other siblings remain matched to each other. Then Heidi gets the next crossover as she goes from matching Sharon and Jon to matching me. The next to the last crossover, I had as Jon. But it has to be Heidi as she went from matching me and Sharon to matching Jon. If Jon was the one that changed to matching Heidi, the pattern would have gone to AAAA. Likewise, the last crossover I had as Heidi, but it has to be Joel. I went from matching Sharon to matching Heidi and Jon.

There are a few cross checks to the method. One is to check to see what MacNeill has done. Another way is to check to see known matches. I noticed above that Jon had matches to known matches on my paternal grandmother on either side of the wrong crossover that I had assigned to him, so that was likely not a good crossover. Another note is that there is a least one other homozygous region. That is between the 191M stop and 192M start above. That means that there should be an AAAA pattern stuck in there, but it is not necessary to know at this stage.

Time to Push the Button: Back to Phasing by MS Access

A lot of the above work was to make sure that I had the right number of crossovers in the right places. I was worried that if I didn’t, that I wouldn’t be applying the right rules to the right areas of the spreadsheets.

First aAAB

Here are my AAAB paternal Patterns with start and stop in Access language:

aaabstartstop

Here are some examples of fixes that are needed within these AAAB areas:

aaabexample

Basically, if there is a blank in the first 3 positions, it should be filled in by the non-blank in that area. But how do I write that into a formula? Here is one way:

update

This says if Joel’s Dad base or Heidi’s Dad base is null, put Sharon’s value in. I ran that and it updated 2165 rows.

Next:

aaabfillin


This time only about 1400 rows were updated. The last time we fill in Heidi’s value if Joel or Sharon had a missing Dad base.

407rows

I’ll check my work. I see a flaw in my logic already. I shouldn’t have put the 2 ‘Is not null’s’ on the same line and Access sees that as an and. I wanted an ‘OR’, so they should’ve been on separate lines. Here is the revised query putting Heidi’s Dad base in the empty spot of Sharon and Joel.

aaabrev


Note that I had to put the position criteria for the Paternal Patterns in twice also. See, I had missed 4121 rows. I went through this with the 2 other siblings.

AAbA Paternal pattern

aabappatternstartstop

The AABA also has potential for filling in.

aabaexample

In the first line there is ?T??. In and AABA pattern, we know that the first and last position will also need to be T. In the second line, we don’t know what to fill in. In the 3rd line we can put a C in the last column.

My ID locations for AABA look like this:

idsaaba

The queries will be similar to last time except that they will involve Joel, Sharon and Jon and leave out Heidi.

aabaqueryfillin

This was a more popular fill-in. In the query above, if I had a Dad Base and Sharon and Jon didn’t it went to Sharon or Jon. I then did the same thing for Sharon and Jon. Here I check my results.

checkaaba

These are the same ID Lines shown as above before I did the query. This now shows that Joel, Sharon and Jon have the same bases for this AABA Pattern. This is even true when we don’t know the base Heidi has on her paternal side as in the first row.

aabb pattern

aabbpattern

Here is what an AABB Pattern area looks like before I fill in the bases:

aabbpatternarea

The rule is if Joel or Sharon or Heidi or Jon have one base and the other is missing, fill in the missing one with the one that is there. However, as in the second row, where Heidi and Jon are both missing, nothing may be filled in. This will take a little thought. Perhaps I can do this in 2 steps:

aabbfillinquery

This says if I have a base AND Sharon doesn’t, give her my base, then also do the same and fill in Heidi’s base to Jon’s missing base from dad. This query filled in a little less than 20,000 bases with the push of a Run button. Then I’ll do the opposite:

aabbquery2

This time Sharon’s base goes to me and Jon’s goes to Heidi. I’ll check good old ID 45494.

aabbcheck

It looks like I filled in what I wanted to and didn’t fill in what should not have been filled in.

The other combinations will be variations on what has just been done. Either 3 will match each other and one won’t or there will be 2 pairs that match each other within the pair.

abaa Fill-in

This is the first pattern of my siblings’ 1st Chromosome.

abaaquery

Another ho-hum 20,000 rows filled in.

Here Heidi fills in Joel and Jon:

abaa2

The updated rows go down the 3rd time I run this.

abaa3

abab Dad pattern

This will be where Joel and Heidi match paternally and Sharon and Jon match.

ababquery

Jon is probably missing a lot of bases due to being tested on with the Ancestry Version 2.

ababq2

abba

abbaq1

This query says in the ID areas where there is an ABBA pattern put Jon’s dad base into Joel’s missing dad base area and put Heidi’s dad base into Sharon’s missing dad base area in the table called tbl4SibsPPatternFillin.

joelsharonabba

Here, I made a mistake. Note that I had Access overwrite a bracket “]” that didn’t get erased. That means that I will have to run this query again to get my bases back from Jon. Here is what the above Update Query did.

mistake

Fortunately, Jon still has the bases that I gave him. I’ll redo the query to get my bases back.

fixqurey

This query will fix my error. It says if I have an end bracket as a base, fill it up with what Jon has.

fixresults

abbb – the last paternal combo

This time I won’t touch my bases, but make sure that Sharon, Heidi and Jon match.

abbbq1

heidiabbb

jonabbb

So that should have filled in all the paternal patterns.

Finding the AAAA ‘Patterns’

This should be a little trickier. Previously, we had identified one AAAA pattern in Chromosome 1. This can be seen between 19 and 23 below. All the paternal areas are orange.

jonvisphasechr1

There is no other area on this Chromosome that is all orange or all green for all siblings. However, how do I identify all the other quadruple A patterns? It is not as easy as the other patterns because this pattern may occur within other patterns. I could make a chromosome map for each chromosome as above, however, it becomes a chicken and egg problem. It would be nice to know the AAAA areas so I could draw the map.

Here is a spreadsheet where I checked the number of IDs from the Start to the previous Stop.

startminusstop

When the amount was more that 500 IDs, I highlighted that number in yellow. Above between the Stop of ABAA and the Start of ABBB on Chromosome 1, there was an AAAA pattern for 1478 position numbers.

The next yellow area is in Chromosome 2 which is a larger region of AAAA
pattern.

Here is an interesting situation:

chr6and7

This yellow area is above the amount I chose as a minimum of 500 positions. However, as I look at my worksheet, I see that the ABBA pattern extends beyond ID# 285124. So I will do a new query based on the new fill-in table. Here is the new ABBA:

newabba

newabbaresults

This shows that the ABBA pattern goes to the end of Chromosome 6. I can fill in the extra letters by hand and adjust my spreadsheet.

However, what about Chromosome 7?

Chromosome 7 appears to have an AAAA pattern for about 847 ID#’s. This is how MacNeill mapped my Chromosome 7.

chr7macneill

He would have the ABBB Paternal Pattern with me being the A. This is how I had visually mapped Chromosome 7:

chr7joel

These end pieces are difficult where there is a half identical region. I will stick with my as I do notice a small match with my Hartley-related 2nd cousin Pat:

chr7joelpat

This may become more clear once my brother Jon is mapped out. In fact Jon is Fully Identical with me in that region:

jonjoelchr7

Jon also matches cousin Pat in that same spot:

jonjoelchr7pat

Ergo, I must match Pat aka Hartley DNA at the first part of Chromosome 7.

Here is Jon mapped out no Chromosome 7:

chr7vismapjon

Jon (F) and Heidi (H) got a full dose of Hartley DNA at Chromosome 7.

That was a bit of a long exercise, but the intention was to prove to myself that an AAAA pattern of over 500 positions (or my ID#s) is a valid AAAA Pattern.

Filling in the aaaa’s

As I have now convinced myself that this small area was indeed an AAAA area, I can proceed. I made a formula in Excel that takes the other Patterns’ Stops and Starts and puts them into Access language.

aaaagaps

The formula adds an ID# to the beginning and subtracts one from the end so the AAAA patterns have their own range.


Inspecting my work

Having found a pattern boundary that was off at the end of Chromosome 6, I will check the other boundaries. According to my spreadsheet, the first AAAA should end at 6604.

aaaaspreadsheetchrq1

The actual Access Data table is different by one:

chr1correction

That mean that the I need to add an ‘A’ to the missing space and change the start of the ABBB Pattern from 6605 to 6604 – a pretty minor change. I made a few more minor changes. However, I’ll hold off on making the AAAA pattern changes for now. That is in case the boundary changes again due to other changes I’ll be making.

Filling In Mom Bases From Dad Bases

This is about how far I got last time when I was trying to phase 3 siblings. My interpretation of this portion of the process is to look at the heterozygous siblings. Where they have a new base on the Dad side, they will know that the other base goes on the Mom side.

Finding heterozygous siblings

First I made a new table to put the new information in. It is just a copy of my last table of the fill-ins based on patterns. Here is a query just to find the alleles for each sibling that are different from each other:

heterozgous4sibs

Here is the Update Query. I better get it right as it is doing a lot of things:

updatemomfromdad4sibs

The first part has the criteria that makes a person heterozygous. I forgot to make sure that the mom base was missing, so I need to add an ‘is null’ phrase:

4sibheteromomfromdadrev

This may not be necessary, but just makes sure I am not overwriting anything that is already there. So when mom’s base is missing add the base that isn’t the dad base. Or more specifically, add allele2. This changes 39,260 rows.

Next to get the opposite effect, I change most of the alleles 1’s to 2’s and the 2’s to 1’s.

otherallelemomfromdad4sib

That changed over 10% of all the results. To check, here is a query from the older un-updated table showing just my results where I’m heterozygous and my allele1 was from Dad:

qryoldtable

Here is the updated table.

updatedtablemomfromdad

The G, C, C, G was added as a base from my mom – along with 10’s of thousands of other bases.

Summary

In overview:

  • Principal 1: I’ve added the homozygous sibling results. This says a double base for a sibling means that they got the same base for each parent.
  • Principal 2: I forgot to add the homozygous mom results to Jon. I’ll do that in the next Blog
  • Principal 3: This is for heterozygous siblings. When one base is known for a parent and the other parent base is missing, the other base is assigned to the other parent
  • Next I looked at the paternal patterns and made note of where they changed
  • For each paternal pattern region I filled in the bases that could be filled in based on that pattern
  • Then based on that new information, I filled in more missing mom bases from the dad bases in areas where the children were homozygous. This is Principal 3 reapplied.


Using Triangulation Groups to Map My Wife’s Chromosomes

I would like to update the Chromosome Map I have for my wife. The one I have now looks like this:

marie-cmap-old

This map is based on programming by Kitty Munson Cooper. It doesn’t look too bad. It only has 3 colors: 2 blue colors for her dad’s side and one color for her mom’s side. The red is based on the results from her 1/2 great Aunt. The blue is based on paternal grandmother cousins.

Here is Marie’s family of DNA tested relatives:

marie-relationship

From bottom left to right we have the following that have had their DNA tested:

  • Fred, Fred’s sister
  • Pat, Buddy
  • 1st cousin John
  • 2 Paternal Aunts
  • Dad and Mom
  • Aunt Esther
  • In addition I have results from a Dicks DNA study

The Rule of 1st Cousin, 2nd Cousin Combo

In my previous blog, looking at my mother’s side DNA, I came up with a rule. That rule said:

In a triangulation group between a person’s 1st cousin and a second cousin, the second cousin will be able to identify which grandparent the 1st cousins share.

I would like to apply this rule to my wife Marie as she has 1 first cousin and 2 aunts who have tested their DNA. These 3 are like cousins as the common ancestor of grandparent are the same. Marie also has 2 first cousins once removed tested. These would be similar to 2nd cousins as they both have great grandparents in common.

mariepaternalrelationships

Basically, right now if Marie compares herself to John or her 2 Aunts Lorraine and Virginia, she doesn’t know if the shared DNA is from Estelle LeFevre or Edward Butler. However, a triangulation group (TG) with Fred, Fred’s sister, Pat or Buddy and John, Lorraine or Virginia, will show that DNA to be from Estelle LeFevre. Further, not just the match in common to the TG will be from Estelle, but the entire segment represented by Marie’s match to John or her 2 Aunts will be from Estelle.

That’s My Theory, Let’s Try It Out

I have a boatload of combinations to try this theory out on. First, I’ll go with Fred, Fred’s sister, John, Marie and her 2 aunts. First I go to Marie’s one to many menu at Gedmatch and I choose Marie’s relatives I just mentioned. Then I choose the Matching Segment CSV. This downloads a file of all the matches between these 4 people, making it easy to find TGs. I could have used the Chromosome Browser but that only hints at TGs. However, I will use the Chromosome Browser to focus my search.

Chromosome 14 example

chr20ex

The browser show’s Marie’s matches to:

  1. Aunt Lorraine
  2. Cousin Pat
  3. Cousin Buddy
  4. Aunt Virginia

Here is how I have the Triangulation Group (TG) beween these 5 mapped out:

patbuddytg

This shows a Triangulation Group (TG) between Pat, Buddy, Aunt Lorraine. Aunt Virginia and Marie.

Now a few observations:

  • The chromosome browser view above is from Marie’s point of view
  • Marie’s matches with Pat or Buddy (#2 and #3 on the browser) represent the DNA they share from either Martin LeFevre or Emma Pouliot. It is also likely that one segment is shared from each of Marie’s great grandparents.
  • These segments are represented in the Kitty Munson Cooper Chromosome Map at the top of this Blog.
  • The long segment shared between Marie and her Aunt Lorraine is from one of Marie’s grandparents. Because Pat and Buddy also match Aunt Lorraine, we may say for sure that the segment Aunt Lorraine shares with Marie must have come from Aunt Lorraine’s mother Estelle LeFevre.
  • Marie’s DNA she got from her grandmother Estelle is shown below.

munsonmaprev

The previous map had 2 blue segments on Chromosome 20 representing either of Marie’s paternal grandmother’s parents. We didn’t know which. Now it shows the one large segment taking up all of Chromosome 20 from her known paternal grandmother. The green should say Estelle LeFevre b. 1904 – not Emma Pouliot b. 1894.

chromosome 15

On Chromosome 15 here are the same people, but in the following order: Aunts Lorraine and Virginia, Pat and Buddy.

mariechr15

kittymarie15

Interestingly, this time the program doesn’t overwrite the light blue. This is because the match for the light blue extends further than the match for the green. When I mouse-over the original map, it shows that the light blue match starts at about position 34 while the green match starts at about 35. Because of this, the entire blue match shows until it’s end and then the green match is shown.

This blue, light blue, green progression represents 3 generations of Marie’s ancestors on her paternal grandmother’s side.

Paternal Grandmother Results Using 1st Cousins, Once Removed

Here are the results of comparing Marie’s cousin and two aunts to her two 1st cousins, once removed. Here I correctly have Estelle LeFevre  b.1905 labeled for the green areas.

mariepatbuddychromomap


I didn’t bother doing the comparison for Marie’s X Chromosome. The reason is this. The X Chromosome that her dad gave to her, he got from his mom. That means that the green must extend for the whole X Chromosome. For that matter, the light blue would also be Marie’s paternal grandmother’s parents.

How to Identify Emma Pouliot?

That seemed to work well for Estelle, but is it possible to be go back one generation further and identify one of Marie’s great grandparents by DNA? I think so. Let’s take a look. This time, I don’t want to look at Marie’s 1st cousin John or her 2 aunts. The reason for that is that when I compare Marie to those 3 people, the common ancestor would be Marie’s grandparents. I want to compare Marie to her 2 first cousins, once removed to find her great grandparents – or in this case her paternal grandmother’s mother Emma Pouliot b. 1874 in the Province of Quebec.

tgchr1

We are using the same principle as before, but going one rung up the ladder. I will look for a Triangulation Group (TG) between Fred, Fred’s sister, Pat, Buddy and Marie. Once I find that TG, I will take the DNA match between Pat or Buddy and Marie and assign that DNA match to Emma Pouliot.

Chromosome 1

Let’s try this out on Chromosome 1:

pouliotlefevrechr1

  1. Fred’s sister (2C,1R)
  2. Fred (2C,1R)
  3. Pat (1C, 1R)
  4. Buddy (1C, 1R)

It looks like there should be an overlap between #1 and #3, but they have no match there in the middle of the Chromosome. However, on the right side, there is a match between #1 and #3. Using my plan, I’ll assign Emma Pouliot to the green segment. In this case, #1 and #2 representing the parents of Emma Pouliot are larger. It would stand to reason that these would belong to Emma also. However, for consistency, I will just map Emma to the green segment.

When I tried to map this using the Kitty Chromosome Mapper, it didn’t show up as Estelle had already filled up that slot.

Chromosome 2

chr2buddyfred

This time the two 1C’s, 1R are on the top and the smaller segments representing Marie’s two 2C’s, 1R are on the bottom. Is there a TG? I lowered the gedmatch thresholds, which I didn’t do for the first part of this Blog. Here is the match between the 1C, 1R and the 2C, 1R:

gedmatchchr23

They match on Chromosome 2, but a little below the 7 cM threshold. I’m not worried as I’ve read that in a TG a match is likely to be good down to 5 cM. That means that I will map Pat’s #1 green segment to Emma.

Unfortunately Estelle is taking up the space where Emma would be mapped on Kitty’s Mapper. This seems to be a trend.

Chromosome 13

I did the same exercise as above and mapped with no results. This time I took out the other references in the area of Chromosome 13 that were blocking Emma and got this:

emmachr13

Now we see Emma’s DNA in lighter green on Chromosome 13. The downside was that I took out some of Estelle’s DNA to the right of the light green area so Emma’s DNA match with Marie would show. Hey, I created this map; I can do what I want with it.

So that is what I found. My wife can claim hold to a lot of her grandmother’s DNA, but only 3 identified segments of her great grandmother’s DNA based on this procedure. Of course, one may say that every instance of finding the parents of Emma would be the same as Emma. Based on that idea, I’ll try another map.

emmaestelle-map

This map isn’t really any better, it is just meant to show that whether you have the parents or the child, it fills up the same area on the map. Note I have the same problem here where Estelle fills up the older Emma DNA on Chromosomes 1, 2, and 13.

Marie’s Dicks DNA

The idea for this section should be more straightforward. I have been involved with a Newfoundland Dicks DNA project. There are many people who have tested their DNA and found through triangulation to be likely related to the Newfoundland Dicks family. For example, here is a list of the Dicks Triangulation Groups (TGs):

Dicks TG Summary

These include the Dicks TGs except for the most recent few. Joan is near the middle of the chart. She is my wife’s mother. All I have to do is see if Marie is in any of the same TGs that her mother is in. Then I can take the match with the other 2 from the TG and assign that DNA to the appropriate Dicks ancestors.

Here is what was added (in yellow):

mariechromomap

All that was added was a probable Dicks segment on Chromosome 2. There were other Dicks segments but they were “behind” Upshall matches. That means that they are the ancestor of Frederick Upshall. The reason that the Chromosome 2 match stood out was that it was a match with Joan (Marie’s mom) and not with Marie’s great Aunt Esther (represented in red above).

Check Your Work

Fortunately, M MacNeill [prairielad_genealogy@hotmail.com] has looked at my wife’s family’s Chromosome 1. He has looked at the raw DNA which is more under the hood than what I am doing. Here is a small portion of his work. He phased Marie’s father and 2 aunts and then went back and put that information into Marie’s DNA.

macneillchr1marie

The interesting thing about MacNeill’s map is that it includes the DNA for Marie’s 4 paternal great grandparents. The cross-hatched area is where it was not possible to determine the crossover point. At any rate, MacNeill points out some errors in my Chromosome mapping for Marie. He has sections of salmon or pink indicating Richard’s paternal grandparents where I have Marie mapped to Richard’s maternal side.

This is when I go back to my spreadsheet for the details:

mariechr1notg

In the first part of Chromosome 1, it is clear that Marie does not match Pat, Buddy, Fred, or Fred’s sister, so I cannot call that a TG or a Paternal grandmother match for Marie. My original rule said that Marie had to be in a TG for my segment extending plan to work.

Here is where I removed 2 paternal grandmother segments on Chromosome 1:

mariechr1rev

However, on the right of Chromosome 1,  MacNeill has more paternal grandfather DNA mapped where I again have paternal grandmother. In my defense, this was an area where, according to MacNeill, Fred and Fred’s sister appear to match on both the paternal grandmother and grandfather side. I couldn’t have known that as I only had information for the paternal grandmother side.

One other point on Emma pouliot

emmaphoto

Above, I had mapped Emma Pouliot to Marie on Chromosome 1:

emmamappedsegments

Here is a larger view of what MacNeill had for Marie’s family’s Chromosome 1:

richard-chr1

The legend on the top line is difficult to read, but Pouliot is the darker red. More specifically, that would be Emma Pouliot. Marie is on the bottom line. The last vertical white line in Marie’s dark red area represents position 198. As I had mapped Emma from 197 to 207, that would put her in the end of the dark red area of Richard’s Pouliot maternal grandmother, before Marie’s DNA switches to the DNA she got from her dad’s paternal side in the salmon color. So at least my work agrees with MacNeill in this little area.

Summary and Conclusion

  • Most of the additional segments came by phasing the unknown grandparent using the 1st cousins’, once removed shared DNA
  • This method could work well along with the visual chromosome mapping that Kathy Johnston developed.
  • There is a fine distinction with mapping the DNA of one’s known grandparent and mapping the DNA of the parents of that known grandparent. When mapping to the parents, the individual segments could be from either parent. When mapping to the known grandparent, that larger segment could contain compound segments of the parents. It is a subtle distinction, but one that should be maintained in my opinion for future research.
  • Using the Kitty Mapping tool is fun and instructive as to how DNA works. It can be manipulated to show what one would like to be shown. For example, when I wanted to highlight the Emma Pouliot segment, I was able to do that.
  • Even with no paternal and maternal grandfather DNA matches for Marie, I have been able to fill out her Chromosome map quite a bit – mostly on her paternal grandmother side.

Raw Data Phasing Part 4: Going from 3 Siblings to 4

In my last Blog, I mentioned that my brother Jon’s DNA test results came in this week. This happened in the middle of my attempt learn how to phase the raw DNA data for my 2 sisters and myself. I was phasing the data in what I can only assume is a traditional way. I say I assume, as I haven’t seen any other blogs on the process. The difference is that I am using MS Access which I hope will speed up the process. I should be able to get results for 23 chromosomes at a time instead of just one at a time.

The arrival of the new DNA results poses at least two problems:

  • The previous 4 DNA data files were all in AncestryDNA version 1. Jon’s is in AncestryDNA2. While they are all Build 37, they look at somewhat different points on the chromosomes
  • One of the difficult parts of the previous process was identifying and dealing with patterns of phased paternal and maternal bases. Those patterns were AAB, AAB, and ABB. With 4 siblings, there will be more patterns. However, the Whit Athey Paper I have been following does also look at 4 siblings.

AncestestryDNA Version 1 Vs. AncestryDNA Version 2

My understanding is that Ancestry changed the locations on the chromosomes that they were testing to get more into the medical area like 23andme. I don’t know if that is true. Here is a chart comparing the different atDNA tests:

ancestrydna-compared

I was doing well comparing Anc1 with Anc1 as I was looking at over 700,000 base pairs among 4 people. Once I compare Anc2 to Anc1, that is number is cut down quite a bit. That is about a 40% drop. My only other option, other than re-testing Jon, is to compare Jon to my mother’s FTDNA results. However, that will only pick up 2-3,000 SNPs, so I won’t bother.

Back to Square One with 4 Siblings: Homozygous Siblings

I need to find Jon’s equal base pairs and apply one to his ‘from dad’ column and one to his ‘from mom’ column. That is, after I add all Jon’s data to my database and add those columns. First I need to decide where to add Jon’s data. I could add it to the beginning of what I have already done or to the end. I’ll try adding it to the end, because I think that the work I did already is OK. I want to build on that. So rather than adding Jon’s DNA to the first step, I’ll add it to my table called tblMomBaseFromDadBase. This table has over 700,000 lines of bases for 4 people. Jon’s has 668,942 lines. Actually, when I remove “Chromosomes” 24-26, I will only have 666,531 lines.

Querying Jon into my latest table

Here I am adding Jon and the Mom from Dad Table to my query design:

adding-jon

Access thinks the ID that it added was important, but it really isn’t, so I need to take out that equal join. I really want the join to be at the rsid, but I don’t want an equal join. Why not? If I had an equal join, I would end up only with the positions that Jon has. I will lose 40% of the work that I have already done. Instead, I’ll use an unequal join.

unequal-join

I flipped the 2 tables in the query design area, so things are moving left to right. Then I choose a #2 join which is basically, an unequal join left to right.

Actually, I changed my mind. I have a better idea. I will just do the first 2 steps on Jon’s raw DNA and then join the results together. That is a third way that I hadn’t thought of. The point is, that there are many ways to do things in Access. There can be more than one way to get to where you want to be.

Back to Homozygous Siblings

First I copied Jon’s raw data into a table called tblJonHeterozygousSib. This is so I can use an update query to update the data in the new table and still have the original. Hold that idea. The better idea is to use a make table query. The reason that this is better is that it can take out the “chromosomes” I don’t want:

make-table-query-jon

I took out the table I copied and I’ll make a better one with only Chromosomes 1-23. I hit the Run button and create a table with 666,000 lines:

jonhomosib

Then in the above table, I inserted 2 rows: JonFromDad and JonFromMom. Now this table is ready to phase for any homozygous siblings. By the way, it looks like my Chr23 or X is homozygous, but it isn’t. Ancestry adds an extra base. I only really have one for my X Chromosome.

Finally time to query and phase

I go to Query Design in Access and choose the above table. This is a very simple Update Query design:

qrysibhomojon

This says if Jon’s allele1 is the same as his allele 2, put allele 2 as his base from mom and as his base from dad. I hit the run button for the update and get the dire warning that I’m updating a lot of information, I can never change it back. Then I get a message that I’m updating 478,000+ rows. That is good. Those are the number of Jon’s homozygous bases – quite a few. I’d say over two thirds.

I’m not looking for crazy results and didn’t get any.

Homozygous Mom Query

I’ll copy my previous table into one to update. Then I need to add Jon’s base from mom where mom is homozygous. Easy peasy. I think this is all I need.

momhomoupdatequery

Actually, I did think of an issue. I have an equal join. That means I won’t be using the homozygous bases that mom tested for in the old AncestryDNA test that aren’t in the new AncestryDNA test list. My guess is that is interesting information but perhaps not very useful. It also occurs to me that in the spots where Jon doesn’t match up with my siblings, I will still have the 3 letter pattern work that I had done previously.

The query above says if Mom allele 1 = 2, then put that 2 allele in Jon’s from Mom base slot. I hit Run and pasted 277,000 rows of bases.

homomomforjonresults

This query will be a little more difficult to check. I have to create a query linking my mom’s DNA results to this table. I did that and see one problem already.

momrawtojonfrommom

The first problem is that ID 126 didn’t show up. That means that rs3819001 that Jon has is not in my mom’s raw DNA. I don’t want to have data for Jon that looks like it can be updated, but it can’t.

I think I can fix this.

Updated Table Query

A few steps ago, I ran a Table Query to get just Chromosomes 1-23 into Jon’s Table. I need to upgrade that query so that I am only including the locations (rsid’s) that are common to both my mother and Jon. I do this using an equal join on the rsid Field:

updatedtablequeryforjon

This time, my table for Jon only has the rsid’s that my mom has.

newtable-upda

Also my Chromosome formula was off, so I had to fix it. Also note that I have about the number of rows as per my Anc1 vs. Anc2 table earlier in the Blog. I then re-added the Jon from Dad and Mom columns into the new and improved table. Then I reran the update query which told me I was about to update 284,000+ rows.

homozgygousjonupdate

This worked as well as last time, but this time I have the fewer rows I was trying to get.

Re-Run the update query for homozygous mom for jon

I double clicked on my old update query. The message said I was updating 277,000 rows or so. Now I’ll re-check my work. If there is no ID 126, I’ll be happy. Well it is still there, because I forgot to copy the previous homozygous sibling table into the homozygous mom table. After re-re-running the update, I got the desired results:

tableno126

And there you [don’t] have it: no ID 126. Here is my mom’s raw file compared to Jon’s updated table.

momrawtojonfrommom

Jon gets a G from mom at ID 128 even though Jon is AG, because mom is GG. Now I’m talking DNA.

Merge Jon’s New Table with His 3 Siblings’ Tables

This is the point where I put everything together. I will try to use the Make Table Query for this one again. So I’ll put my newest Jon table together with my newest sibling table.

left-to-right-merge

This shows the left to right arrow join. I’ll want the larger file plus everything equal in the smaller file. Come to think of it, this Create Table Query would have fixed the earlier problem I had. I guess I was too careful! The other issue is that the ID in the 1st table won’t be the ID in the second table. I could keep the second ID, but I would have to rename it as Jon ID or Anc2ID.

newidtablemerge


Here I rename Jon’s IDs as JonID. I may not need it, but if I do need it I will have it. I guess MS Access wasn’t happy with my idea:

autonumber

OK, I took out the JonID and hit Run. Microsoft tells me about my new 700,000 row table.

Back to the Dad Patterns

Now that all the family is together I want to look at Dad Patterns, because I know that I will be updating those. Here is the first query I tried on my new Table of 4Sibs.

sharon-not-joel

This is looking for filled in Dad bases where Sharon’s base is not the same as Joel’s. That query gives me an ABAA pattern:

abaa-pattern

Also ABBB:

abbb

Here’s ABBA:

abba

It looks like ABAB is a possibility also. That means the following are possible:

  • AAAB
  • AABA
  • AABB
  • ABAA
  • ABAB
  • ABBA
  • ABBB

So if I chose Joel’s Base not equal to Sharon and then Joel’s base equal to Sharon would I have every combination? It looks like I need this combination to cover all possibilities:

  • Joel <> Sharon OR
  • Joel<>Heidi OR
  • Sharion<>Heidi OR
  • Heidi<>Jon OR
  • Jon<>Joel OR
  • Jon<>Sharon OR

Which in Access looks like:

access-pattern-combos

But Wait, I Forgot Principle 3 for Jon

Principle 3 says where Jon is heterozygous and he knows where he got his maternal base, the other base goes into his From Dad column. Looking back at my old queries, I see this is a 2 step query. I’m tempted to try this in one step, but I think  this got me in trouble before, so I’ll go with the simpler query. Simpler queries are usually better in MS Access.

jonhetero

This says where Jon is missing a phased allele from Dad and he has an allele that doesn’t equal the one he got from mom (making Jon heterozygous here) put that allele into Jon’s From Dad spot. I tried the query and only got 37 results. The problem is, I should have said ‘Is Null’ in the JonFromDad Criteria:

jonheteroisnull

This time I get 35,000 updates, so that is right. I then change the allele1’s to allele2’s above and get 33,000 updates to tbl4Sibs. I ran a quick query on the 4Sibs Table to get just Jons heterozygous results:

jonheterocheck

In the first line, Jon had allele1 as T which was different from the allele from Mom of G, so Jon’s T got put into the From Dad spot. At ID 41, Jon’s allele2 of G is from Dad because he had an A from Mom. When parent and child are heterozygous, the From Parent location remains blank.

Now I have Jon with 3 Principals: Homozygous Jon, Homozygous Mom and Heterozygous Jon.

Back to Dad Patterns

I have the old Dad Patterns for 3 siblings. Now I need to See what the 4 sibling Dad Patterns would be and add Jon’s Start and Stop Locations for his new Dad Pattern Areas. I need to combine that with the 3Sibs Table.

wrongpattern-query

My first query was wrong and gave bad results. The reason is that the ID for 4Sibs was from the raw data. The ID for the Dad Pattern Table just numbered the amount of Dad patterns. I needed to join the ID in the first table to the start and stop locations in the second table. I ended up doing 2 queries: one for the start position and one for the stop as I needed both. This query gives the stop position of a pattern.

stop-query

I took both those queries and put them into an Excel Spreadsheet.

excelstartstopfromaccessdad

I added a new column called Dad4Pattern. In the first row, the new pattern was AAA by chance. However, in the second row which is the Stop or End of the first Dad Pattern, it is obvious that the ABA Dad Pattern goes to an ABAA Pattern. I didn’t think that there would be many AAAA Patterns as that means that all siblings match the same Paternal grandparent. This is the only AAA pattern that I had noted so far as I wasn’t looking for them yet. Still, I will need to go back and verify that these Start and Stop AAAA’s were not by chance. Finally, on the last line, it is clear that the Dad Pattern goes from AAB to AABB with Jon added.

Next I chose all the cells where Jon had a base from Dad and performed a Concatenate operation to write the pattern.

concaternate

This gave me the CCCC that I wanted to check. Next, I wrote a formula to put the Dad bases together in a new column and wrote down the Dad Patterns that I had.

newdadpattern

A few notes:

  • Out of the 66 three sibling patterns that I had, I was able to find all but 5 new four sibling Dad Patterns. See the yellow above for two of the missing 4 sibling dad patterns.
  • The missing 4 sibling dad patterns should be easy to find by scrolling through the 4Sib Table
  • I noticed that there were no AAAB patterns. That is because in my previous search, I was not looking for AAA patterns. So now, I don’t have any AAAB patterns. I will have to find these in my new search.
  • AAAB is the situation where I match the same paternal grandparent as my 2 sisters, but Jon matches the other paternal grandparent.
Filling in more dad patterns

To fill in the yellow areas, I made a query in Access based on the 4Sibs Table. This looked at every case where Jon had a base from Dad. Searching around the ID 6604 and after, I found this pattern:

fill-in-patterns

ABBB

Then I checked near the end of the old 3 sibling pattern which is at ID 19806.

break-point

At ID 19827 we see an ABAB Pattern, so I enter that Pattern in my spreadsheet:

newpattern4

For the start of the new ABAB pattern, I used the old ABA location as that was more precise. The next interesting thing happens at Chromosome 2:

chr2

Here I have a problem in my spreadsheet. For some reason, the Start of the last pattern of Chromosome 2 ends at Chromsome 3, which is not right. My previous spreadsheet was better than that. From the ashes I will re-build.

I note that at ID 108798, my 4 Sib Spreadsheet goes to an ABAB Pattern. At the end of Chromosome 2, I see an AAAB Pattern. That was the one I wouldn’t have had from the 3 sibling pattern as I wasn’t checking on AAA’s.

I added new rows for the patterns ABAB and AAAB:

addnewrows

The most important thing here is the ID, the pattern, the Start and Stop. Here is the new change area from ABAB to AAAB:

chr2change

There are a few SNPs between the ABAB Stop and the AAAB Start that are a little unclear.

end-of-2

Finding Jon’s Patterns

Now I’ll check Jon’s Patterns. I’m looking for any changes in patterns as these should be important as crossovers later. I will need to assign the crossovers to each sibling’s Chromosome Map.

Good Old Triple A – B Pattern and all the others

AAAB is where Jon has a different paternal grandparent than his 3 tested siblings and the 3 siblings have the same paternal grandparent.

aaabquery

My query says that Jon has to be different from each sibling. I run that and insert the appropriate Start and Stop point for the AAAB in my spreadsheet.

I do the same for AABA which I can find using a similar query under Heidi’s criteria:

aaba-query

I ended up going to a clean spreadsheet. It was too messy combining the 4 sibling results with the old 3 sibling results.

4sibpatterns

Here I have the ID, the Chromosome, the pattern and the Start and Stop. The yellow marks a one SNP pattern. It appears that there should be 3 types of patterns:

  1. One where one sibling matches none of the others. That is what I have above: AAAB, ABAA, AABA and BAAA
  2. One where 2 pairs of siblings match each other: AABB or ABBA. I’m not sure what else there could be. I looked above and saw one other: ABAB
  3. One where all the siblings match each other: AAAA

That makes 7 or 8 patterns, depending on whether AAAA is considered a pattern.

Two Pairs of siblings match each other patterns

Here is the Access query for AABB

aabb-query

At first I was missing the criteria under SharonFromDad and that gave me AAAA combinations also. The result of the query looks like this:

aabb-results

Here Joel matches Sharon and Heidi matches Jon but on a different base. After I was finished putting in Starts and Stops for each Pattern, I then sorted my spreadsheet by ID. This brings up some issues that need looking at:

quality-control

Where there are 2 Starts or Stops in a row, there is a need to check what is going on. The ones around the yellow positions may not be a problem as I’ll likely be taking those single positions out. However, at the end of Chromosome, there are 2 starts and 2 stops together. I need to go to ID 236707 and see what is before that point. It apears that there is an AAAA pattern before that point and that the ABAB at 224584 is a single point. That fixes half of the problem. Then I go to ID 238976 to see why I have a Stop there for ABAB.

fix5

I had missed the Start for the ABAB right after the stop of the ABBA pattern, so I added it in. The repaired spreadsheet looks like this.

fix5spreadsheet

An application

Now that I have the change between ABBB and ABAB described, let’s look at what it means. Here is a different look at that location:

heidi-break

When the pattern changes from ABBB to ABAB, what has changed is the third B changes to an A. Heidi is in that location. So that says at the above position of Chromosome 5, Heidi has a paternal crossover. I thought it would be good to check my work against the work of M MacNeill. To do that, I used the NCBI Remap website to change my Build 37 results to Build 36:

remap

This would be the start of Heidi’s new segment. Here is what MacNeill had:

macneill-check

I got it right again. That is 2 for 2. Actually, the first time I tried, I was comparing the wrong Chromosomes. Rookie mistake. Here is M MacNeill’s map for Heidi on Chromosome 5:

macneill5

Perhaps it is difficult to see, but the point I am looking at is the little lighter red segment at the far right of Chromosome 5. Perhaps that is why I missed it the first time as it is so small.

Another Aside is that this was a very difficult Chromosome to decipher using visual methods. This was one of my attempts to figure out the crossovers visually for 3 siblings.

visual-chr5

I had missed the last crossover as it is so small and difficult to see. In my defense, I should note that M MacNeill did mention that the end of this Chromosome was difficult to decipher.

Taking Out the X

I’ve realized that I’ve generated some bases for the X I got from Dad. Of course, I didn’t really, so I’m taking out any bases there for me and my brother Jon. I’ll use this update query:

takeoutx

I was worried that I’d mess something up, so I created  a  new table called 4SibsChrX. My query put dashes in the spots where I couldn’t have an X base from Dad:

xtodash

This looks like a good place to end Part 4. It appears that there should be many chances to quality check my work and that the process is progressing. Getting Jon’s new DNA set me back a bit, but the results should be better than what I’d see with 3 siblings.