In this Blog, I would like to portray my phasing results in an Excel Bar Chart if possible. This has been one of the most difficult parts a phasing my DNA for me.
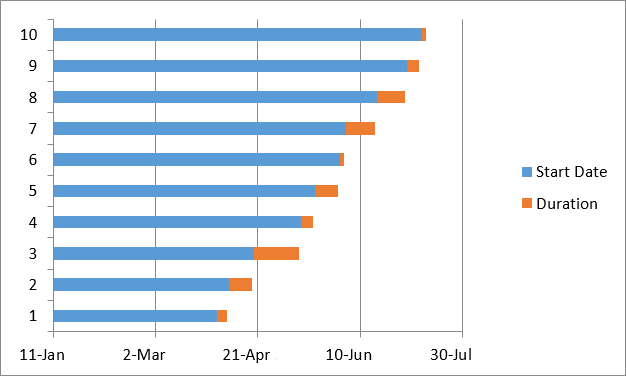
I have looked at Stacked Bar Charts in Excel as they seem to be the closest to what I am looking for. Today I looked at a method for producing Gantt Charts at ablebits.com which seems to hold some promise of application for DNA mapping:
I had my Maternal Patterns’ Starts and Stops from my last blog. I took those and converted them to Build 36 and put them in a spreadsheet:

Start is the ID# I was using. Start36 is the Chromosome position of the Start of the pattern in Build 36. App ID is the approximate position of the Crossover. Then I have that same location in Build 37 and Build 36. Following the logic in the Ablebits.com tutorial, I have the first Maternal Crossovers for Chromosome 7 in my simplified Chart:
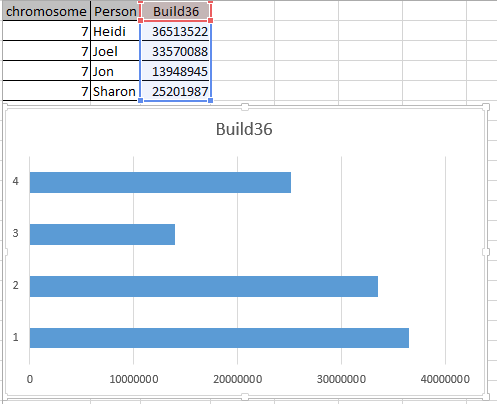
I got this by choosing the Build 36 column and choosing Insert Stacked Bar. I suppose a better Title would have been Chromosome 7 Maternal Crossover rather than Build 36. This was taken from my Column Header. The goal is to get a 2 color bar above. However, I already see a problem. The bar needs to be different colors for different people. Well, I have to start somewhere.
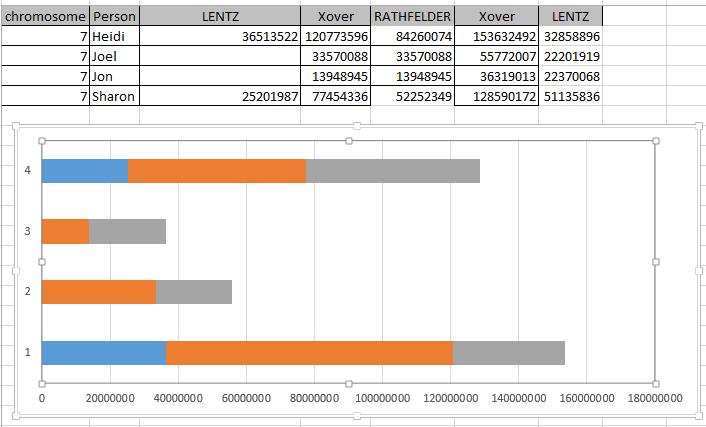
Next, I put in the next crossover location for each person. I took this position and subtracted from it the first Crossover to get a length.

You may note that the Bar Chart inverts the original order. It gives Sharon a 4 which is now on top. Here is my visual phasing of Chromosome 7 that I am trying to replicate:
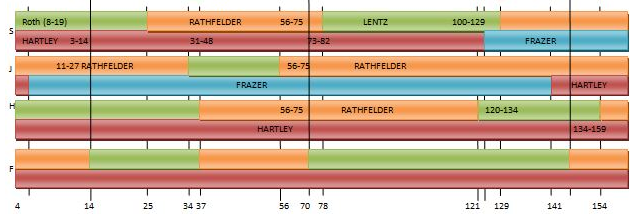
My Excel Bar Chart order is Sharon, Jon, Joel, Heidi. My visual phasing order is Sharon, Joel, Heidi, Jon. The 2 maternal colors I have above are green and orange representing Lentz and Rathfelder. If I keep orange as Rathfelder, that means I want to change bar 2 and 3 (Joel and Jon) on the Excel Bar Chart. One way to do this is to move over the first Crossovers for Joel and Jon in my spreadsheet:

However, that made the 2 male siblings’ first maternal grandparent match too long. I needed to move the start over 2 places in my spreadsheet:

Now the Chr7 Maternal Crossover column can be called Lentz and the 2length column can be called Rathfelder.
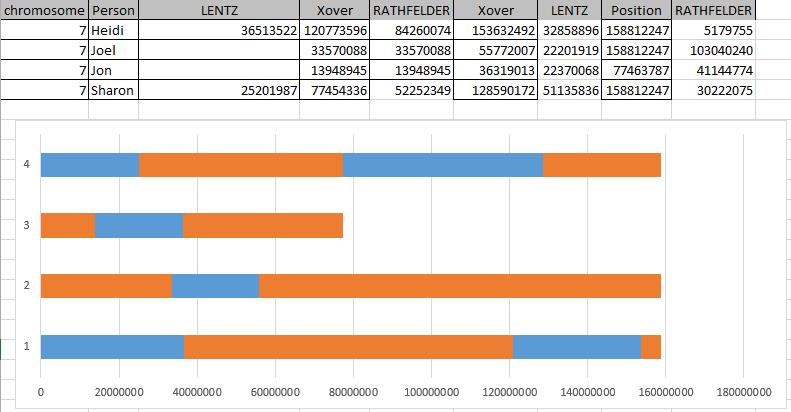
Next, I added another column for the next Lentz portion of DNA:
I was hoping that if I named the next column Lentz, that Excel would give me the same blue as the first Lentz. I was able to right click on the gray and change it to blue. I then added another Rathfelder segment. For this to work in Excel, a Rathfelder length is added rather than a start and stop location.
Again, I had to reformat the Excel-chosen color to be consistent with what I had for Rathfelder. I chose the last position for Heidi and Sharon as the highest that I had as this was their last segment. After a bit of wrangling with Excel, I was able to get this:
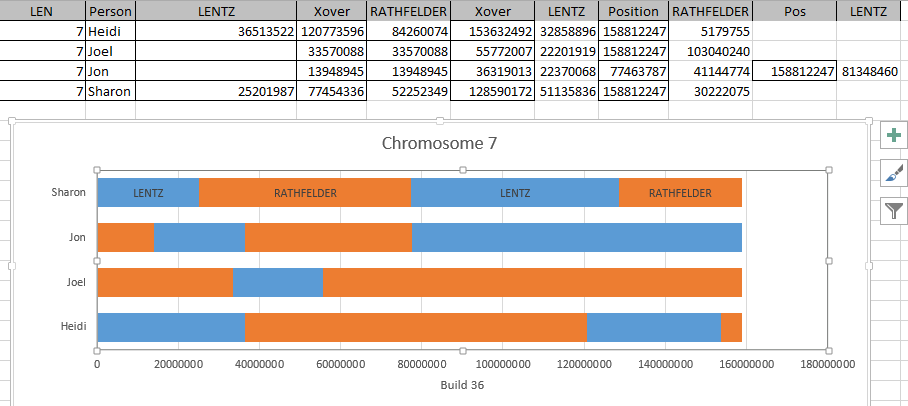
So that is the presentation. However, I notice that on my visual phasing, I had 5 segments for Jon and only 4 here. I missed his last Rathfelder segment. I had ended Jon’s Chromosome too early. Here is the correction:
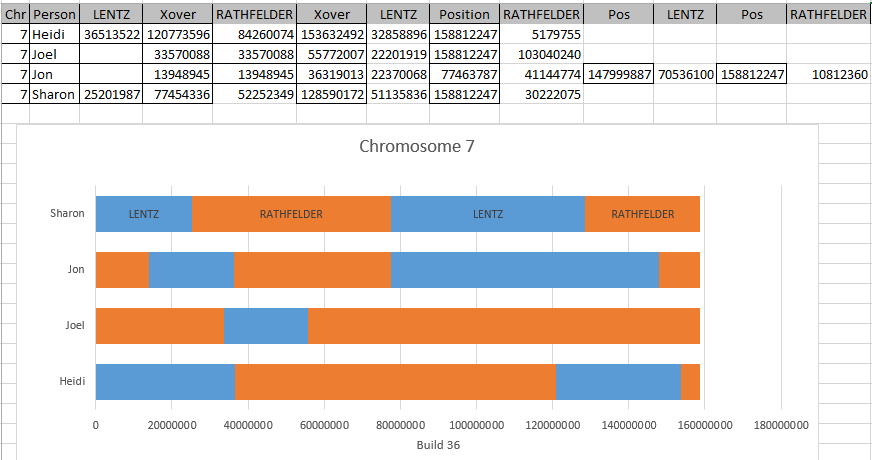
It still looks like one of Jon’s crossovers in the middle of the Chromosome may be off, but I’ll have to figure that out later.
Paternal Bar Chart
Now that I have something that looks like a maternal Chromosome Map, I need the paternal side to go along with it. It looks like if I add 4 more rows to my spreadsheet, I may have it.
I did this and I added Hartley and Frazer (my paternal side grandparents) to the right of the maternal side grandparents. I had to make a new chart that came out like this:
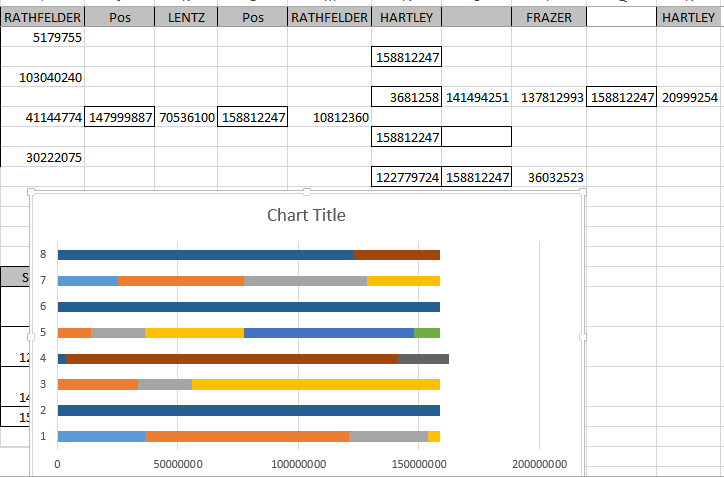
Here #4 is my Paternal DNA. I found it a bit disconcerting that my paternal side was longer than the maternal. Here I’ve added a bit of formatting and made the colors consistent (one color per grandparent):

Well, I guess I’ll just leave this imperfect. It will give me something to work on later. I did change the scale from millions to M’s to be easier to read. The above shows that Jon and Heidi share their paternal grandfather’s Hartley DNA un-recombined on Chromosome 7.
Summary and Conclusions
- Learning how to phase my raw DNA has been interesting and time consuming
- Delving into the A’s, G’s, T’s and C’s promotes understanding of one’s DNA
- I owe a lot to M MacNeill and Whit Athey in learning how to do this phasing
- Due to the data intensive nature of phasing, I would recommend the use of MS Access or some other database software.
- An understanding of Excel or similar spreadsheet software is also important.
- I had tested my brother Jon as an afterthought. It turned out that his test results were important in determining the phasing of the 4 siblings.
- I have the overall skeleton of the phasing with crossovers. There is still a lot of work to complete the individual Chromosomes and trouble shoot problem areas.
- Further, I have not worked on the X Chromosome due to the different nature of that Chromosome. My brother and I are already phased. My sisters are not.
- Once these maps are done they will be a reference to all matches to my 3 siblings and myself.