Raw Data Phasing: Part 3

This Blog is Part 3 documenting my learning process of phasing my DNA raw data using:

Part 1 and 2 Recap

  1. I imported 4 sets of raw data into Access from AncestryDNA after taking out the zeros that the Excel software produced for the no-calls.
  2. I used Access Queries to apply 3 Whit Athey Principles. This resulted in many phased bases for me and my 2 sisters.
  3. I put the phased A’s, G’s, C’s and T’s for each siblings into 2 new columns for each sibling
  4. This resulted in 6 new columns. The first 3 of these six were for the paternally based bases. These resulted in a pattern which was either in the form of AAB, ABA, or ABB.
  5. The Athey Paper did not emphasize the AAA pattern or considered it a non-pattern. While specific AAA results within another pattern area are by chance, there are other areas where 3 siblings match the same grandparent where there will be an AAA-only Pattern.
  6. I separated my results into 3 patterns using Access: AAB, ABA, and ABB
  7. For each of those results, I noted where those patterns changed.  I did this by looking at the ID numbers. Breaks in the ID numbers were considered changes.
  8. However, there were some cases where the changes occurred around missing bases. For these, I went back and noted a more precise position of the pattern change based on where the change would be if the missing base were to be filled in.
  9. I Made a preliminary bar graph using the first 3 paternal changes. These crossovers were mapped to myself and 2 sisters.
  10. Using the 3 patterns I developed Access queries to fill in the missing bases in the 3 paternal pattern areas.

So those were the 10 easy steps. Actually step 10 was difficult as there was quite a bit of refining the Access queries and quality checking the results. I needed 2 queries for each of the pattern areas. However, once I had the queries, it was the push of a button to update missing parental-received bases for 3 siblings within over 700,000 lines of DNA.

Back to Athey

This portion of the Athey Paper appears to apply to where I am now:

For some of the unfilled cells on the mother’s side of the table, we can fill in the alternative (other) base from the corresponding location on the father’s side of the table. That is, we know that the sibling with an empty cell got one base from the father, but the alternative base from the mother. Therefore, after the use of the Dad pattern fills in more cells, a newly filled – in cell in the father’s side of the table gives rise to a filled – in cell in the same position on the mother’s side–the alternative base to what was on the father’s side.

Unfortunately, I’m not sure what is meant above. My guess is that this relates to Principle 3:

Principle 3 — A final phasing principle is almost trivial, but it is normally not useful because there is usually no way to satisfy its conditions: If a child is heterozygous at a particular SNP, and if it is possible to determine which parent contributed one of the bases, then the other parent necessarily contributed the other (or alternate) base. This principle will be very useful in the present approach.

So now that missing paternal bases have been determined based on the patterns, it should be possible to fill in missing maternal bases for heterozygous children. First, I’ll do a Query to see if I can locate this situation. I’ll take my most recently updated Dad ABB Pattern Table update and query that. I’ll look at the situation where there are heterozygous results. Then, I’ll look at spots where there are missing bases from Mom.

Fortunately, I was able to come up with a slick looking Query for this situation:

mom-from-dad

Plus the Query design has some nice symmetry. The first criteria row of the query is for my (Joel) DNA. Reading across, it says Joel is heterozygous because my allele 1 does not equal my allele 2. Then it says that I have a base from Dad but not from Mom. This will show areas where the mom bases are missing in this heterozygous child situation.

mom-bases-to-fill-in

The truncated fields above are Joel Allele 1, Joel Allele 2, Sharon allele 1&2, Heidi allele 1&2. The next 3 columns are Joel, Sharon and Heidi from Dad. Then Joel, Sharon and Heidi from Mom (the last 3 columns). This shows that there are almost 12,000 of these Mom bases to fill in. Above the blue line are Heidi’s bases missing from Mom. Heidi is TC (heterozygous) on that line. Her Dad base is T. I love these binary problems. They seem well suited for the computer. That means that a query could not be too difficult to update almost 12,000 records. So Heidi’s Mom base will be C above the blue line. At the blue highlighted area, I am TC and my Dad base is C. My Mom base will be T on the blue line.

Looking for a Good Query to Fill In Mom Bases from Dad Bases

First, I copied my ABB Table to a new Table called tbleMomBaseFromDadBase. I will want to update that table with a new Update Query. I already have the first part of the query. Now I need my thinking cap. Even better than thinking, I can look at what I did before. Here is my old query.

allele1-query-heterozygous

This is difficult to see, but I split the problem into 2 alleles. What this says is when Sharon has a base from her mom and Sharon’s allele 1 is not the same as the base from her Mom, pop that allele 1 into her base from Dad slot.

For our situation we are doing the opposite. So we will switch Mom and Dad. This time we are using our Dad results to get some Mom results. I’ll also add a criteria to make sure the Mom result is Null, so I’m not overwriting anything. It will just be an extra precaution.

Basically, I want to make sure Heidi has a base from Dad and not from Mom. In that case, when her allele1 is not equal to her base from Dad, put that allele 1 in as her base from Mom. Drawing upon my vast experience in this area of about 1 week, I get this:

allele1dad-to-mom

When I preview the results, I get about 6,000 lines which is half of my previous query, so that seems OK. I’ll go ahead and update my new Table. I renamed my Query to qryMomBaseFromDadBaseAllele1 and copied it to do the same thing with Allele2. I’ll change the Allele’s 1’s to Allele’s 2 in the Query design. First I’ll do a Select (non-updating) Query to show what I’ll be updating with the allele’s 2.

allele2momfromdadselectquery

Here I added the ID numbers, so I can make sure my update went well.

Here is my Allele2 Update Query with the 3 siblings included:

allele2momfromdadupdatequery

The results:

momfromdadupdate

In the far right column is the Base Heidi got from Mom. It was updated on lines 2292, 2295 and 2299. In each case Heidi’s Paternal Base was T and the Maternally derived Base from Dad was C.

Here is my corresponding filled in Mom Base:

joelmomfromdad

My Dad’s T’s in 6 columns from the right were used to fill in the missing C’s in 3 columns from the right. Doesn’t it seem a bit ironic? Even though my dad was not tested for DNA, his “results” from this process are used to find the DNA I got from my mom who was tested.

A Premature End to This Blog and a New Beginning

This will be one of my shortest Blogs. I was both awaiting and not awaiting my brother’s DNA test results. Those results came in this week. The reason I was not awaiting was that I knew that I would need to re-start the raw data DNA phasing process once his results came in. With that, I’ll end this Blog and start a new one.


A New Tested Frazer Descendant: My Brother

My last Blog on Frazer DNA had to do with a newly tested James Line person – Madeline. My brother is on the Archibald Line of our Roscommon, Ireland Frazer Study Group. I had brought a DNA kit to my Hartley Family Reunion at the beginning of August, thinking to get a sample from one of my dad’s cousins. I didn’t end up doing that. So, later, I asked my brother if he would take the test. He did and the results are in.

Missing Frazer Segments from the Hartley Family

M MacNeill – prairielad_genealogy@hotmail.com has been mapping Chromosomes based on my family’s raw DNA data. That has shown that, on some chromosomes, even with 3 tested siblings, there is some Frazer DNA missing. Here is Chromosome 3, for example:

chr3-macneill-map

The bottom 3 lines are my DNA and my 3 sisters. The lighter red is Frazer and the darker red is Hartley DNA. In the middle part of the Chromosome, my 2 sisters and I only inherited Hartley DNA. That means that there is some Frazer DNA missing. My father’s DNA is on the top line. The cross hatch area shows the Frazer DNA that he is missing there because by chance his 3 children below didn’t inherit any in that area. My brother Jon may not help fill in this particular gap, but he may fill in some of the gaps.

Looking for new Frazer DNA from jon

What I did was look at Jon’s top matches. Then I ran those top matches through the One to Many Utility at gedmatch.com. From there I looked at Jon’s match’s matches to see if Jon came up by himself. That would be the new Frazer DNA. Jon’s top Frazer match is our second cousin, once removed Paul. I didn’t see any obvious new DNA with that comparison. Jon’s 2nd or 3rd top Frazer DNA project person is Michael. When I go to Michael’s match list, Jon comes up as Michael’s top DNA match. That is a good sign. Here is Michael’s Chromosome Browser matches for Chromosome 2:

michael-jon-chr-2

Here Jon is #1.

It is not a large match, but the key here is that it is by itself. That makes it new as my 2 sisters and I don’t match Michael at that spot.

Phasing Brother Jon

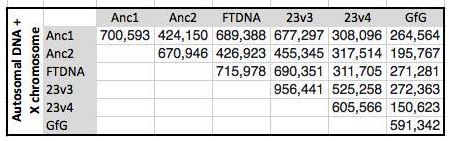
Seeing the match above, it reminds me that I need to Phase Jon by Gedmatch. That means that gedmatch takes my brother’s results and splits them into the DNA it thinks Jon got from my mom and the DNA it thinks that he got from my dad based on my mom’s results. Before I do that, however, I uploaded my mom’s AncestryDNA results to Gedmatch.com. Her FTDNA results are already there. This is why I also uploaded her AncestryDNA results. The chart below shows the results you get when you compare one company’s DNA results to another’s or even a different version of one company’s results to another version of that company’s results.

ancestrydna-compared

Jon’s new results are Anc2 results. That means that now Ancestry is testing different areas of the Chromosomes. However, it looks like I didn’t need my mom’s AncestryDNA results after all. Comparing Jon’s Anc2 results with my mom’s FTDNA results still gives me more SNPs (426,923) than comparing Jon’s Anc2 to Anc1 (424,150). Now I’ll have to mark my mom’s Ancestry kit as research only at Gedmatch as it is not good to have 2 results for one person there.

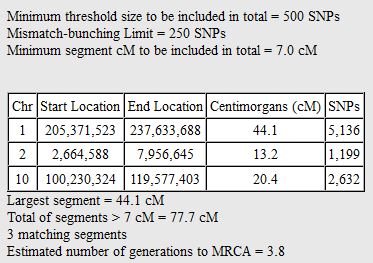
Now Jon has 2 phased kits (maternal and paternal). My little side trip was to check Jon’s Paternal Phased Kit with Michael. Here are the results:

jon-michael-paternal

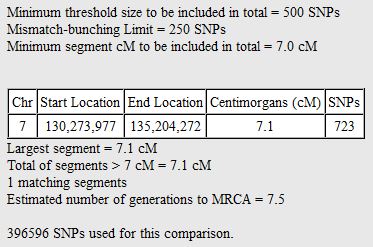
Next I run Jon’s maternally phased results with Michael:

jon-michael-maternal

They have a borderline maternal match. That means that Michael matches Jon on his maternal side as well as Jon’s paternal side. How can this be? The answer is that they probably have a very distant match or match in the general population. My mom is German,  but about 1/4 English also. Michael lives in England. The key for this project is to disregard this Chromosome 7 Segment match as it is not likely a Frazer match.

Any more New Frazer project DNA for Jon?

Next on Jon’s list of Frazer DNA Projects is Gladys. Here is Gladys’ chromosome 1 showing her matches with Jon and his siblings.

jon-gladys-chr1

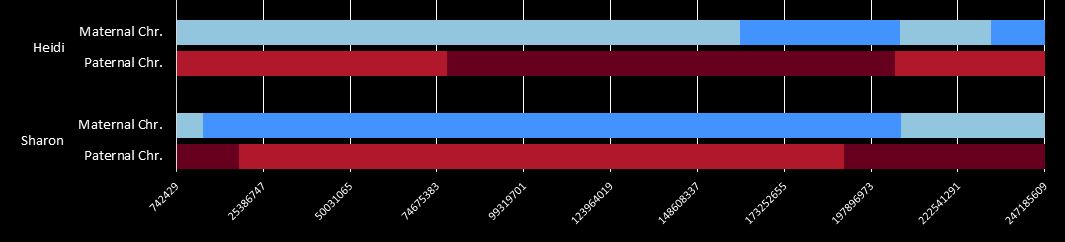
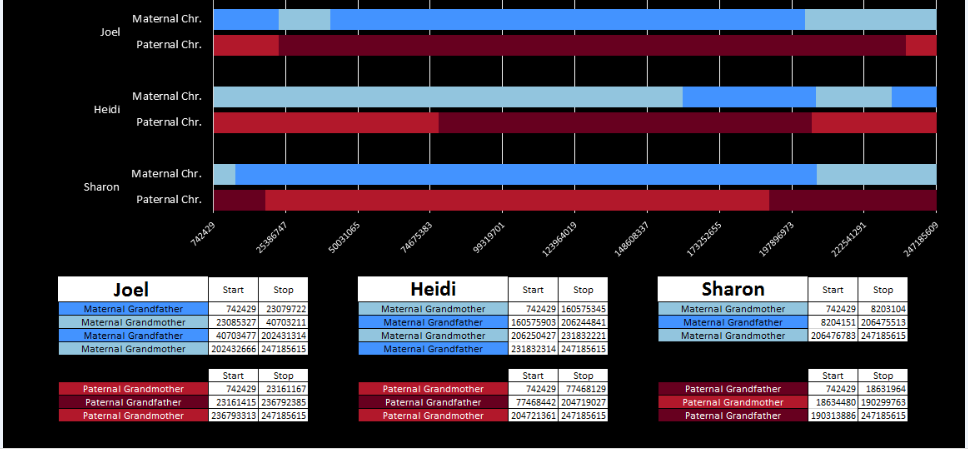
Jon on Line #1 doesn’t have a new match here, but his match is longer. Numbers 2 and 3 are my sisters Sharon and Heidi. This is in an important part of Chromosome 1 where there are a lot of Triangulation Groups (TGs). It looks like Jon’s Frazer DNA got a bit less broken up compared to his sister Sharon’s match in the area from about 182-202M on Chromosome 1 above. Here is MacNeill’s Chromosme 1 map of Heidi (#3 above) and Sharon (#2 above):

macneill-chr1

Sharon’s (#2) small match is represented by the right end of the lighter blue bar above. Where the bar changes from red to dark red, Sharon’s DNA changes from Frazer to Hartley. What Gedmatch shows above is that when his DNA is mapped, the lighter red bar will go further to the right than Sharon’s red bar. Heidi’s (#3) small match is represented by the left side of her 2nd lighter red bar.

Jon and the Everyone Comparison

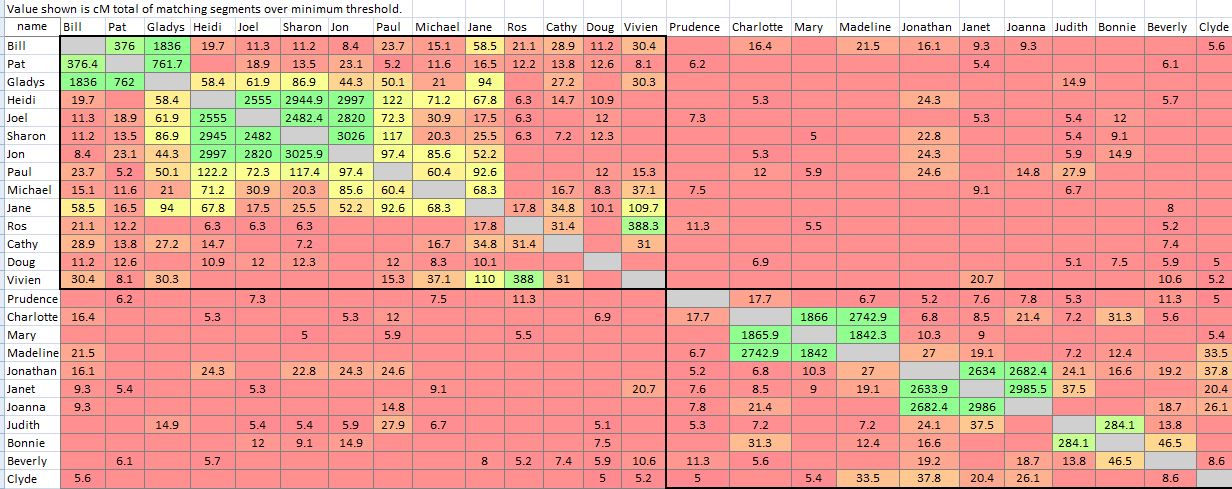
This next image will compare the matches Jon has with everyone in the Frazer Project. I left out those with parents that have tested.

jon-with-everyone

This is like when you order the Everything Pizza. The square in the top left left has the Archibald Line matches. The square in the bottom right has the matches of the James Line of the Frazer DNA Project. People with green matches should know each other already. My brother Jon from the Archibald Line matches Jonathan of the James Line. This seems appropriate as Jon’s middle name is Frazer.

More Detail: GEDmatch Matching Segment CSV

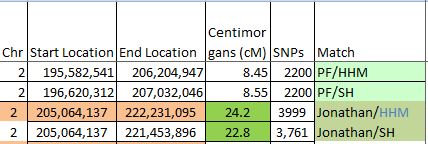
For the same people that I chose for the comparison above, I wanted more segment detail, so I chose an option called Gedmatch Matching Segment. This puts all the matching segments between all the people above into an Excel spreadsheet. While looking at those segment matches, I found a new TG that Jon was in.

New Chromosome 9 TG with Jon

Here is my Frazer DNA spreadsheet:

chr-9-tg

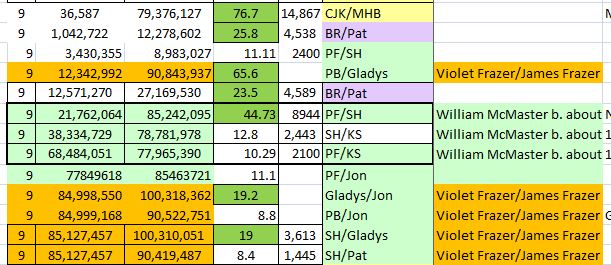
The first line is for 2 close relatives in the James Line, so the match may not be on a Frazer line.

Can you see the TG? It is difficult to see. The TG is between Pat (PB), Gladys and Jon. It is confusing as there is a lot going on there. Here is what Gladys’ Chromosome Browser matches looks like for her Chromosome 9:

gladys-chr-9-matches

Where the lines represent Gladys’ matches with:

  1. Bill
  2. Pat
  3. Jon
  4. Sharon

But remember I said above that the TG was with Gladys Pat and Jon. How did Bill get in there? Note that Jon matches Pat at 8.8 cM. Perhaps Jon and Bill match below thresholds. I lowered the thresholds at Gedmatch to see if Jon and Bill would match, but still no match. Perhaps there is another explanation.

First the TG we do have. And it is a beautiful thing.

gladys-pat-jon-tg-circle-line

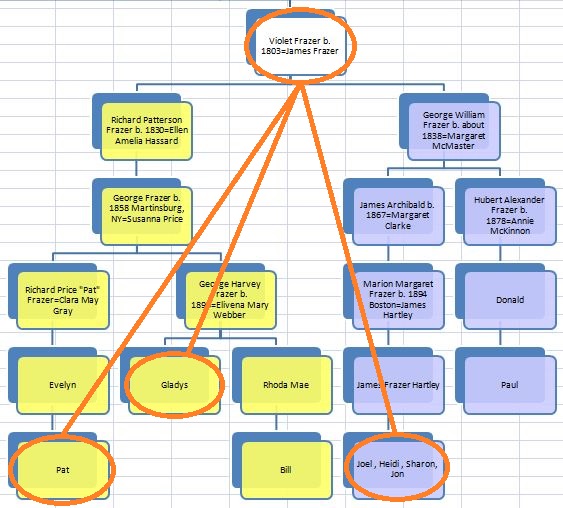
Pat, Gladys and Jon had a double shot at being in a Frazer TG as they have Violet as an ancestor and James, believed to be her 1st cousin. We may not know which Frazer the TG is for, but we know that it is a Frazer TG.

Why isn’t bill in this TG?

Yes, why not? Here’s my guess. As you likely know, we carry a set of chromosomes from our Mom and another set from our Dad. Gladys, above, had a set of Frazer Chromosomes and Webber Chromosomes. Perhaps the match Gladys showed with Bill was a Webber match. There is a way to test this theory. Bill also does not match Pat in the area of the TG that we are looking at. In my spreadsheet above, Bill has a few matches with Pat but they are in different regions. Bill may be matching Pat on the Price Line. Note that Pat and Bill share a Price ancestor.

Another Question: Why isn’t my sister Sharon in this tg?

The answer to this question is easy. She should have been in this TG all along. In my spreadsheet I have that Pat and Sharon match at 8.4 cM. I missed the larger match between Sharon and Gladys.

gladys-sharon-match

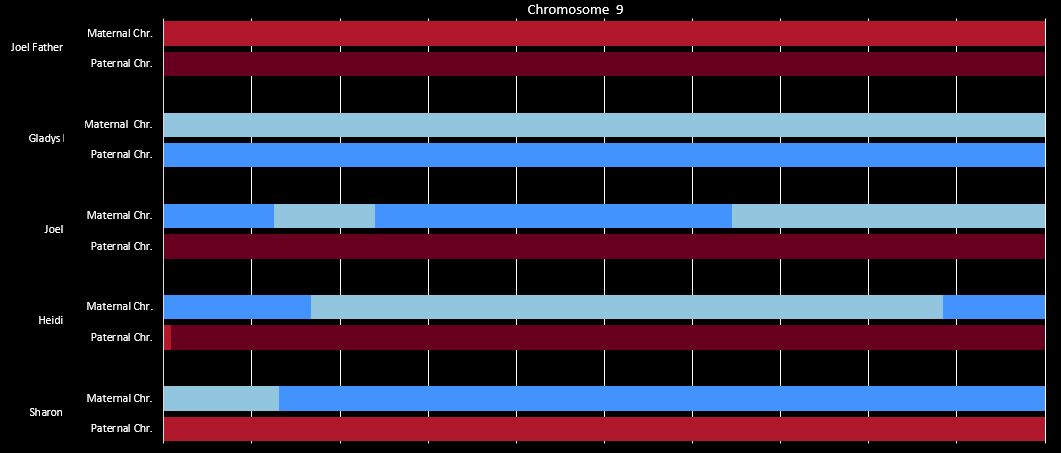
By the way, of my mapped siblings, Sharon has a lot of Frazer DNA in her Chromosome 9:

sharon-chr9

Sharon’s Unrecombined Frazer DNA

Thanks to the results of M MacNeill’s beautiful mapping work, Sharon’s  lighter red bar on the bottom of the image above is all Frazer DNA. That means her paternal chromosome #9 did not recombine. She has the same Frazer DNA in that Chromosome that her dad got from his Frazer mother. But how did Dad get his DNA from his mom? My guess is that the DNA my dad got from his mom did recombine. That means that grandma passed down a combination of her parents’ DNA. That would be her paternal Frazer DNA and her maternal Clarke DNA.  What I know for sure is the places where Sharon matches other Frazers would be the Frazer segment of my dad’s DNA. That would be at least the 85 to 100M range of Chromosome 9. So my dad’s (maternal) and Sharon’s (paternal) Chromosome 9 could have looked like this:

frazer-clarke-segment

That leads to my modified spreadsheet for Chromosome 9:

mod-chr9-spreadsheet

The gold is intended to stand for the TG leading to Violet and James Frazer. Note that a lot of changes happen around 85M on the spreadsheet. My guess was, and still is, that there was a change from Frazer to McMaster DNA at that spot for Paul and my family. Both Paul (PF) and my family descend from George Frazer and Margaret McMaster. That would explain why other Frazers stop matching Paul and my siblings at that spot.

Hopefully, this image will explain it better. This is what Sharon’s and my dad’s Chromosome 9 could look like as it passed down to my dad. A generation earlier, in my grandmother’s DNA a McMaster probably recombined in there also.

mcmaster-dna

Basically:

  • Sharon should have gotten a chromosome from her dad’s mother and father recombined
  • However, At Chromosome 9, she only got her paternal grandmother’s DNA (Frazer) – so she got one long segment
  • My father’s Chromosome could have looked like the image I had with Clarke and Frazer that he got from his 2 paternal grandparents.
  • My grandmother got her paternal Chromosome 9 from George Frazer and Margaret McMaster. Her Paternal Chromosome likely had a break in it at position 85M where her DNA went from McMaster to Frazer. This carried down to Sharon. Her paternal Chromosome 9 wouldn’t have had Clarke as this was her mother. The Clarke DNA was on my grandmother’s Maternal Chromosome 9.

So in Summary:

  • Jon is in a previously undiscovered TG at Chromosome 9
  • The TG points to Violet and James Frazer
  • Sharon got her entire Chromosome from her dad un-recombined
  • My grandmother passed down her DNA to my dad probably recombined with some of my dad’s grandfather’s Frazer DNA and Grandmother’s Clarke DNA
  • There is a stop in my family’s Frazer matches right at the point where there is a start in a match with my Frazer 2nd cousin once removed (location 85M). That leads me to believe that this is the spot where our match goes from 2nd great grandfather Frazer to our shared 2nd great grandmother McMaster.
  • Sometimes when working on a family DNA project such as this Frazer one, it is possible to find non-Frazer ancestor’s DNA.
  • Chromosome mapping is a big help in visualizing which ancestor likely contributed DNA to which descendant.

Bonus Feature: Archibald and James Line Frazer TG Update

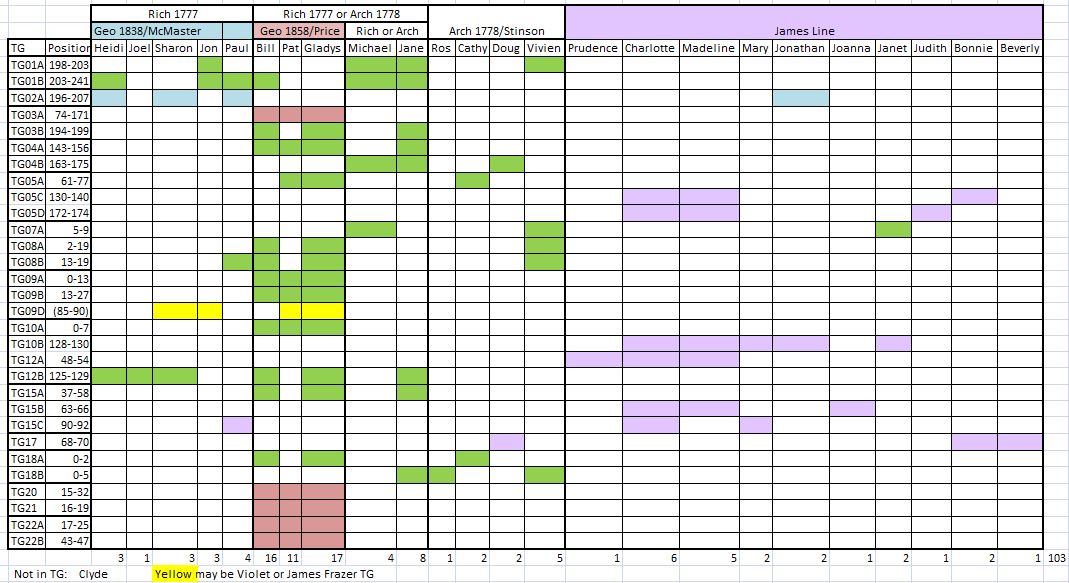
tg-summary-frazer-sep16

I hope that I got this right. At least it should be generally correct.

  • There were a lot of new TGs that I noted in my previous Blog on the James Line side that I updated in lavender.
  • A preliminary observation is that Joanna and her family seem to favor Charlotte, Madeline and Mary more than Judith, Bonnie and Beverly.
  • This shows that all in our Frazer DNA Group except for one is in a TG. That is pretty exceptional.
  • There are 24 in the TGs. Each of these people averages about 4 Frazer TGs
  • I was an underachiever, as I’m only in one TG
  • The number of times one is in a TG is likely subject to many things including:
    • Random DNA inheritance
    • Distance you are to the common ancestor – the closer you are, the more likely you are to have a match
    • endogamy. Some groups have 2 or 3 Frazers in their ancestry. The Price group have 3 Frazers in their ancestry and the most TGs. Each Frazer/Price descendant is in almost 15 TGs each, though 5 of those are likely Price only TGs
    • number of descendants your common ancestor had. This will increase the odds of a TG as there are more descendants to triangulate
  • The 5 likely non-Frazer TGs are in a raspberry color and are likely Price TGs.
  • I have a note that the yellow TG could be for either Violet or James Frazer. I am leaning toward James as Violet descends from Richard Frazer as does Michael and Michael is not in this TG. James is believed to be the son of Philip b. around 1776 who was a brother of Richard b. around 1777.


Raw Data Phasing Via Access, Athey and MacNeill: Part 2

In my last Blog on raw data phasing, I went through 3 principals that Whit Athey laid out in a paper on phasing raw data when one parent’s DNA results were missing. Using those principals, and the MS Access program, I was able to sort many of my bases and 2 sisters’ bases into ones we received from our mom and ones that we received from our dad. I checked a few of my results with a chromosome map made for me by M Macneill.

Paternal Patterns

I had gotten to the part of the Athey paper where he talks about paternal patterns of bases that the sibling combinations received. I noted a space between the first two paternal patterns that I looked at. Below the pattern goes from an ABA pattern to an ABB pattern.

change-in-dad-pattern-hilite

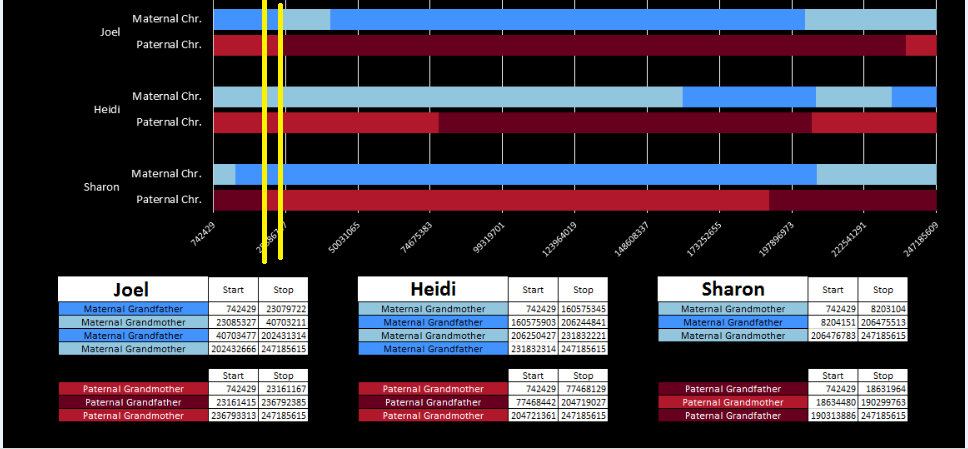
There was a gap between the ABA and ABB pattern where there was no ‘pattern’ as my 2 sisters and I shared the same base there. When my sisters and I all share the same base, that is an AAA “pattern”. That AAA area corresponded exactly to the area between the 2 yellow lines below in the chromosome map made for me by M MacNeill – prairielad_genealogy@hotmail.com .
macneill-chr1-hilite

In the map above, MacNeill was able to determine that my 2 sisters and I got our DNA from our paternal grandmother in the area between the 2 yellow lines. Further, the first yellow line described Sharon’s first paternal crossover point and the second yellow line described my (Joel’s) first paternal crossover point.

Finding All the Paternal Crossover Points

At this point in the Athey Paper, he recommended looking at the paternal pattern and filling in the missing bases based on the known pattern. I was looking for an easier way to do this, so decided to take a different approach. I decided that I would find all the paternal crossover points first. Then, armed with that information, I would create a formula that would fill in most or all of the missing bases for each pattern.

However, this required a modification of my database to make the work easier. I wanted a number to define the range of patterns, so that I could apply an easy query to add missing bases. I already had this but I hadn’t used it. Back when I imported the 4 sets of raw data into Access, Access assigned an ID to every row of data. That meant that I needed to add that ID into all the queries that I had done previously to make tables and further queries. This took a while, but I believe that it was worth it.

table-with-id

The ID is the first column.

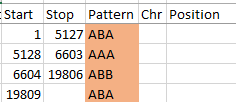
I started going down all my data and noting the change of each pattern. I put the results into an Excel table. Here the Start and Stop numbers are the Access assigned ID numbers. The ID’s corrrespond with the number of DNA locations looked at. In this case there were a bit over a total of 700,000 of these locations for my mom, my 2 sisters, and me.
excel-pattern

Then I noted the patterns are repeating as would be expected. For example, my first pattern was ABA, but 3 patterns later, that same ABA repeated. My thought was to create a query just for ABA patterns. Then when scrolling down looking for changes, the separation between rows should be greater and it would be easier to see where those changes were.

Here is what my Access query looks like. I changed the query name to DadSpecificPattern.

dad-specific-pattern-queryquery

This particular query gives me the ABB pattern. I have the HeidifromDad base equal to the SharonFromDad base. That makes me the A and Sharon and Heidi the BB of the ABB Pattern. If you think about it, that also means in these areas that Heidi and Sharon will have their base from the same paternal grandparent and mine will be from the other paternal grandparent. I’m learning as I go. I’m sure that information will come in handy later.

My plan seemed to be good, but there was one catch. Once I refined my query, most or all of the blanks disappeared. That meant that the start and end points might not be exact. Here is an example of what I mean.
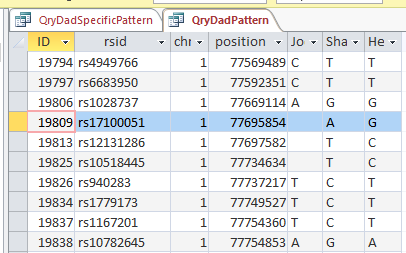
change-in-pattern-rouch

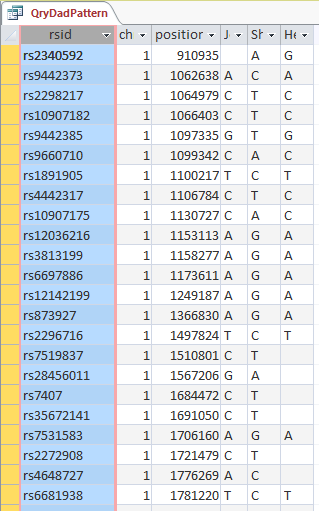
This is from my old Dad Pattern query with the blanks still there. The change from ABB to ABA happens at ID or line 19809. However, the new query takes out the blanks to make it look like the change is at ID Line 19826.

Here is what my DNA results look like so far without a filter (or query). The last 3 columns are the bases from Dad columns. There is a lot going on between lines 19809 and 19826.
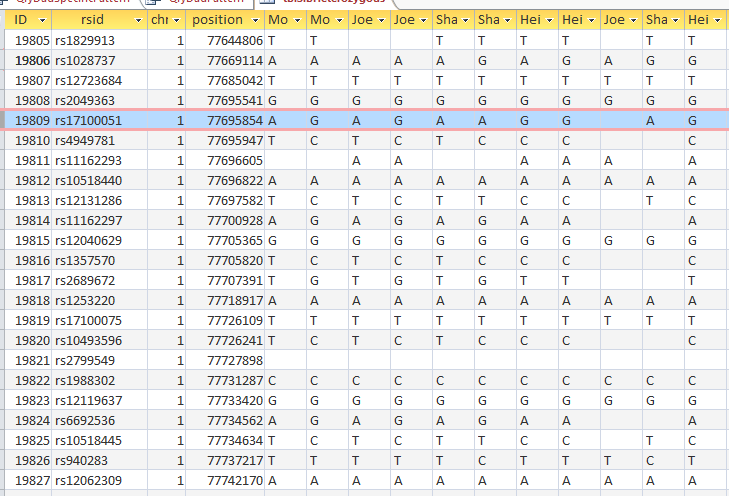
pattern-unfiltered

Once I apply a formula to add bases, it will say something like: In the lines that have the ABA pattern where there is a blank at either A spot, replace the blank with the A that is there. If I apply the rule too late, I will be missing an area. Worse, If I were to use the 19826 cutoff, I may be still using the previous rule. That rule would say basically the same thing except, “Where the row is ABB and one of the B’s is missing replace the missing B with the one that is there.” If I apply an ABB rule to an ABA area, I’ll get bad results.

Long story short, I ended up recording a rough start and stop in my Excel Spreadsheet.

revised-spreadsheet-for-pattern

I started naming the segments, but realized that was not necessary. Some of the patterns were only at one point rather than in a long segment. I believe that is an anomaly due to a bad read, mutation or some other problem. Those are the ones in the spreadsheet that had no end point. It took me part of a morning to get all the paternal crossover pattern points for all 23 chromosomes. Fortunately for 3 siblings, the patterns are only ABA, AAB and ABB.

I just went back and checked the error points/aonomalies. I reran the Heterozygous Sibling Query and it fixed at least the first problem and hopefully the others. When I added the ID’s in, I had to redo all the queries quickly, so I suppose that is where the errors came in. That is not a problem as long as the problem can be found a fix can usually also be found. There actually weren’t that many errors. There are still some anomalies that are just anomalies. I have left those in yellow in the spreadsheet image below.

So in my spreadsheet, I have all the rough starts and ends for all the crossovers for my 2 sisters and myself. Here is the top part of the spreadsheet sorted by rough start:

rough-start-sort

Next, all I need are more exact start and end points. Here is the start of what I have:
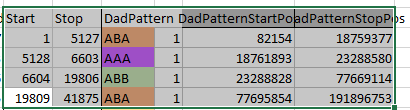
pos-and-id-and-pattern

I picked this section because it looks pretty complete already. Note that my Start and Stop numbers are pretty close to each other. That means that there are no other AAA segments in-between. I had to do an additional Access query to add in the position numbers for the Start and Stop of each chromosome’s pattern change. This was important if I want to convert the results from Build 37 to Build 36 to compare to MacNeill’s work or to gedmatch.com.

Starting to Find Paternal Crossovers and Assigning to Siblings

Previously I had been calling the start and end of my patterns crossovers. These two terms aren’t totally interchangeable as the start or stop of a pattern may happen at the beginning or end of a Chromosome and therefor not be a crossover at that point. It seems like it should be pretty easy to find the crossovers. Look at the image above. The first and second rows show ABA going to AAA. The order in me and my siblings are JSH or Joel, Sharon and Heidi. The only letter that changes is the B to A. That is the position that Sharon is in, so the paternal crossover has to go to her. From row 2 to row 3 the pattern changes from AAA to ABB at Chromosome 1, position 23,288,828, Build 37. That doesn’t mean that 2 siblings have a crossover there as we are looking at the patterns, not the letters. It is actually the letter that stayed the same that represents the crossover here. AAA to ABB means: all the same (AAA) goes to one different and 2 the same (ABB) – in this case Sharon and Heidi). The one that is different is me and I get the crossover at this location. The next change is from ABB to ABA. This is a little harder to see. I would say that that this crossover goes to Heidi if my reasoning is right. BB was the same before and goes to BA. It must be Heidi that changed because now she matches Joel who didn’t change. I’ll need to figure out how to make better bar graphs in Excel, but here is how the beginning part my father’s Chromosome 1 broke up for 3 of his children. Or another way to look at it the vertical lines are where my father’s maternal and paternal chromosomes combined in each of his 3 children that we are now looking at.
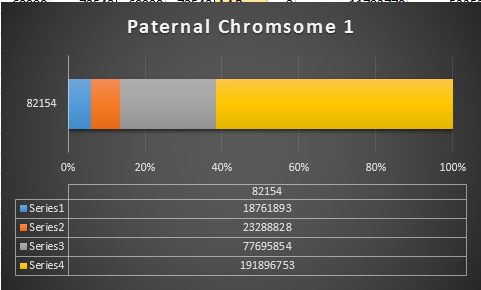
excel-bar-chart-chr1

Where:

  • Series 1 is Sharon. Where the color goes from blue to orange is where Sharon has a change from one paternal grandparent’s DNA to another paternal grandparent’s DNA. The number to the right of Series 1 is the Build 37 Chromosome position number for Sharon’s crossover.
  • Series 2 is Joel’s first crossover (between orange and gray) and
  • Series 3 is Heidi’s first crossover position between gray and yellow [The same explanation under Sharon above applies to Joel and Heidi]

I’ll go back to the M MacNeill Standard. It’s like having an answer sheet to my questions.

macneill-chr1-hilite

According to MacNeill, I have assigned the crossovers to the correct siblings. In the above chart, just look at the red. I haven’t gotten to the maternal part yet, which MacNeill has in blue. The first 3 crossovers are where the red changes from light to dark or dark to light red. The difference in the MacNeill Chart is that his chart is split out one bar for each sibling. The other difference is that MacNeill has build 36 Chromosome position numbers and the numbers I have are from Build 37.

The Process

  1. Phase the siblings into maternal and paternal DNA using the principles that Athey outlines
  2. Find the paternal and maternal crossovers by pattern changes
  3. Assign the crossovers to the correct sibling using the pattern changes
  4. Assign the segments to the correct grandparent. This requires knowledge of cousin matches on the appropriate grandparent side.

That is the big picture which I am understanding as long as I don’t get too lost in the details.

Back to the Details: Fill in More A’s, G’s, C’s and T’s

I have been setting up my data for this, so hopefully, this will be easy. I now have 3 areas to look at:

  • AAB
  • ABA
  • ABB
AAB paternal update

Now I go back to my spreadsheet and sort it by Dad Pattern:

sort-by-pattern

The Start and Stop areas are the ones I want to update. First, I’ll copy my most up to date Table in Access which is tblSibHetorzygous. I’ll rename that tblDadPatternUpdate. Then I want to look for missing data and update the blanks using the AAB pattern.

In Access, I create a query with the new table.

dad-pattern-update-1

I chose the position fields and Paternal Pattern fields. I will change this to an update query which adds an Update To row. The criteria I want is when JoelFromDad = Sharon from Dad (AAB). Actually, I forgot, I was going to use ID criteria. So in the ID field, I need a lot of information. For the first AAB segment, I need everything between ID 45393 and 54155. This is what the criteria looks like:

aab-first-area

When I choose that area, I get over 8,000 lines. However, I only want to update when there is one missing value in the first 2 and the one that isn’t missing is not equal to the third. Here is the result of the above query in my first AAB area:

aab-patterns

I assume that the first blank should be a T. This would be one of the AAA results by chance in an AAB area. I don’t want to fill in the second line as I don’t know if it will be GGG or something else. That is what I meant by saying I don’t want to fill anything in unless there is only one missing value. In the 5th line there is A?G. That would have to be AAG (in an AAB Pattern area). There are some lines that have everything missing that I don’t want to touch.

How to create a query?

First, I want the situation where Joel doesn’t equal Sharon or Joel Doesn’t equal Sharon. That would create an AAB situation:

heid-not-joel-or-sharon

This query results in 1,666 rows of data including rows that are already filled in. Note that I had to write the range of ID’s twice because in order to get an OR situation I needed to put Joel not equat to Heidi and Sharon not equal to Heidi on separate lines. A simpler query is this one:

heidi-not-joel-or-sharon-one-line

The above achieves the same results in one line. Now, for this query, if Joel is blank, replace it with Sharon’s results. If Sharon is blank, replace it with Joel’s results. Here is the query prior to the updating part:

joel-sharon-blanks

This shows that there are 29 blanks for Joel and Sharon meeting this AAB criteria in the first range of AAB’s:
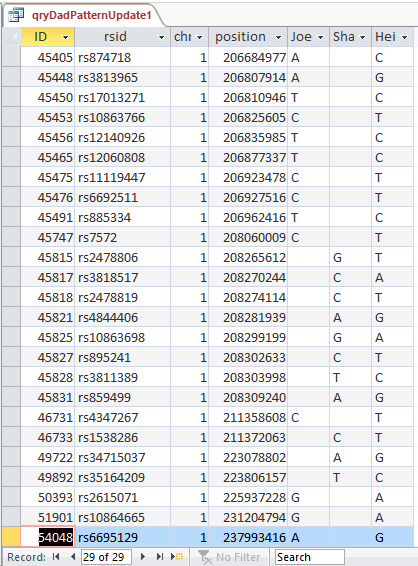
29-records-aab

Next, I apply the same logic to all the AAB segments. In the Expression Builder of Access, I type in this simple formula:

Between 45393 And 54155 Or Between 60990 And 72548 Or Between 207109 And 220679 Or Between 313271 And 317516 OR Between 326845 And 326912 OR Between 389395 And 390311 OR Between 400045 And 405578 OR Between 419982 and 427158 OR Between 433191 And 446672
OR Between 482297 And 492542 OR Between 532520 And 539292 OR Between 571557 And 579594 OR Between 589614 And 589666 OR Between 630037 And 630314 OR Between 630319 And 630378 OR Between 658744 And 659375 OR Between 670533 And 672360 OR Between 673325 And 682544

Simple but long. This has the AAB Starts and Stops for 23 chromosomes. Then I copy it into the next ID criteria line and get this result:

all-missing-aabs

It took a few minutes to type the criteria, but the goal is to update 1,514 lines of missing Paterrnal Pattern data with the push of one button. I still think it is quicker than going line by line and will be more accurate if I got the criteria right.

Next, I change the above Select Query to an Update Query.

paternal-aab-update-query

When my (Joel’s) base from Dad is missing, I update to Sharon’s base. When Sharon’s base from Dad is missing her base is updated with mine. Isn’t sharing great? I didn’t look at the case where Heidi’s base from dad was missing, because if that was missing we wouldn’t be able to see any AAB Pattern.

Let’s UPdate

I push the run button and check the results. Here is my standard dire warning:

standard-dire-warning

Now I will check if it worked. I’ll try ID or Line # 682124:

bad-aab-results

Unfortunately, that was an undesirable result. Before I had A?G. I changed this to ?AG. It appears that my query both replaced my value with Sharon’s, but replaced Sharon’s with my blank. I hadn’t expected that. Next, I’ll check ID# 682182. I had ?AG and replaced it with A?G. So until, I can think of a solution, I’ll need to split the 2 queries.

Fix it! Quick!

First I recopied by Heterozygous Sibling Table back to the Dad Pattern Update 1 Table. This got the table back to the way it was. Here is my simpler query.

dad-aab-simpler-query

Here if my base from Dad is null, replace it with Sharon’s base from Dad. I’ll check ID# 682182 again:

second-mistake

This gets into the category of trial and error. Sharon’s result still got replaced with nothing. See in the previous query I still was telling Access to put update Sharon’s results with mine. I needed to take that out:

fix

There. Now the SharonFromDad Update To is blank. I go through the same procedures and now it looks right.

right-results

We now went from ?AG to AAG in the last 3 columns. These are the bases from Dad columns.

The next step is pretty easy:

sharon-missing-aab

I took out my criteria and put criteria in the SharonFromDad field. When she has a blank, replace it with Joel’s base from Dad. I hit run and it updated over 600 rows. Here is my original check spot at ID# 682124 with better results in the last 3 columns:
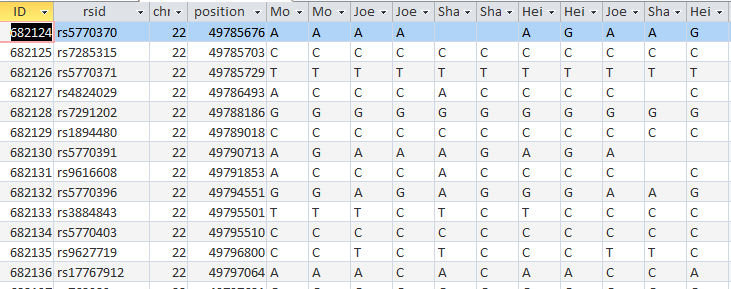
better-results

It took a while, but at least I got it right. The moral of the story is to not ask Access to do 2 things at once when those 2 things involve the same 2 people.

The Next Step: ABA

This time I’ll try a different query. I want there to be a B from the ABA in each case, so I’ll make sure that Sharon’s base from Dad is there:

aba-query

Maybe I’ll figure what went wrong last time or come up with a new error. Above, I want the criteria on the first line to be for my blank base: If Sharon’s base from Dad is not equal to Heidi’s Base from Dad Put Heidi’s base from Dad in my blank spot. For Heidi, When Joel’s base from Dad doesn’t equal Sharon’s base from Dad, put Joel’s Base in Heidi’s spot.

I’m so tempted to try this query, but before I do, I’ll copy the previous table of the DadPatternUpdate to a new Dad Pattern Update ABA Table.  This will preserve what I have in the now older DadPatternUpdate Table in case anything goes wrong. Hey, what could go wrong?

query-aba-dad

I pushed the Update Button and updated over 30,000 rows. The results don’t appear to be any better, so I’m back to my 2 step process.

Here is my new slimmed down query:

slimmed-down-query

This new Update Query should update my Line 18 in the new UpdateABA Dad Pattern Table and it does:

lne-18

I now have a full ABA pattern on that line. According to Access over 30,000 Lines were updated, so it wasn’t a total waste of time.

heidi-aba

Run and check Line 149:

check-149

We have ABA in the last 3 columns, so that is good. Line 18 is still OK. I checked it just to make sure.

Query AAB Revised

After seeing how well the ABA Query went, I decided to revise the old AAB Query:

aab-query-rev

This is now looking at over 37,000 rows. This updates my AAB Blanks to tblDadPatternAAB. I don’t know if it is a better query, but at least I’m being consistent.

sharon-missing-aab-rev

This was over 80,000 rows, so I’ll assume that bigger is better.

I copied that resulting Table to tblDadPatternUpdateABA and reran the 2 ABA Update Queries. Here is one of the rerun queries updating the ABA Paternal Table:
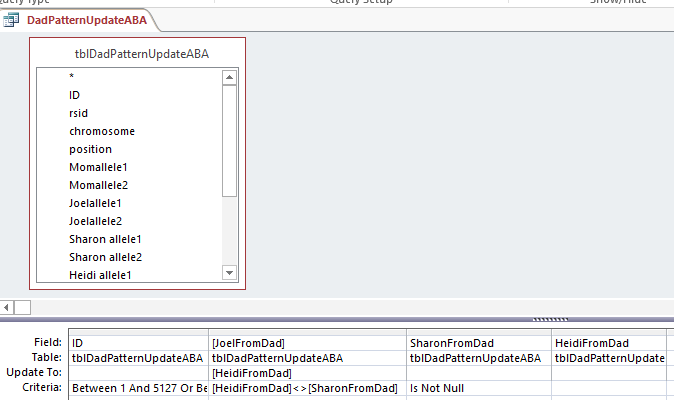
rerun-aba

Down to ABB

My Last updated Paternal Table was updating ABA, so I’ll copy that to a new Table called tblDadPatternUpdateABB. I’ll also copy my last query and put in the appropriate Starts and Stops for the paternal ABB patterns. Again,
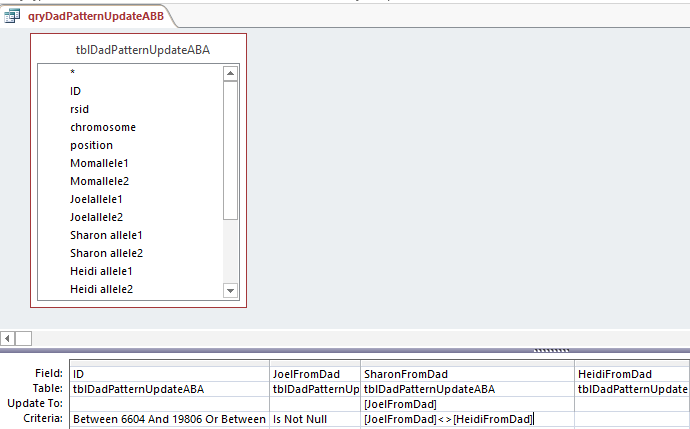
abb1

This says when Joel’s base from dad is not the same as Heidi, put that Joel from Dad into the space. Probably a more precise query would have said when Sharon from Dad is null and Joel from Dad is not equal to Heidi from Dad. I suppose technically the above query could be writing over a base with the same base in most cases.

I’ll fix that and notice that I had the wrong table in the top, so I’ll change that also.

abb-rev

This only updated 944 rows, so maybe bigger is not better. Here is Part 2:

abb2

This was almost 3,000 rows updated. Now I should check if it worked. I scrolled for an ABB Pattern in an old query and found this:

dad-pattern-abb

Here is my check:

abb-check

I guess I’ve been working too long. Here I have an AAB instead of the ABB I wanted. That is because I had Heidi updated to me (the A) instead of Sharon (the B). Here is the correction:

abb-corrections

I made a fresh Table of ABB. When I opened up the Query, it was saved this way:
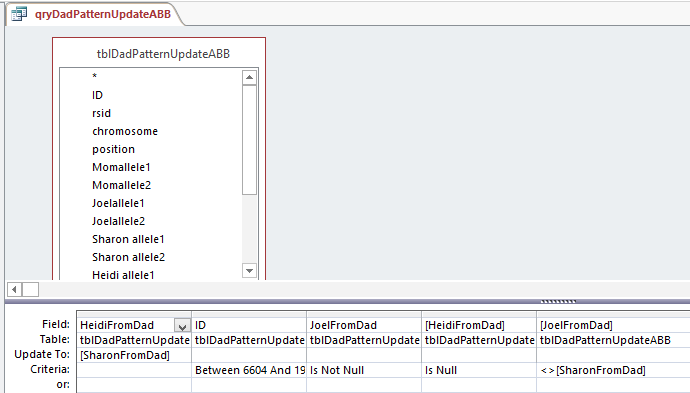
corrected-abb

So Access changed my query. Note that there are 2 fields with HeidiFromDad in them. One is for the Update To and the other has Criteria. That is probably a clearer way to do it. Who should argue with Access?

I updated that and I take a cue from Access for Part 2:

access-abb-part-2

In English, the above says, “For this range when JoelFromDad is not blank but Sharon from Dad is, and Joel from Dad has a different value that Heidi from Dad, put that Heidi from Dad value where Sharon had the blank. It sounds a little complicated.

Back to Row 197704 and I’ll look at 197709 while I’m at it:

corrected-abb-pattern

Oh no, it is still wrong! I checked the previous ABA Table and that was the reason for the error. The error is also in the old AAB Table. However, the error was not in the file before that. My guess is that the AAB rule got applied to the wrong range of rows. I don’t see an error there, so I’ll have to rerun all the queries.

That’s OK, because I’m brushing up on the queries and will use the Is Null value so we will only be filling in the missing bases.

rev-aab-query

I had more problems, so I deleted the AAB Table and recopied the previous Table into it. I reran the Revised AAB Query halfway and it looked OK. However, when I ran the second half of the AAB query – filling Sharon’s results, the problem came back at ID# 197704. Very mysterious. The problem was where I thought it was originally. Look at the ID Criteria for the AAB Pattern Query:
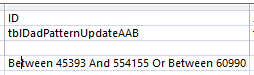
the-problem

There is an extra digit in the first between. The range goes from 45393 to 544155. The second number should be 54155. So this query was performed on 450,000 more rows than intended. I updated the AAB query with fewer rows. Again fewer is better. After many requeryings, I got the desired result for ID# 197704:

197704

That should be the end of the first phase of nit picky work on the Paternal Side.

Summary, Conclusion and What’s Next

  • This was a lot of work, but the good news is that this update is for all the Chromosomes at once.
  • The bad news is that I have to do this again for the Maternal Side
  • Next up should be easy. That is just re-applying the Principles that Whit Athey Outlined on the new bases that I added from knowing the patterns. This should update missing maternally received bases from the updated paternally received bases.
  • I haven’t filled in blanks for the AAA patterns yet.
  • I am a little ahead of the game as I looked at how some of the first paternal crossovers will look.
  • Also with some basic phasing, I was able to deduce who those first paternal crossovers belonged to – one each to my two sisters and one for me.
  • If anything can go wrong it will

Phasing Raw DNA with MS Access a la Whit Athey: Part 1

In this Blog, I would like to look at my raw DNA data. Those are the A’s, T’s, G’s and C’s. I have tested at AncestryDNA as has my mom and 2 sisters, so I will use those results. Whit Athey has a paper that describes how to phase your DNA when the DNA from one parent is missing:

Journal of Genetic Genealogy, 6(1), 2010
Journal of Genetic Genealogy
Fall 2010, Vol. 6, Number 1
T. Whit Athey
Many have used MS Excel to phase their raw DNA results. However, it occurred to me that perhaps MS Access would be a better tool for phasing than Excel. When I download my AncestryDNA data, I get about 700,000 lines of data. That is a lot more data than Excel can handle easily. I will go through the Athey Paper and use Access to get results. However, I will not be giving a tutorial on Access as that would take too long.

Downloading AncestryDNA: Getting Rid of Zeros

Many people have downloaded raw data to upload to gedmatch.com. Ancestry raw data is in text form. Access gets along with Excel well, so first I import the AncestryDNA text data into Excel. Perhaps if you are curious, you have taken a look at your raw data to see what it looks like. Unfortunately, it takes a while to open up such a large file. Here is what a few lines of my AncestryDNA text file look like:

ancestry-text-file

It is important to note in the information above that Ancestry uses Build 37. That means that these results need to be converted to compare to Build 36. For example, Gedmatch uses Build 36. I remove the information above the column titles and bring it into Excel. However, I put my name on the top of the last 2 columns because eventually there will be columns for 4 people’s results (mine, my mom’s and my 2 sisters’). I will need to distinguish between each person’s alleles. It is important to note that when importing this text file to Excel, Excel retains the file as text. This is probably such a file as note that the no-calls have been changed to zeros. To save the file as an Excel file, you must specifically do that step.

Here is a file with the no-calls as blanks, like I want them, and with my name at the top and the verbiage removed:

joelallele12-text

Here is the file in Excel. I have used the search and replace in the last 2 columns. I want blanks for no-calls and not zeros which Excel likes to add.

ancestry-raw-excel

Using Access

At this point, I had to switch to my laptop as I don’t have Access on my desk top. I open up Access and name a new database. I go to External Data and choose the Excel icon with the arrow pointing up to import my 4 Excel Files of Raw DNA for Mom, my 2 sisters and me.

access-import

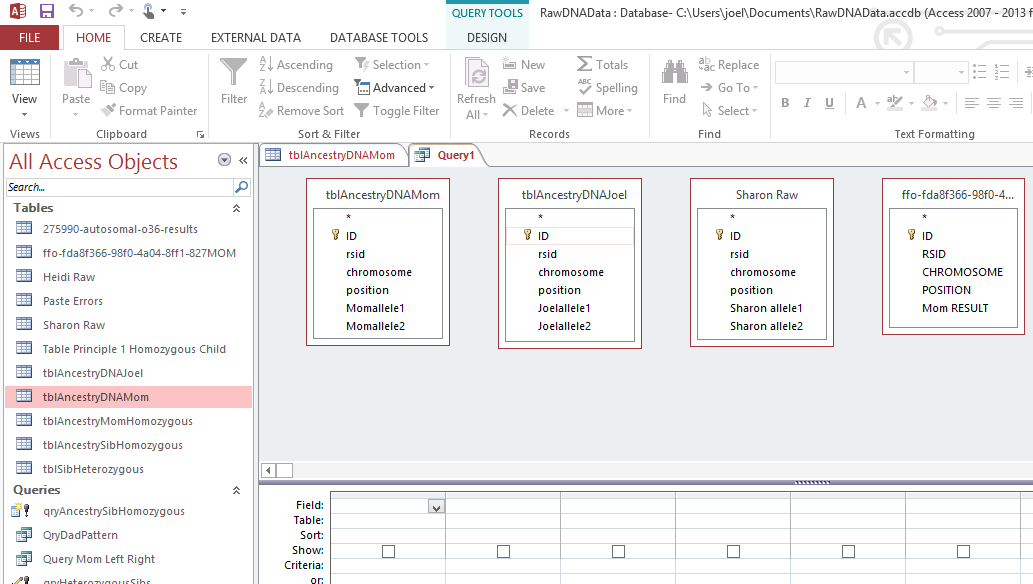
Next under Create, I choose Query Design. I choose the 4 Excel files that I have imported to Excel.

4-tables-in-query

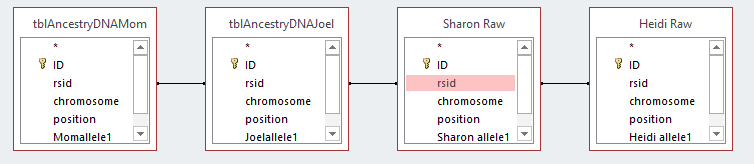
I should note that when I imported the Excel files, that Access creates a unique ID for each row. I let Access do that. It has set that ID as a key identifier. I could have used the rsid as a key that is somewhat as a unique constant. Next I will connect each table by the rsid’s with something called an equal join. That is the dark line I added between the rsid Field for each persons DNA data.

equal-join

This means return the results when the rsid is the same for each file. Note the last table ( 2 images above) was wrong, so I took that out and added my sister Heidi’s Raw data table on the right. It is important to get the initial importing right and in the right format as this will save a lot of time later. Here is the form that I want the data in:

whit-table-1

This is a portion of Table 1 from the Whit Athey Paper. The difference is that Whit only had part of Chromosome 16. I will have all Chromosomes at once. In my Access query I choose the Excel Titles as Fields. I need the rsid, chromosome and chromosome position only once. Then I add the 2 alleles for each person. FTDNA uses right and left alleles. AncestryDNA uses allele 1 and 2. They are the same undifferentiated alleles.

fields-for-query

When I run the view the query results, I get this:

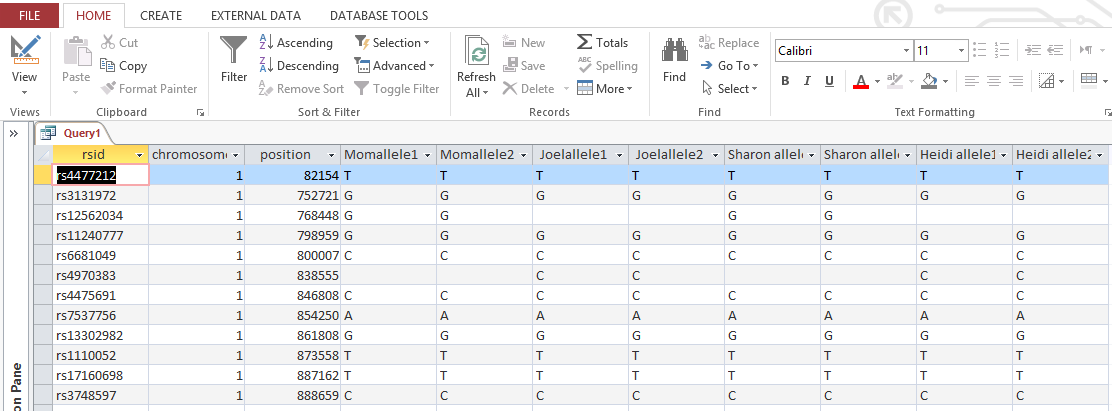
view-first-query-results

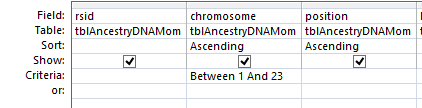
So with one push of the button, I have all the raw results of 4 people in my family in one area. I actually have more information than I need. AncestryDNA includes chromosome 24 and 25 which is YDNA and mitochondrial information that I don’t care about here. This is easily filtered out in the criteria section of the design view. I choose ‘Between 1 and 23’ there. That gives me each chromosome between and including 1 and 23.

chromosome-criteria

Now I am down from roughly 701,000 lines of data to the 700,000 lines that I want. It is important to save these results as a Table in Access as we will be using that Table to make more tables. Also save the query. Even though I say to do this, I didn’t. but just saved the results under the next step.

Whit Athey’s Principle 1

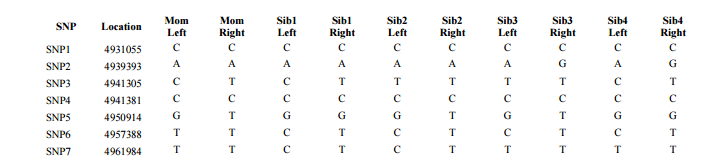
This Principle is simple and straightforward. It says that if you have two letters the same in your results, one of those came from one parent and one came from the other. In line 1 of my results above I have TT. All my siblings have this result also. My mother is already shown as TT as she was tested. My father who was not tested must have had a T which he gave to me and my 2 sisters. Here is Table 2 from Athey showing the next set of data that we need to produce the AncestryDNA raw data. Ancestry didn’t tell us which side each of our bases came from, so we will figure that out.

athey-table-2

I have only 3 siblings that I’m looking at right now, so I need 6 more ‘Fields’ in my database. There are a few ways to do this in Access. Here is one way that I did it.

Athey Principal 1 in Access: Homozygous Siblings

Homozygous is just a fancy term for my TT result found in the 1st position tested of my 1st Chrmosome. I created 6 more fields. These are to show what allele (letter) I got from my dad and my mom when I had a TT or other such homozygous results. Here is what the first field out of six that I added looks like on the Access Query Screen.

homozyous-sib-query

JoelFromDad is the first new field name. After the semicolon is the criteria. In English is says that if my allele1 is the same as my allele2, then put my allele1 in as the result I got from my dad. I used the same reasoning for a field called JoelFromMom and in similar fields for my two sisters. I viewed the results to make sure they made sense. I chose Make Table as I want the results in a Table to use later.

make-table

 I hit the Run button and created a Table called tblAncestrySibHomozygous. Here I have squished the results together.
tblsibhomozygous
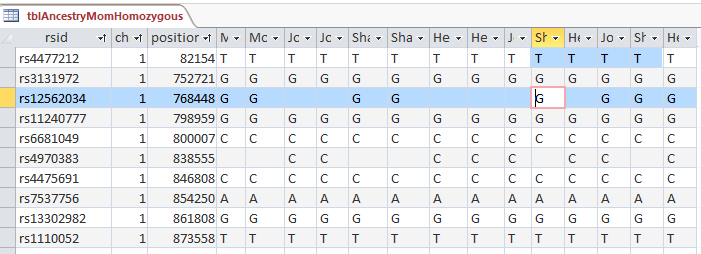
The results are as above: MomAllele1,2, etc. Then I added in the last 6 columns: JoelFromDad; SharonFromDad; HeidiFromDad; JoelFromMom; etc. In the first line above, The T’s that we all had were added as contributed from our mom and dad. There appears to be an error on line 3. Note that there were no-calls for Joel and Heidi. What we got from Dad was right, but we shouldn’t know what we got from our mom, just based on our own results. I must have saved my next step to this table also.
Fortunately, when I view the original query, the results are correct:
qrysibhomozygous
Note now that the blanks that should be there in the end of the 3rd line are there. Now I have 700,153 lines of results showing where my 2 sisters and I got our DNA from each parents just based on our own ‘homozygous’ results. Good old Principle 1.
Another tip is that when you make a Table from a query, the order may be slightly different than what you want. To keep the same order, in the Sort row, choose Ascending for the chromosome and position.
sort-order

This will make sure that the chromosomes and positions within the chromosomes stay in the correct order. Otherwise, Access may try to sort by the first field which is the rsid.

Principle 2 in Access: Homozygous Parent

In my case, the homozygous parent is my mom. I spilled the beans already by my mistake above. In Line 3 above, my mom is GG. That means she had no other choice than but to contribute one of those G’s to each of her children at that location on Chrmomosome 1. Now I will put that Principle into Access language. For this portion I will use an Update Table. An Update Table will add new information to an existing Table. In this case, I added it to my tblAncestrySibHomozygous Table. That is why it showed the results already above. Here is what the Update Query looks like in design:

update-for-momhomozygous

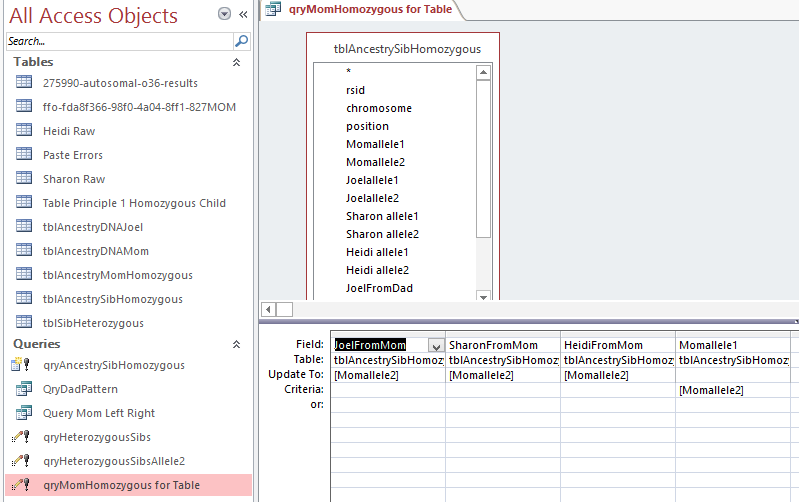
Here I have the tblAncestrySibHomozygous Table which I reran (or un-updated). This query says for the criteria where Momallel1 equals Momallele2, update the JoelFromMom, etc Fields with the Momallele2 value. Obviously I could have chosen either of her alleles to update the fields as they are the same. In the bottom left of the image above there is a pink highlighted query called qryMomHomozygous for Table. That is this update query. the ! means that it is going to create something. I assume that the little symbol to the left of the ! means that it is an update query. I ran the query and then created a new table with the results called tableAncestryMomHomozygous. Again, what I had forgotten was that by running this query, I also updated tblSibAncestryHomozygous. It’s always good to do quality checks – especially when you are dealing with over 700,000 rows of results at one time.

I did the update and got a warning from Access that I was updating over 400,000 rows.  And that action cannot be reversed. Here is my old tblAncestryMomHomozygous to show the zeros that I didn’t like:

old-mom-homozygous

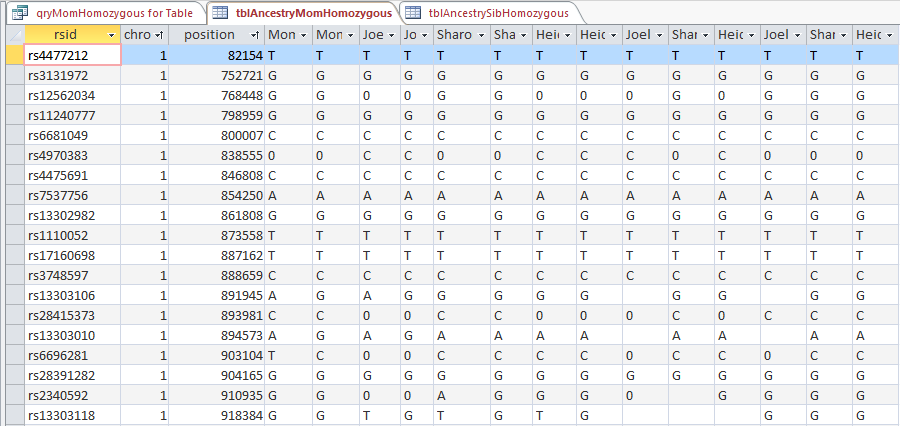
I’ll delete that table and replace it with the update on tblAncestrySibHomozygous that I just did. Here is the new table without zeros.
new-momhomozygous
I still had to sort the table to get it right. The trick is to sort the position first and then the chromosome and everything comes out in the right order. Notice that I got rid of my old zero problem. Now I have over 700,000 rows of phased DNA based on homozygous results. Next, I look at heterozygous DNA. Whoa.

Principle 3: Heterozygous Child

I’ll copy the Athey Principle as he stated it as it is slightly more complicated than the previous two:

Principle 3 — A final phasing principle is almost trivial, but it is normally not useful because there is usually no way to satisfy its conditions: If a child is heterozygous at a particular SNP, and if it is possible to determine which parent contributed one of the bases, then the other parent necessarily contributed the other (or alternate) base. This principle will be very useful in the present approach.

How to put Principle 3 into access?

Here is an example of heterozygous children alleles where the mother’s contributing base is known:

heterozygous-example

We know that each sibling got a G from mom as she only has G’s at this location. All the siblings have TG for their raw results, which means the T must have come from dad. I can go through over 700,000 lines and apply that rule or try to use the Access Update Query to produce the same results. This time I copied the tblAncestryMomHomozygous to a table called tblSibHeterozygous before I did the update to maintain the integrity of the older table. In the Update Query, I combined 2 steps. First I set a criteria that there has to be something in the JoelFromMom for this to work. So I said that JoelFromMom is not Null. Next, my allele1 is T. I want this to go into my JoelFromDad spot. If this T doesn’t equal the G I got from my mom, I am already heterozygous, so I don’t need an extra query for that. [That was the step that I didn’t need.]

Here is what I have for an Update Query:

query-heterozygous-allele2

However, note that instead of looking at allele1 here I chose allele2. I am thinking that this will be a 2 step process for each allele. This query is updating over 70,000 rows, or a little over 10% of all the data. I’m trying to show that this Update Query did not address my example above which had to do with allele1 and it didn’t:

allele2-query-heterozygous

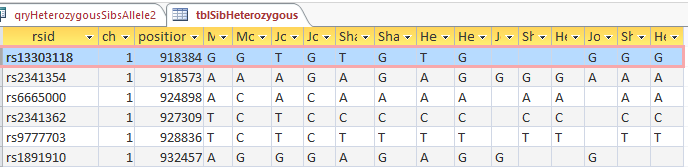
The first line was my example. The 3 blanks in the first line are the bases from Dad that were not produced from the query as expected. However, it did work for the second line. In that case, my allele2 was not equal to the allele I got from my mom, so it inserted that allele (G) as the allele I got from my Dad. Next I’ll copy the query: qryHeterozygousSibsAllele2 and rename it as qryHeterozygousSibsAllele1. Then I changed 6 of the allele2’s to allele1’s. This is to cover my original example where allele 1 wasn’t the same as the base contributed from Mom.

allele1-query-heterozygous

In English: When allele1 doesn’t equal the allele that you got from Mom, put it in as the allele you got from Dad. This results in over 76,000 row changes. By the way, if I haven’t mentioned it, in the Update Query, the row that says Update To is the one where the update to your data is happening. So in the above example if Sharon’s allele1 doesn’t equal the one she got from Mom, that allele is then known to be the one from dad and is inserted in the correct place in a new table.

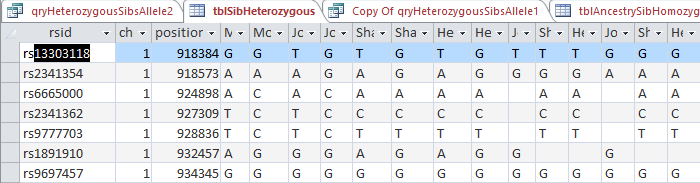
I check my updated table for good old rs13303118 and find:

update-allele1-sib-heterozygous

So I think that it looks pretty good. The first line is now filled in with our Dad’s contributing base. Also all the applicable following lines out of 700,000. There are some situations there should be blanks. In the third line, my mom is AC and I am AC. That is the situation where it is not possible to know what base came from what parent. So the base for each of my contributing parent is left blank – meaning that it is unknown.

One Last Step: Looking for Patterns

This is about as far as I’ve gotten and understood. The next issue that Whit Athey looked at in his paper were patterns. In his example there were 4 siblings tested, so more patterns. He added a column between the allele inherited from Dad and one from Mom called Dad informative pattern.

dad-informative-pattern

The idea is that there will be a pattern that lasts for a long time as we go down the results sequentially. These are the patterns of the segments that we inherit from our grandparents. Where the patterns change are the crossovers. Whit says to use those patterns to fill some of the missing letters. I haven’t started filling in the missing bases yet for a few reasons. One is that I’m not sure why I need to. In scanning the Athey paper there is a repetitive procedure of going back and forth between the data using the base from Dad’s side fill-in’s to help with the base from Mom’s side and then back again. First I’m not sure how to automate this yet. And if I could, how much better would the data be? I have quite a bit of data already. Once I get some answers of why I need to do this, I will continue on.

Here is a paragraph from the Athey Paper concerning the above Table 2:

Note the pattern of inheritance from Dad shown in Table 2 for the four siblings in the leftmost four columns. The first few rows show an AABB base pattern, but this gives way in about lines 12-13 to a new pattern, ABBB. Even though we only can see the pattern showing in some of the rows, these patterns persist over hundreds or thousands of SNPs, and can be assumed to exist also in the intervening rows where no pattern was discernable (and in the underlying sequence). Note that often there will be the same base in every location, a case of “accidental matching” which does not contribute to or detract from the pattern we are looking for. When two or more bases are different in a row, however, this represents an informative pattern—if any two are different, then since there are only two possible chromosomes contributing, it means we can see the chromosomal origins of the bases.

One of the reasons that I quote the above is to address the accidental matching where there was the same contributing parent base for each sibling. However, what I didn’t see addressed is that there are cases where that is not just accidental which I will discuss later.

Finding the crossovers

I do know the importance of finding the crossovers. I wrote a query in Access to cull out the patterns that Whit mentions.

query-for-patterns

Above is my query in design view using the table that has Principles, 1, 2, and 3 already applied. This query basically filters out the situations where the 3 siblings have the same base. The thought is that if one sibling has one base that is different from one of the others, then the three siblings’ will not share the same base.

results-of-dad-pattern-query

Above is the start of the results of the query. Note the XYX pattern. This should make it possible to fill in Heidi’s missing bases from Dad. It looks like multiple choice test answers, but I would add C, G, C, C, C and A in the last column for the bases that Heidi got from Dad.  My homework assignment is to find a formula to fill in those letters so I don’t have to do it manually 10’s of thousands of times.

Another thing I want Access to do is find where the crossovers are. Here I scrolled down all the bases the my sisters and I had from Dad. I can see where the XYX pattern changes to XYY:

change-in-dad-pattern

But there was a problem. the XYX pattern stopped at position 18,759,377 and the XYY pattern started at 23,288,828. That means we have a large area with no pattern. Exactly. That is the area of XXX pattern that I just queried out. That has to be the area where all three siblings match the same paternal grandparent.

Checking my results with m macneill’s work

Fortunately, I have secret weapon. M MacNeill – prairielad_genealogy@hotmail.com has also been looking at my raw DNA using his own Excel spreadsheet method. Here is what he has for Chromosome 1:

macneill-chr1

Now just look at the first 3 red bars above. They represent my paternal side. The first break would be on Sharon’s bar – the third red bar from the top. The end of her dark red bar is at 18,631,964:

sharon-chr-1

Look at Sharon’s bar in that region and then scan up the 3 red bars. There is an area where all three siblings match on the paternal grandmother side (lighter red).

That is my paternal XXX Pattern.

To satisfy my curiosity, I went back to my unfiltered/unqueried table at the spot that the first pattern changed from XYX to XXX. The end of the first base pattern from Dad is highlighted in blue.

xyx-to-xxx

Line 2 is a no-call. Line 3 is one of the random XXX matches in the XYX pattern area that Athey mentioned above. Note that I could not likely fill in line 4 with what I know as I don’t know if that should be AAA, AGA, or something else. Actually, I could fill in Heidi’s with an A. If her results are AAA or AGA, Heidi still gets the A from Dad. It is only Sharon’s base from Dad that I don’t know.

However, starting at CCC, it seems like it would make sense to fill in all the letters in the XXX pattern area – even if there is only one known base out of three.

Converting Build 37 to Build 36 positions

At the top of the Blog I had mentioned that AncestryDNA results were in Build 37. M MacNeill’s work is in Build 36. I really didn’t want to have to convert results and thought that I was being clever by using all AncestryDNA results. However, to compare to M MacNeill’s Map above or to Gedmatch results, I still have to convert positions. Hey, life is tough.

NCBI genome Remapping service

Fortunately there is a way to convert positions here.

conversion

Assuming we are all homo sapiens, we select that choice and we select that we want to go from Build 37 to 36:

build-37-to-36

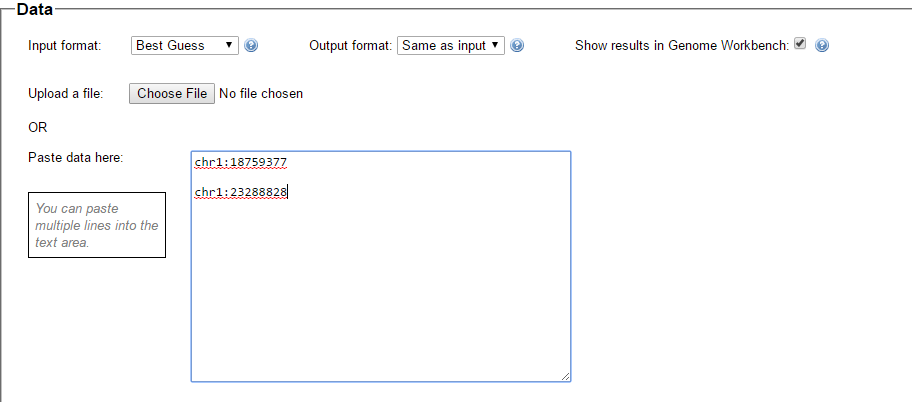
Here is the place to enter the data we want converted. It has to be in the format below – “chr1:” followed by the position number.  There is also a place to upload a file which I haven’t tried.

data-for-conversion

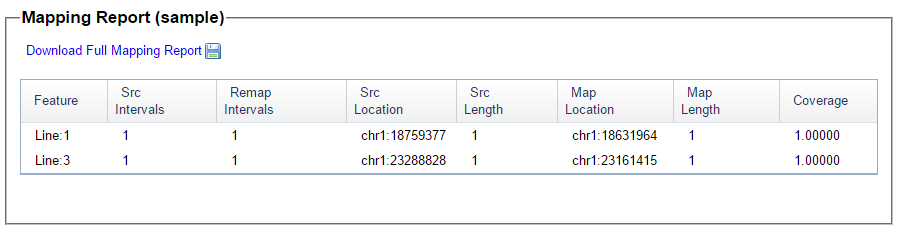
These are the 2 positions from my query where one pattern stopped and another started. Here is what they look like in Build 36 under Map Location:

chr-conversion-results

These Build 36 position numbers match up perfectly with M MacNeill’s map positions which gives me some confidence. This is where I’ll end Part 1.

I have found 2 paternal crossover points. However, I have not yet figured out which siblings they belong to – unless I cheat and look at the MacNeill Map above. I can easily do the same thing and find the pattern changes for the maternal side. I have shown 2 crossovers, but all the others exist in my query for 23 chromosomes. I just haven’t looked for them yet.

Summary

  • The Whit Athey Paper has been very helpful in phasing my raw DNA based on my mother and 2 siblings test results.
  • M MacNeill has piqued an interest in raw DNA data that I never thought I would have
  • M MacNeill’s Chromosome Maps are very helpful in checking my work
  • MS Access appears to be a great tool to use to quickly phase a lot of raw DNA
  • There is probably no way around DNA remapping or conversions
  • I still need:
    • An easy way to find all the crossover points
    • A formula to fill in the various patterns
    • A good reason to fill in those missing bases
  • I have a lot more to learn about DNA phasing using raw DNA data


More Hartley DNA – Patricia’s DNA

This blog is a follow-up on my last Blog: My Hartley Autosomal DNA. I was inspired to write that blog following this year’s Hartley reunion in Rochester, Massachusetts. I intended to send around a little poster I made up about Hartley DNA and get a DNA sample from my father’s cousin Martha, but didn’t get a chance to. Instead I wrote a blog. I did talk to Patricia though. She is my second cousin and the sister of my childhood best friend, Warren. She had taken an AncestryDNA test. I think her daughter bought it for her. I asked if she could upload her DNA to gedmatch.com and she said that her daughter would be good at doing that.

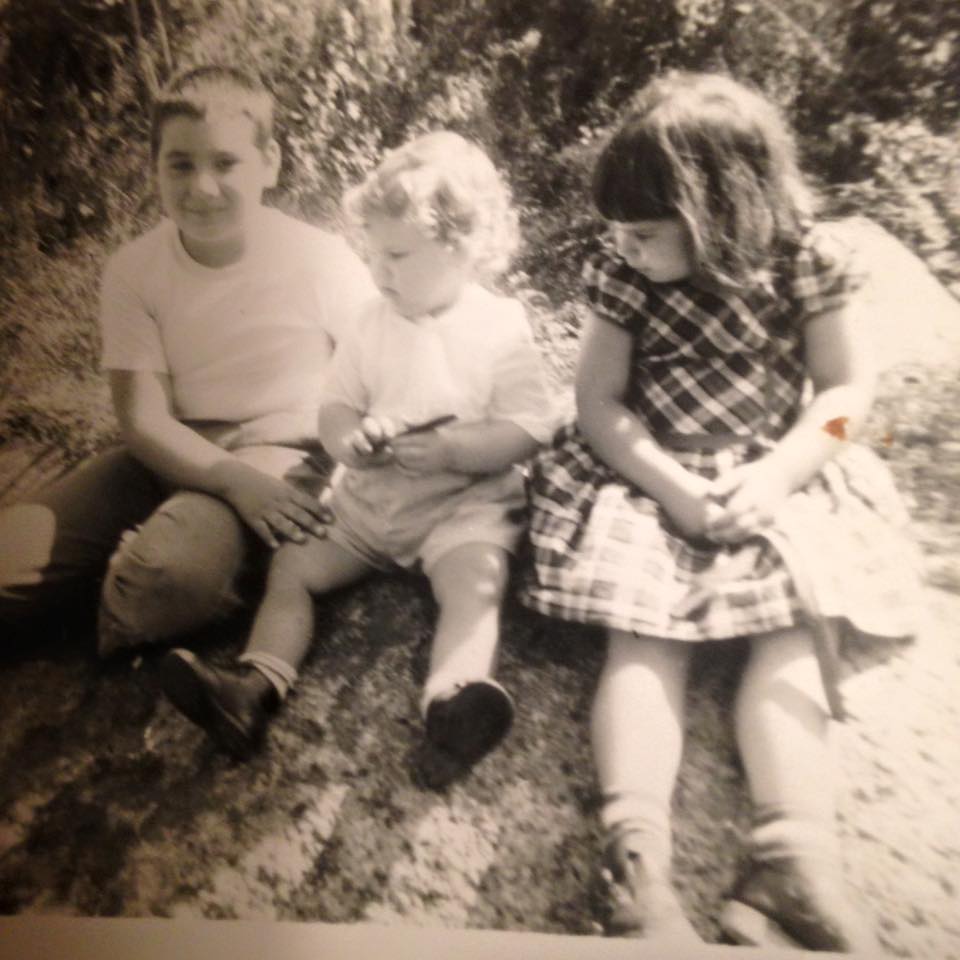
Here are Patricia’s 2 brothers and Patricia. The one in the middle was my best friend in my first 6 years of school. I remember seeing home movies of Curtis, Warren’s older brother. He came to one of my older siblings’ birthday party when he was about this age.

Patricia and family

In my last blog, I wrote about the Hartley DNA matches my father’s first cousin Jim had with me and my 2 sisters. I was surprised to find out that every match that we had represented one of my four 2nd Great Grandparents. They were all born around the 1830’s. It turns out that Patricia’s matches with cousin Jim represent the same four 2nd great grandparents. In addition Patricia’s DNA matches with my 2 sisters and me represent the same four old timers.

Here is what my DNA match to Patricia looks like at AncestryDNA:

Patricia Ancestry

Here, AncestryDNA has it right that we are 2nd cousins. They show we match for a total of 206 cM (centimorgans) across 14 DNA segments. That is about all you can get out of ancestry. They won’t tell you which chromosomes we match on or how much we match on each chromosome. That is why people upload their results to gedmatch.com. Ancestry does show other people that match DNA to both Patricia and me. These are my 2 sisters and 5 others. All these people also descend from the same Rochester Hartley ancestors, but none of them have uploaded their results to gedmatch.com, so we don’t know their detailed DNA matching information.

Here is the same match between Patricia and me at Gedmatch:

Pat Joel Gedmatch

Ancestry has 14 segments vs. the 8 at Gedmatch. But at Gedmatch we know on which chromosome we match, how much on each chromosome and the exact start and stop location on the Chromosome. However, even with Ancestry’s 14 segments, their total is a bit smaller. Here is how I match Patricia on Chromosome 15 in the Gedmatch Chromosome Browser:

Joel Pat Chr 15

The blue areas represent the two DNA matches Patricia and I have on Chromosome 15.

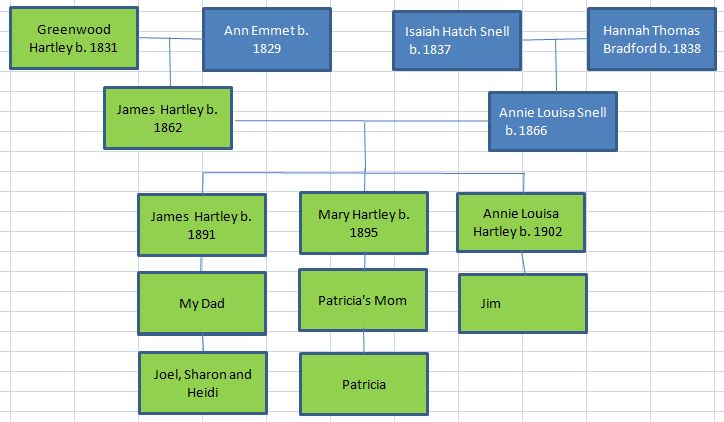
Patricia on the Hartley Family Tree

Growing up, Patricia’s grandmother was my great aunt and also one of my neighbors, my Aunt Mary.

Patricia's Tree

The bottom box in each row are the people that have tested their DNA and uploaded to gedmatch.com. I now show 3 of the 13 children of James Hartley and Annie Louisa Snell (James, Mary and Annie). I now can check how my sisters and I match Patricia’s DNA as well as how Patricia matches Jim’s DNA.

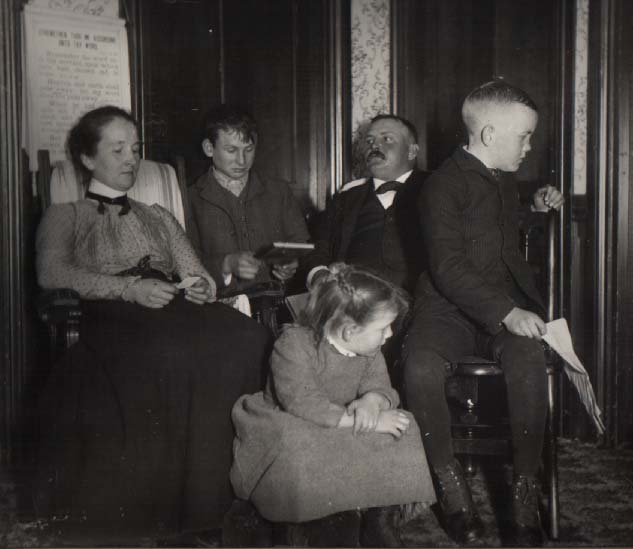
Here are my great grandparents and three of their older children.

James and Annie Hartley

It is in interesting photo. Two of the children are looking away. I think that one is my grandfather James. The mother, Annie, is looking at something in her hands. The older son Dan is looking at a book and the father James doesn’t look comfortable being dressed up.

Patricia’s DNA at Gedmatch

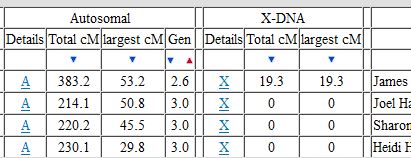
One of the basic functions at gedmatch is called ‘One to Many’. In this case, I took Patricia’s DNA and compared them to everyone else that has ever uploaded their DNA results to gedmatch. Here are her 1st 4 matches:

Patricia's 1st 4 matches

Not surprisingly, her top matches are her 1st cousin, once removed, Jim, me and my sister’s Sharon and Heidi. The Gen column lists how far away gedmatch thinks Patricia’s matches are to a common ancestor. Patricia and I are 3 generations to James Hartley and Annie Snell, so that is right. Patricia shows 2.6 generations to a common ancestor with her match to Jim. A first cousin once removed would typically be 2.5 generations, so she shares a little less DNA than average here with Jim. Patricia also shares 19.3 cM of the X Chromosome with cousin Jim which I find interesting.

The Hartley X Chromosome

I’m taking the X Chromosome out of order because I find it interesting. There is one most important thing to know about the X Chromosome. If you are a male, you get one from your mother. If you are a female, you get one from your mother and one from your father. My father only got an X chromosome from his Frazer mother, so he doesn’t match anyone further up on the Hartley line by the X Chromosome. However Patricia and Jim both have maternal matches that carry up the line.

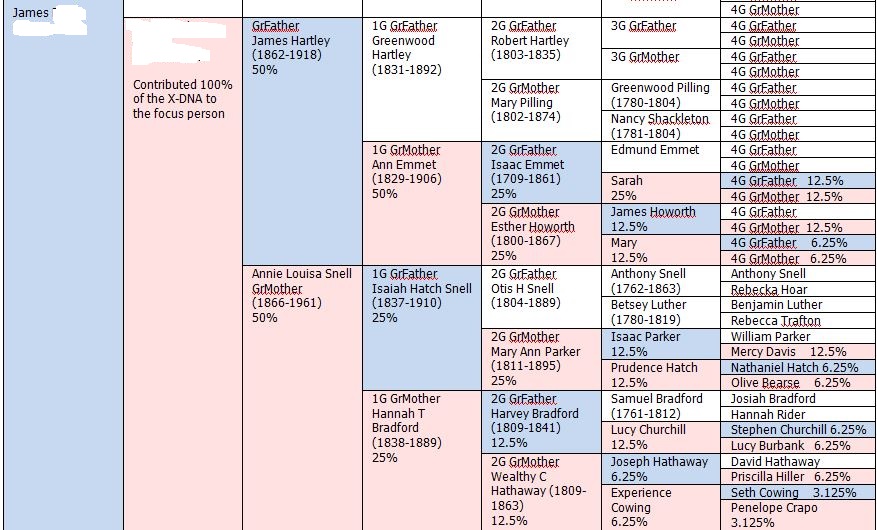
Here is how Jim got his X Chromosome from his mother and her ancestors:

Jim's X Inheritance

Jim only inherited his X Chromosome from those ancestors in pink or blue. So, for example, he got no X Chromosome from any Bradford before Harvey Bradford.

We need to compare Jim’s chart with Patricia’s X Inheritance Chart:

Patricia's X Inheritance

Here I didn’t show the X Chromosome that Patricia got from her father as this won’t match Jim. Then of what I show, only the bottom half will match Jim. This means that going back 4 generations from Patricia, she could match Jim by the X Chromosome on the Emmet, Snell or Bradford Line. One other difference between Jim and Patricia is that Jim got 100% of his total X Chromosome from his mother and Patricia only got 50%. However, that is a confusing way to put it because Patricia did get 2 X Chromosomes. So her one 50% must be similar to Jim’s 100% if that makes sense.

Here is what the X Chromosome match looks like between Patricia and Jim at gedmatch.com on their browser:

Jim Patricia X Match

The yellow part with the blue under it is where they match at the end of the X Chromosome. That is enough on my X diversion for now.

Back to the Hartley DNA Matches on the Other 22 Chromsomes

At gedmatch, I go to the Jim’s ‘One to Many’ matches to see how he matches my family and Patricia. Here are Jim’s top 4 matches. You may have already guessed who they are:

Jim's top 4 matches

Above, I said that Patricia matched Jim a little less than expected. My sister Heidi at the top of the list matches him a little more than average.

Here are Jim’s DNA matches on Chromosome 1

Pat Chr 1

  1. Me
  2. Heidi
  3. Sharon
  4. Patricia

Here Patricia has identified a new piece of DNA in green that is a Hartley ancestor that we didn’t know about before. Again, this “Hartley” ancestor may be Hartley, Emmet, Snell or Bradford.

Here is another new Hartley segment on Chromosome 2:

Pat Chr 2

Patricia matched Jim on Chromosome 2. My sisters and I had no match with Jim on that Chromosome.

It looks like Patricia got a double segment of Hartley DNA on Chromosome 5:

Patricia Chr 5

Patricia is #1 above. Where the color changes from orange to yellow likely represents a change from Greenwood Hartley to Ann Emmet DNA or Isaiah Snell to Hannah Bradford DNA.

Patricia Helping Me Map My Chromosome 7

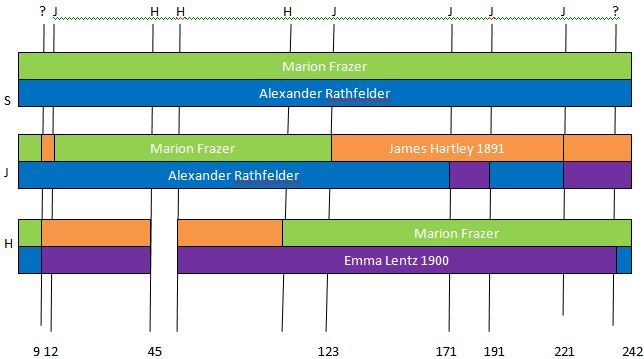
I’ve tried to map all my chromosomes as well as my 2 sisters’ to my 4 grandparents. I got a little stuck on Chromosome 7:

Chr 7 Map Pat

My chromosome 7 depiction is the one with the J to the left of it. On my paternal side (which is the blue (FRAZER) and red bar), I have the DNA I got from my dad’s mother in blue and my dad’s Hartley dad in red. Above that is the gedmatch depiction of how I match my 2 sisters by DNA and how they match each other. The bright green bar is called the Fully Identical Region or FIR. This means wherever that occurs a sibling matches the other sibling by getting the same DNA from the same 2 grandparents (one maternal and the other paternal). So in comparing Sharon to Heidi, they have that FIR from 0 to 25. It turns out that their 2 grandparents were their mother’s mother (Lentz) and their father’s father (Hartley). In the tiny section between 0 and 4, I have what is called a Half Identical Region or HIR. That means that I shared one grandparent’s DNA  with my sisters and the other grandparent I didn’t get any of their DNA. In this case I had to share either the Lentz or Hartley grandparent with my 2 sisters, but I didn’t know which.

That is where Patricia’s results came in handy. Here is how she matches Sharon, Heidi and me:

Patricia Chromosome 7

Patricia has 3 good matches with Sharon and Heidi and one tiny one with me (#3 on the Chromosome Browser). However, the tiny one is the one I need. The pink match shows that my Chromosome 7 from 0-4 (in millions) is where I got my DNA from my Hartley grandfather and not my Frazer grandmother.

Here is my completed Chromosome 7 thanks to Patricia. I extended the Rathfelder on my Chromosome 7 all the way to the left or beginning and added a small chunk of red Hartley from my grandfather.

Chr 7 complete

Another Type of Chromosome Mapping

There’s is another type of Chromosome Mapping developed by Kitty Munson. The way the Munson Mapping is generally used is to map out your relatives’ common ancestors. In the case of Patricia and Jim our common ancestors are James Hartley and Annie Louisa Snell. Here is what my new Chromosome Map looks like with the addition of Patricia’s DNA matches with me shown in blue.

New Kitty Map for Joel based on Pat

Well, that’s about enough for Patricia’s DNA for now.

Summary and Conclusions

  • Patricia shared the first Hartley X Chromosome match that I’ve seen.
  • The X tends to shy away from the male line, so Patricia and Jim’s match is more likely down somewhere in the Massachusetts colonial line rather than the English Line.
  • I would like to use Hartley DNA to break through the Hartley genealogical brick wall. Right now I’m stuck in the early 1800’s in Trawden, England. There were too many Hartleys there with the same first name to figure out who was who. Patricia’s DNA may help in finding matches to other Hartleys
  • Patricia’s DNA helped me in mapping my chromosomes in 2 different ways.


My Father In Law’s Grandparents’ DNA

In this Blog I will use a technique described by Kathy Johnston to look at some of my father in law Richard’s DNA. I will map out his 4 grandparents on Chromosome 15. These would be 4 of my wife’s great grandparents. Then I will try to figure out which grandparent goes with each segment of the mapped Chromosome.

My Father In Law and His Two Sisters

The mapping technique requires 3 siblings. My father in law tested at FTDNA and his two sisters tested at AncestryDNA. I have those results and have uploaded them to gedmatch.com.

fully identical and half identical

In the first step, I compare the 3 siblings to each other using gedmatch.com using their chromosome browser. Here is how Lorraine and his brother Richard (my father in law) match each other at gedmatch.com on Chromosome 15. I chose this chromosome because it is one of the smaller chromosomes, hence easier to map. Also I already knew there were some other cousins on Richard’s maternal side that had tested and had fairly good results with Richard on this Chromosome.

Lorraine V Richard
Lorraine V Richard

As shown in the above, Lorraine and Richard have one long match on Chromosome 15. I will use locations in millions, so I’ll say the match was from 18 to 94. This is represented by a sold blue line. According to FTDNA, the area before 18 is a SNP poor area not used for comparisons. The solid green sections are where Lorraine and Richard share the same DNA from 2 of their grandparents. These would be one maternal grandparent and one paternal grandparent. The green is also called a Fully Identical Region or FIR. The yellow area is called a half identical region. This means that Richard and Lorraine share the DNA from one maternal or paternal grandparent. The red area with no blue line below it is the area where Richard and Lorraine don’t share any DNA. However, this information is actually quite helpful. This would mean that if Richard got his DNA in this segment from his Paternal Grandfather and Maternal Grandmother, that Lorraine’s DNA would have to be from her Paternal Grandmother and Maternal Grandfather, for example. There are only 4 choices, so process of elimination can be used.

Comparing three siblings at a time

Next I line up the results of the three siblings.

Chr 15 3 siblings

I am now looking for crossovers. This is where Richard’s DNA, for example, switched from being inherited from one grandparent to being inherited from another grandparent.

Chr 15 with crossovers

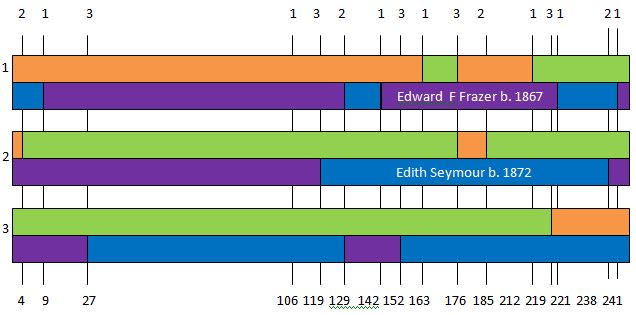
Next I look down every line to see who owns each crossover. Let’s just look at the first vertical crossover line. In comparing Lorraine V Richard, nothing is changing there as there is green on either side of the line. At Lorraine V Virginia, and at Richard V Virginia, there is a change from no match to an HIR. The one in common in those 2 changes is Virginia. So she is the one that owns the first crossover point. That means at that point (to give a number would be 27) she received her DNA from one grandparent to the left of that point and she received her DNA from another grandparent to the right of that point. We don’t know which grandparent, or whether it was on her maternal or paternal side. We do know that both grandparents on either side of the crossover are either maternal or paternal grandparents. That fact will help me as I try to figure out which grandparent Virginia got her DNA from.

Assigning crossover points

Here we will give a name to each crossover point. We are building a DNA skeleton or frame for each person so to speak. These are assigned by each persons’ initial at the bottom of each vertical crossover line below.
Assign Names to Crossovers

This tells us that there are 7 crossovers for the 3 siblings. Virginia has 3 and Lorraine and Richard have 2 each.

The chromosome map

Next I will build a Chromosome Map based on the above information. This map will be for the 3 siblings and have a maternal and paternal side with 2 grandparents on each side. [That should make sense as you think about your own family situation.] To begin with, these grandparents will be represented by 4 different colors as we won’t know which grandparent is which. Here is the bare bones skeleton:
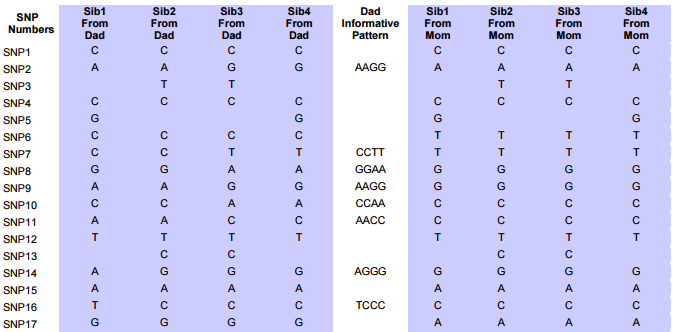
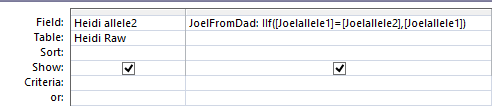
Skeleton

I kept the crossover designations on each of the vertical lines. I’ll add the 3 chromosome maps to the right of the L, R, and V on the left side for Lorraine, Richard, and Virginia. On the bottom, I have the locations on the chromosome for each crossover point. I am missing a location for the next to the last crossover line. This could be guessed or estimated based on where Virginia’s actual crossovers are later. By eye it would be about 90.

Let’s map it

Assign Names to Crossovers

I could start with any area, but I’ll start with the top left. This is the green FIR match between Lorraine and Richard. Fully identical means they both received the same DNA from the same 2 grandparents. Those 2 grandparents were one from the mother’s side and one from the father’s side. Those will be represented by green and blue.

Chr 15 First FIR

Lorraine will have one crossover preventing one of her lines (colors) from extending beyond her crossover further to the right. Richard has no crossover at this point, so his two grandparents’ DNA can extend to his ‘R’ crossover line. Meanwhile Virginia doesn’t match at either grandparent in this area, so we need to give her 2 different colors representing the DNA she got from her 2 other grandparents.

Chr 15 part 2

Due to the place I started, I’m stuck already – at least on the FIRs and no matches (green and red sections of the chromosome map).

Assign Names to Crossovers

The next step is to map an HIR. As HIRs are more ambiguous (one matches and one doesn’t) I only get one shot at guessing. Once I make one guess, then this locks in the grandparents and no further HIR guessing is allowed. Our choices for HIRs are between 27 and 35. I’ll choose Lorraine V Virginia. They are HIR between 27 and 31.

Chr 15 part 3

Now comparing L and V from 27-31, I see that their 2 green segments match and their blue and purple segments do not match. This was my one chance at guessing. I could have guessed the other way around and it wouldn’t have mattered, but at this point the colors are locked in and no more guessing is allowed. Next, Virginia has no crossovers for a while, so I’ll extend the DNA she got from her green and purple grandparents to the right to her next crossover point.

Chr 15 part 4

Next I notice that Virginia has no match with Lorraine from 31-46 and no match with Richard from 35-60. That means that Lorraine and Richard got their DNA from the opposite grandparent on their maternal or paternal side. So far, everything is relative, so the top orange and green may be maternal or paternal. We don’t know yet.

Chr 15 part 5

Scanning up from Virginia’s Chromosome 15 map from location 35 to the right, we see that Richard and Lorraine have the opposite colors. That corresponds with the no match comparisons we had in the gedmatch comparisons. We would be stuck here except for the fact that on Richard’s bar, he has no crossover at location 60. [That crossover at 60 belongs to his sister Virginia.] That means that the DNA that he got from his orange and blue grandparents can extend to his next crossover at 95.

Chr 15 part 6

Assign Names to Crossovers

Now we again are almost stuck, except that Richard and Virginia have a green FIR from 90 to 95.

Chr 15 part 7

We can then extend Virginia’s grandparents’ DNA to the right.

Chr 15 part 8

Assign Names to Crossovers

Now we truly are stuck. We only have HIRs left and I already used my one guess for those. There is a no match between Lorraine and Richard on the right hand side, as we have no DNA to go against after 95 for those 2.

Cousins to the Rescue

There is one more way to fill in these segments. That is with the matches from actual cousins. We will want to figure out which grandparents these segments go to if we can anyway by using cousin matches. First, let’s look a little at the genealogy of the cousins that have tested.
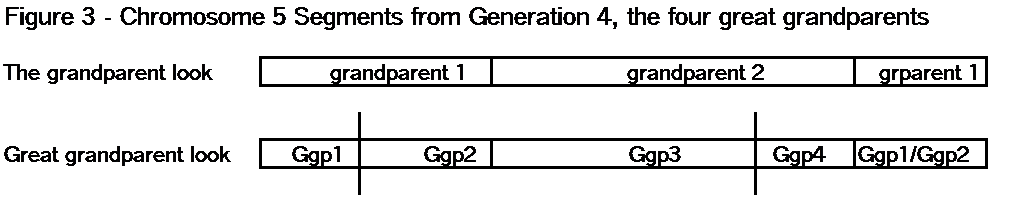
Pouliot LeFevre Diagram

In the bottom box is Richard, but I should have included his sisters Lorraine and Virginia there also. These siblings have 4 cousins that have tested on the maternal LeFevre side. Here I got a snapshot of Estelle LeFevre (b. 1905) while getting DNA from Virginia:

0306161846

There are 2 testers descended from the Pouliot Grandfather. The other 2 testers are descended from Pouliot and LeFevre. I discussed the issues in separating the DNA from those two ancestors in my previous Blog.

Pouliot LeFevre Diagram rev

Here are the 3 siblings as they match their reference cousins. The more important cousin, in a way, is Fred as he descends from the Pouliots and not the LeFevres. Note that there is no overlap between Fred versus Patricia and her brother Joseph in each comparison. That is where the crossover is occurring between the Pouliot grandparent and the LeFevre grandparent. Now for each sibling (Lorraine, Richard and Virginia) that crossover is at a different location. For Lorraine, it is at 31. For Richard, it is at 35. For Virginia, it is at 28. Now refer to the second image below. The place where all those maternal crossovers occur is on the top row of each bar between the orange and green segments.

3 sibs on Chromosome Browser to All

Chr 15 part 8

So for this try, the green represents the DNA that the siblings Lorraine, Richard and Virginia got from their Pouliot grandmother and the orange represents the DNA that each sibling got from their LeFevre grandfather.

Just to confuse things – a completed chromosome 15 map

Here is a completed Chromosome 15 that I did previously. In the version below, I started more on the right and worked my way to the left. That left blanks on the left that I was able to fill in by the actual cousins. Note that the colors are relative and are reversed for the Pouliot and LeFevre grandparents which I have labelled on this Chromosome Map:

Completed Chromosome 15 Map for 3 Siblings
what about the paternal side of the map?

The paternal side is mapped out, but I have no reference testers. These testers would ideally be 2nd cousins that are related on only one paternal line. I only need one of these 2nd cousins to identify one grandparent. Then the leftover grandparent belongs to the other side due to process of elimination. There are already likely people that have tested at AncestryDNA, but due to lack of a chromosome browser there, I don’t have where the matches are. For now I will leave them as colors or I can call them paternal grandparents 1 and 2. The actual paternal grandparents are Edward Butler (b. 1875) and Lillie Kerivan (b. 1874).

My Wife’s DNA

The DNA represented in the map above comes from my father in law’s grandparents. However, for my wife, this represents the DNA that she got from 4 of her paternal great grandparents. How could I map that out for her?

Recombination

The short and simple answer is this: My wife got her DNA from her 2 parents. That is a given. So she, like her father, Richard, has a maternal and paternal side. She will have a similar map as her father. However, now her paternal side will have her father’s 4 (or in this case 3) grandparents all on one chromosome. To make room, something has to give.

Completed Chromosome 15 Map for 3 Siblings

Here is Richard on the middle line. Note that he only received DNA from one of his paternal grandparents. As my wife got all her paternal DNA from her father (sounds obvious, but still worth stating), she will potentially only get DNA from 3 out of 4 of her great grandparents. Here I am borrowing a Figure from a very helpful blog called Segments: Bottom-Up:

segments greatgrandparents

In that Segmentology Blog, Chromosome 5 is used as an example. Here all the great grandparents are represented. Unfortunately, I have not tested 2 of my wife’s siblings. If I had, then I would have the first line which indicates her grandparents (in this case on her paternal side). The second line of the image above, shows in a generic way, the new crossovers that my wife could have for her great grandparent level.

My wife and her 2 aunts

Here is how my wife looks compared to her 2 aunts at gedmatch compared to those Aunts’ Chromosome 15 map. I won’t show the match to her father as she matches him in all places.

Marie Chr 15

Completed Chromosome 15 Map for 3 Siblings

From this, I take away that my wife matches her 2 Aunts on their maternal side. The gedmatch match between my wife and her Aunt Lorraine shows a break at 31 which corresponds to Aunt Lorraine’s maternal side. Likewise my wife’s second match with her Aunt Virginia starts at 60 which corresponds with Aunt Virginia’s maternal start of her switch from Pouliot DNA to LeFevre DNA. When I merge these 2 results together, it looks like the Chromosome map for Richard, above with a crossover break at 35. This makes sense, as my wife got her paternal DNA from her dad. If I was making a Chromosome map for my wife, it would include her 2 great grandparents: Martin LeFevre b. 1872 and Emma Pouliot b. 1874. Her Chromosome 15 Map would look like her father’s up to location 95. After that point it may also be the same as her father’s, but I don’t believe that I can prove that.

It is beginning to look like there may have been no recombination for my wife on Chromosome 15. So far, we have not seen any room in Marie’s DNA for the purple paternal DNA that I mapped out for Richard above.

Enter cousin John

Recently, my wife and I contacted her cousin John at AncestryDNA. He kindly uploaded his DNA to gedmatch. I said that I would use his DNA for research. Then I thought, “Now how am I going to use his DNA for research?” Here is one way. We will look to see how cousin John matches his Uncle and 2 Aunts at Chromosome 15.

John Chr 15

These red and yellow show us that Cousin John likes to eat at MacDonalds. Not really. It does show:

  • coverage of the entire Chromosome 15 from position 18 to 100.
  • one large match with Richard. This would correspond to Richard’s paternal (Irish) side
  • the match with Lorraine could correspond with her paternal side also in the purple area on my Chromosome 15 map above.
  • The 2 matches with Virginia could also be on her Paternal (Irish) side in the blue and purple segments
  • If I were to make a Chromosome 15 map for cousin John, it would be more complete than my wife’s. It would be filled in with 2 great grandparents on his father’s father’s side.

I think I will make a great grandparent Chromosome 15 Map for my wife and her cousin John, but only because this is my 50th genetic genealogy blog. This map will just be for my wife and cousin John’s Paternal side of their Chromosome 15.

Map John Marie

It is a somewhat unusual chromosome map as there are only 2 great grandparents mapped for each cousin. My wife inherited the DNA from her dad’s maternal grandparents  Her cousin John inherited his DNA from his dad’s paternal grandparents. The part in the upper right corner should probably been left blank as I have only implied Pouliot DNA there.

further deductions

I have shown that it looks like my wife matches her dad on his Maternal Side. It looks like my wife’s cousin John matches his Uncle and 2 Aunts on their Paternal sides. Remember, I am talking about great grandparent matches, so I am going back a bit. The question is, should my wife match her cousin John on Chromosome 15? I would say no. Let’s look. Here is my wife’s matches in the area of Chromosome 15 down to a level of 3 cMs:

Marie and John

As you can see, there is no Chromosome 15 match. From that I can imply, but not prove, that my wife’s Chromosome 15 after position 95 is the same as her father’s and that she inherited her father’s mother’s Chromosome 15 intact.

To Recombine or not to recombine?

The smaller Chromosomes have less of a chance of recombining.  Chromosome 15 has 100 cMs which means on average there should be exactly one crossover per Chromosome 15. Lorraine had one crossover on each of her Chromosomes 15 (maternal and paternal). Richard had 2 maternal crossovers and no paternal crossover so he meets the average. Virginia was an overachiever with 2 maternal and one paternal crossover for an average of 1.5 crossovers. My wife’s father inherited his father’s Chromosome 15 intact, so had no recombination there. Likewise there may have been no recombination from Richard down to my wife on this chromosome.

Summary and Conclusions

  • Kathy Johnston’s method of DNA analysis worked well on my father in law and 2 siblings to find the DNA they inherited from their grandparents who were born between 1872 and 1875.
  • This method worked especially well for the maternal side as there were reference points aka my father in law’s maternal cousins who had tested for DNA. For these segments with matching cousins, I could assign specific grandparents which contributed to my father in law and 2 siblings’ DNA.
  • The segments that my father in law’s family inherited from their grandparents’ Paternal Irish side is defined and in place. However, those segments are awaiting specific names. Once further testing is done or existing testing is uploaded to gedmatch.com, then these names should be made clear.
  • This exercise on Chromosome 15 may be repeated for the other chromosomes.
  • This exercise showed two instances where recombination did not take place and another instance where it probably did not take place.
  • I would know more about my wife’s DNA if I had 2 more siblings’ DNA results.
  • I have been neglecting my wife’s DNA results as I had other test results from her older relatives. I need to update her FTDNA and gedmatch.com matches. This may give more clues on how she inherited her great grandparents’ DNA from her father.
  • A cousin who has tested was used to triangulate between the 3 siblings and my wife to check the work.
  • Based on the results of the 3 siblings Chromosome Mapping, maps can also be made for the children of these siblings. For the children, the mapping would show which great grandparents they received their DNA from.

Slimming Down My Big Fat Chromosome 20

In a previous Blog, I mentioned My Big Fat Chromosome 20. I had discovered, for some reason, that more than one half of all my matches were on this Chromosome. This can be seen visually using a Swedish web site called dnagen.net.

dnagen circle chart

Here the default setting is at 200%. That means that only the matches that are twice as large as the median are shown. This program uses FTDNA matches. The match names are on the outside of the circle and the lines going between the names are what FTDNA calls ICW or (In Common With). I just noted today that there is a group on this circle that doesn’t connect with others at about 9 o’clock on the circle. These matches like to stay in their own Chromosome apparently. They are in a dark color which I take to be Chromosome 3. However, that is an aside.

The real point is to show Chromosome 20 in the dark green in the lower right half of the circle. Chromosome 20 is the Hong Kong of Chromosomes. In a little space, I have  lot of matches. Remember that Chromosome 20 is one of the smaller Chromosomes. If I have about 4,000 matches, that means that over 2,000 of them are on Chromosome 20. In my previous Blog on Chromosome 20, I determined that these matches were on my Frazer grandmother’s side. Her 2 parents were born in Ireland. That means that these matches represented Irish matches and not Colonial American matches as I had previously assumed.

The Progression of Sorting Matches

Autosomal DNA matches may be grouped in different ways. When I first tested, I got a bunch of matches at FTDNA. I didn’t know who any of them were. FTDNA had suggested some relationships which were mostly optimistic. Here is some of the progression of how I have sorted my matches:

  1. Sorted by projected relationship or match level (cMs)
  2. Sorted by actual relationship if known
  3. Sorted by Chromosome. This option is not available at AncestryDNA. One has to upload the AncestryDNA results to gedmatch for this option. This is when I discovered all my Chromosome 20 matches.
  4. Sorted by Triangulation Groups. By using a Tier 1 option at Gedmatch or by finding by hand all the matches that match each other at a particular segment, I was able to find many Triangulation Groups (TGs)
  5. Sorted by Maternal or Paternal. All our valid DNA matches should match on either the maternal or paternal side. Once I tested my mother, I was able to phase my results at gedmatch and find out whether I matched other testers on my mother’s side or my father’s side. This was a big breakthrough for me. This cut down a lot of frustrating searches. For example, there are a lot of people that match my mother that have Frazer or Fraser ancestors. My Frazer ancestors are on my father’s side. Therefor, I knew that when looking for Frazers, I could eliminate all my mother’s matches who had them as ancestors and not worry about them.
  6. Sorted by other known matches. I had my father’s 1st cousin tested. This got to the level of my great grandparents on my Hartley side. However, it didn’t tell me which great grandparent. My Hartley great grandparent was a relatively recent immigrant from England. My non-Hartley great grandparent had ancestors going back tot he Pilgrims in Massachusetts. I also had other relatives tested and found other matches that I knew I was related to.
  7. Another breakthrough happened after I had my 2 sisters tested. I used a method by Kathy Johnston to find out where you got all your DNA from your 4 grandparents by comparing your DNA results to 2 siblings. This method worked pretty well on most of my chromosomes. Now I knew where the DNA was coming from at my grandparent level for most of my matches. When I had a match, I could check my map to see which grandparent that match belonged to.

That is about where I left it at my last Blog on Chromosome 20. I looked at my crossover points for Chromosome 20. Here are my sisters compared to each other and to me:

Chr 20 Crossovers

Here is how I used the above comparison to map my grandparents that gave me my Chromosome 20 segments. The blank parts are half identical and ambiguous, so rather than guessing, I left them blank. For example, on Sharon’s row on the top, either the orange goes to the left and blue starts at the lower half or the opposite: the purple continues to the left and the green starts at the crossover line.

Chr 20 Final Segment

My chromosome 20 is on the bottom. At the time I wrote my previous Blog on Chromosome 20, I discovered that the vast majority of my matches were due to my Frazer side (green) and not my Hartley side (orange). This was a surprise as my Hartley grandfather had a mother with American Colonial roots. The final point of my previous blog on the subject was:

The fact that all these matches are on my Frazer line doesn’t necessarily mean that they are Frazer matches. They could be McMaster, Clarke, Spratt or any other known or unknown ancestor of my Frazer grandmother.

It’s great that I now know that most of my Chromsome 20 matches are Paternal and that they are on my Frazer grandmother’s line. But I am still curious as to where they are coming from. Can I find out more? I would like to try.

Chromosome 20: Beyond Grandparents

One advantage I have is that I am working on a Frazer DNA project with 27 testers. There are 2 lines of Frazers. I am on the Archibald Line and there is another line called the James Line. These 2 lines are somewhat distantly related as these 2 brothers were born in the early 1700’s. Here are the matches for the project on Chromosome 20:

Chr 20 Matches

All of these matches involve at least one James Line tester which I am not on. The 2 major matches between the Archibald Line and James line are between myself (JH) and my sister (SH) on the Archibald Line and Bonnie (BN) on the James Line. As I show below, even my McMaster Line has Frazers in it, which could be the source of that match. Sharon had very few Chromosome 20 matches compared to her siblings Heidi and myself. The 1,000 plus matches I had were before the 47 million mark where I match Bonnie above. My mega-matches mostly occur on Chromosome at 44,000,000 (End Location) or before. This tells me that my mega-matches are not of the Frazer surname. If they were, I would have seen some of my closer Archibald Line matches on Chromosome 20 from the Frazer DNA Project.

Enter cousin paul

Paul is my second cousin once removed who tested for DNA. His great grandparents are my 2nd great grandparents: George Frazer and Margaret McMaster.

George Frazer Tree

When I compare myself to Paul, I get to either the Frazer or McMaster Lines. This will eliminate the Clarke line of my great grandmother and her Spratt mother as they are not in Paul’s line – only mine.

My McMasters: It’s a Bit Complicated

Here is my McMaster Line going back from my Frazer grandmother.

McMaster Ancestry

Not only did 2 McMasters marry each other, one of them had a Frazer mother! Marion Frazer is my grandmother, so she is 2 generations from me. Margaret McMaster is at 4 generations. James and Fanny McMaster are at 5 generations to me. Their parents (the left-most McMasters above) are at 5 generations out from my cousin Paul and six generations from me. This is useful to know in the Generations Estimate I have below.

Here is where the Frazer/McMaster split is.

Frazer Buggy

George Frazer b. 1838 is on the left and Margaret McMaster b. 1846 is on the right. The photo was taken in Ballindoon, Ireland in front of the Frazer family home.

At Gedmatch.com, I compared Paul and myself at:

People who match one
or both of 2 kits
Updated

I chose most of those that matched both Paul and me. I left out an apparent duplicate and one who is anonymous for now. I also left out my 2 siblings. With those results, I chose the Traceability option and got this chart:

Generations Paul Joel

Those in red are in the Frazer DNA Project. We know their genealogy. Gladys descends from the couple above George Frazer and Margaret McMaster. Michael and Jane descend from one level above that. The circle above are those that are related to Paul and me, but not to others in the Frazer DNA Project. [One exception is Jane, but she matches at generation 7 which is about as far out as Gedmatch goes. This may or may not be a real match.] If those in the circle are not Frazer, then the apparent conclusion is that they are McMaster relatives.

Back to chromosome 20

See all the Chromosome 20 matches on my Gedmatch Traceability Report:

TG Chart Chr 20

Remember I said that my 1,000 plus matches on Chromosome 20 ended around 44M? This is what the above shows. It also shows a triangulation of matches. This triangulation is also implied by the cluster of matches within the circle of the Generations Estimate Chart above. The Chromosome 20 Triangulation Group (TG) includes:

  • Myself
  • *S. S.
  • Daphine
  • Feeney
  • Gladys

Now Gladys should not be in this list as she is in the Frazer DNA Project and has no known McMaster ancestors. In fact, when I run the ‘one to one’ at Gedmatch, she doesn’t match the others in the above list. There are glitches in the Traceability Report, so caution is needed. I will take out the last 3 names in the Generations Estimate to simplify the results. Unfortunately, that didn’t fix the problem, so I had to take out Gladys from the Frazer Project (sorry Gladys).

Gen Est Paul Joel

Now my presumed McMaster relatives are in the green circle. Here are the improved and simplified matches:

TG Chart Chr 20

I note now that the 2 ‘M’ kits (indicating 23andme testers) are now matching each other which is what I had expected previously. Note that I left my previous Traceability results in the blog as a warning that the Traceability utility is glitchy. Actually the new report is not indeed improved as now Michael from the Frazer project is matching my presumed non-Frazer McMasters. I took out Michael, and then Jane from the Frazer Project developed similar bogus matches with those she is not related to!

I’ll have to take out all the other Frazer Project people out for this Traceability to work. This was supposed to have worked so smoothly. Here below Joel and Paul should be the remaining McMaster relatives:

Joel Paul R3

Here is the Chromosome 20 TG. Note that Paul is not in it, but he matches others from the TG in other Chromosomes:

TG Chart Chr 20

This chart is only mostly right. Paul’s green match is actually on Chromosome 19 rather than 15:

Paul's Actual Match with Edge
Paul’s Actual Match with Edge

Here is the globe view of my proposed McMaster relative TG:

McMaster Globe

The colors in the lines correspond to the colors in the chart above. The light blue lines are the Chromosome 20 TG from my “big fat” area. The blue lines indicate a TG as they go from each of six people to the other 5. The gray lines represent multiple matches. I am at the bottom of the globe and my cousin Paul is to my right. He is not in the blue TG on Chromosome 20, but matches all my matches on other chromosomes at least once.

Conclusions and Further Research

From what I have shown above, I feel like I have found my McMaster relatives through DNA. However, these would have to be verified by genealogy. None of my proposed ‘McMasters’ have any gedcoms at gedmatch.

  • Daphine – she is on FTDNA but with no tree and no ancestors mentioned. An ICW search reveals 59 pages of matches – likely mostly on Chromosome 20.
  • Edge – He is at FTDNA. He has a limited tree. His paternal grandmother may be a lead. He has only 52 pages of in common matches at FTDNA
  • John – A search at 23andme showed nothing. Perhaps he is anonymous there.
  • Feeney – Same result – or perhaps these people are using different names?
  • *S.S – I see an S.S at Ancestry, but it is difficult to tell if it is the same person.

I have McMaster connections through DNA and genealogy at AncestryDNA, but there is no way to tell if the connection is on Chromosome 20 without a chromosome browser. My Mcmaster matches at AncestryDNA either don’t know how to upload their DNA to gedmatch, aren’t interested or haven’t gotten to it.

Opposition to TGs

Of late, on Facebook, there has been questioning as to the validity of  TGs – especially large TGs like I have at Chromosome 20. The thought is that no common ancestors will be found as there are just too many common ancestors in these large TGs. I have not explained the 100’s of matches in my Chromosome 20 TG, but I have shown 5 people that match both myself and my cousin Paul. These 5 by DNA do not have obvious Frazer ancestry and appear to be in my McMaster Line. So I suppose we have a stalemate. I cannot prove at this time (except to myself) that my Chromosome 20 TG matches are McMaster relatives and those who are not in favor of large TGs cannot prove that these matches are not McMaster relatives.


Mapping My DNA To My Four Grandparents

I was thinking of calling this Blog “Kathy Meet Kitty“. Kathy is Kathy Johnston who taught me how to map my ancestral segments by comparing my DNA to two of my siblings’ DNA results and determining our crossover points. The crossover points can then be used to map out which grandparent you got your DNA from without having to physically test those grandparents. This is quite convenient as all my grandparents have been gone for quite a while. Kitty is Kitty Munson who has developed a Chromosome Mapper here. I have not seen a blog using Kitty’s Chromosome Mapper to map ancestral DNA segments via Kathy Johnston’s method, so I thought that I would write one. Kathy’s method is posted here.

Two Types of Segments

There are two types of segments, thus at least two types of segment mapping. This concept is best explained at the Segmentology Blog in an article appropriately called, What is a Segment?

ancestral segments

That Segmentology article first mentions ancestral segments. These are the segments that Kathy Johnston knows how to map. I have written many blogs about mapping my ancestral segments using her method. Ancestral Segments are the segments that you actually get from your ancestors. They fill up all your DNA. Here is an example of the ancestral segments that I have mapped to my four grandparents.

Joel Segment Map

Look at Chromosomes 1, 5, 6 and 7 for starters. This shows all my DNA filled in. The 2 paternal grandparents are on the top half of the chromosomes in blue and grean and the maternal two grandparents are on the bottom in red and peach color. The DNA I received alternates between one grandparent and another and fills in all the area. In fact, that is the process of recombination and can be seen in the Ancestral Segment Maps.

shared segments

These are segments that you find at gedmatch.com for example. These are our DNA matches. These matches may have a proposed relationship based on how much DNA you and your match share. Here is an example of some of my matches using Kitty’s Chromosome Mapper.

Chromosome map 4 Apr 2016

The best way to fill in a map like this is by testing as many relatives as possible. Now look at chromosome 1, 5, 6, and 7 on the shared segment map compared to the ancestral segment map above. The ancestral segment map on Chromosome 1, for example,  shows how much DNA I actually got from my Hartley grandfather. The blue in the Shared Segment Map shows how much I matched my father’s cousin. Next look at the maternal (bottom) part of Chromosome 1. Here the Rathfelder and Lentz matches on the right hand side are filled in on the Ancestral Segment Map. However, there is an additional section of Lentz on the left hand side of the Ancestral Segment Map where I don’t even have a match. I can tell I got my DNA there from my Lentz maternal grandmother. That is due to the crossover points I have and the fact that the DNA you get from your grandparents alternates between grandparent. On the maternal side, the alternation is between Rathfelder and Lentz.

If you find any inconsistencies between my Ancestral Segment Map and my Shared Segment Map, that means I messed up somehow.

More Ancestral Segment Mapping: Sister Heidi

In order to map my ancestral segments, I needed two siblings, so I used my two sisters, Heidi and Sharon. Here is Heidi’s ancestral DNA mapped out:

Heidi Segment Map

A few observations:

  • The areas of pale blue are where I had trouble figuring out how to map the ancestral segments, so nothing is mapped in these areas. I may have mapped out some of the segments, but then had difficulty telling whether they were maternal or paternal due to lack of known cousins that had tested. So I left these areas blank
  • The maternal areas shown as MG1 and MG2 – For these areas, I knew I had two maternal grandparents but I wasn’t sure which was which. Again based on lack of known cousins that had tested. I could perhaps guess, based on actual matches I had in these segments or where those matches were from, but I noted where the crossovers were and left these grandparents un-named.
  • These unknown grandparents are consistent within each chromosome and each sibling within each chromosome, but they are not consistent between chromosomes. So the unknown MG2 in Chromosome 8 may not be the same MG2 in Chromosome 11.
  • In my (Joel’s) Ancestral Segment Map, I don’t show any DNA on my paternal side for the X Chromosome. That is because males don’t get an X Chromosome from their father.
  • Heidi shows that she got her paternal X from her dad’s mom – a Frazer. Further, that chromosome did not appear to recombine. That means that she got that whole chunk from one of her great grandparents on the Frazer side.

How Do You Know What You Are Finding If You Don’t Know Where To Look?

These maps are very helpful in showing you where to look for DNA. Many people have matches that have ancestral names that are common to us but are not related. For example, my mother has matches with people that have Fraser or Frazer ancestors. I am related to Frazer on my father’s side. That means that I can forget about following up on maternal Frazer matches.

  • If I do want to look for Frazers, I need to look in my green areas (or my sister’s green areas) which is on her paternal side.
  • My sister Heidi is in an important Frazer Triangulation Group on her Chromosome 1 on the right hand side. She triangulates with others in a Frazer DNA Project I am working on. I am not in that group. Look at my Chromosome 1. It is nearly all covered by Hartley DNA. That explains why I don’t match these other Frazers at standard thresholds.
  • What if we were to want to look for Lentz ancestors of Heidi? We need to look at the red areas. Chromosomes 1, 6, 9. 14, 20, and 22 would be a good place to look. Fortunately, I also have Heidi’s matches on a spreadsheet. They are mostly divided by maternal and paternal matches. My mother has been tested for DNA. Based on that, I have Heidi’s phased maternal and paternal results and her matches to each of those results using Gedmatch.com.

Finally Sharon

My sister Sharon completes the Ancestral Segment Mapping:

Sharon Segment Map

  • The autosomal DNA that is missing on Sharon’s Map is the same for her 2 siblings. This is because Kathy Johnson’s ancestral segment mapping technique compares the siblings to each other using the Gedmatch.com chromosome browser.
  • Sharon has a lot of Frazer DNA match potential at Chromosomes 1, 8-12, 15, and 22.
  • However, Sharon is also not in the Frazer Triangulation Group in Chromosome 1 on the right hand side. In that particular section, she got her DNA from her Hartley paternal side.
  • The above point shows why it is important to test siblings.
  • Heidi and Sharon both have a large match (50+ cM) with someone on their X Chromosome. This person also has autosomal matches with my sisters and others in the Frazer DNA project.

Summary and Observations:

  • Ancestral Segment Mapping can be useful in determining which grandparent your matches match.
  • I know already whether my matches are on my maternal or paternal side. However, this goes back one more generation and further sorts my matches to grandparents. This cuts down the guessing by another half.
  • The maps also point out the areas where you can’t be as sure as to which grandparent your matches match as those areas are not mapped yet.
  • Ancestral Segments should line up with Triangulation Groups
  • Ancestral Segment Mapping can show matches that are Identical by Chance (IBC) or false matches.


Mapping All My Frazer DNA

Thanks to a technique pioneered by Kathy Johnston, I have been able to map my DNA to my 4 grandparents. In the process of doing this, I can see where my 2 sisters got their DNA from also. One of those 4 grandparents is my father’s mother who was a Frazer. Both her parents were born in Ireland, so that helps in finding matches. I thought that it would be interesting to look at each of the Frazer DNA Project member’s matches to my family to see where they are on my family’s DNA maps.

The larger Chromosomes are the most difficult to map, as there are more potential segments and crossovers. The segments are the chunks of DNA we got from each grandparent. The crossovers are the vertical lines between the segments where the DNA we got crosses over from one grandparent to another.

Chromosome 1

I’ll spend a little more time on Chromosome 1 as it is the first.

Chr1 Frazer

  • The colors will not be consistent to a name between chromosomes. Also the position of the my and my sister’s chromosomes may not be the same
  • S and H are my sisters Sharon and Heidi. My bar is in the middle here (J)
  • The orange in this Chromosome is Frazer and represents my Frazer grandmother.
  • The numbers in the bars represent reference people. For Frazer, my reference is usually Paul, my 2nd cousin, once removed. However, I also used Jane above in this example
  • Note that if I had not tested my sisters, my chances for matching other Frazers would be very low for Chromosome 1. I couldn’t match a Frazer for most of this Chromosome. I would only be able to match another Frazer at either end.
  • When the 3 orange Frazer segments in my family are put together, we can potentially match a Frazer for the whole length of the Chromosome – except between 186 and 205.

The Triangulation Group (TG) in Chromosome 1

I’ve pointed this out before. The TG is to the right of the Chromosome and only my sister Heidi is in this TG.

TG Chr1 Frazer

Note that the first match in the TG above between MFA and Jane goes beyond where my sister Heidi could match a Frazer (198-205). This is fine as MFA and Jane have their own crossover points that are different than those in my family.

Chromosome 2

Here I’ll start with my spreadsheet matches.

Chr 2 Frazer

What might I expect here? Note that the matches are only with my 2 sisters. My guess is that I won’t have Frazer mapped on my Chromosome in these 2 areas (196-222). Also note a match with Jonathan who is on the more distant James Line of the Frazer Project. In addition, my sister’s matches with PF overlap by a small amount her match with Jonathan. This could be significant if this forms a Triangulation Group.

Here’s my family’s Chromosome 2

Chr 2 Frazer Feb

I had a little problem with this one, but it’s mostly right. Here the colors are switched, so Frazer is now green.

  • Notice that my 2 sisters, S and H have Frazer segments from at least half way through their Chromosomes to the end. This is where the matches are (195-221).
  • Notice that between me and my sisters, we should have good coverage for Frazer ancestor matches.
  • I (J row) cannot match any Frazer where my sisters matched as I have orange Hartley DNA in the area of 195-221.

Here is Jonathan’s family mapped out. He is on the horizontal line 1. Only Jonathan can match my 2 sisters from 142 to 221. His 2 sisters are on rows 2 and 3.

Chr 2 Jonathan

Any Triangulation Group?

It would be interesting if there was a triangulation group between these 2 distant lines. So far, we have not had much luck in finding one for Jonathan’s James Line. Perhaps we have one here. This is what Gedmatch shows for Sharon’s match with Jonathan in yellow and Paul in blue:

Sharon Chr 2 Gedmatch Browser Paul Jonathan

In numbers, Gedmatch also shows where the small overlap is with these 2 segments:

Chr 2 Sharon Paul Jonathan

The overlap is shown in the last column. The yellow (Sharon’s match with Jonathan) and blue (Sharon’s match with Paul overlap from 205 to 207. Let’s see what Heidi’s matches show:

Chr 2 Heidi Paul Jonathan

Here the overlap is pretty much the same, but is a bit shorter for Heidi.

So for a Triangulation Group, Jonathan would also have to match Paul. I would expect this to be a small match, so I bring down the gedmatch numbers. This is a bit controversial, by the way, but I think I’m on fairly solid footing here. I took the limits way down to 3 cM. Here are all the results of the match between Jonathan and Paul, but I’m really interested in Chromosome 2:

Jonathan V Paul 3cM

To me, it is more than mere coincidence that Jonathan and Paul match at the exact place where they have an overlap in my 2 sisters’ matches. In all 3 cases, the match is between 205 and 207 on Chromosome 2.

Is This the First James Line Triangulation Group (TG)?

Yes and no. What I mean is that this is not strictly a James line TG but a TG between the James Line and the Archibald Line of the Frazer DNA Project. We have what we need for a Triangulation group. Paul matches Sharon and Heidi. Jonathan matches Sharon and Heidi, and Paul matches Jonathan on the small segment where he needs to match him in order for there to be a TG.

A triangulation group should represent a common ancestor. But who is the common ancestor? I can think of 3 possibilities:

  • The common ancestor of the Archibald and James Lines. This is based on the known genealogies. This common ancestor probably goes back to the late 1600’s.
  • A more recent unknown James Line ancestor. I have an additional line of Frazers that I haven’t placed that may be part of the James Line. This would be a good candidate.
  • A common collateral family. That is, a common family that married into both of our families with a common ancestor. This would be the least known option.

Chromosome 3

Chromosome 3 should be simpler. There is one Frazer match with my family. That is between Heidi and Cathy. Cathy is a a descendant of Archibald Frazer b. 1802 and Catherine Parker.

Chr 3 Heidi CR

This is a small single match, so possibly not even a valid match. Let’s look to see if  this match is in a spot where Heidi got Frazer DNA from her grandmother:

Chr 3 Heidi

It looks like this match is in the about the only area where Heidi (row H) could’ve gotten any Frazer DNA match. Recall the match is from 15-21. But shouldn’t Sharon in the S Row also match Cathy in her purple Frazer segment? Actually, she does. I’m working from 2 spreadsheets and only had Sharon’s match on one of the 2 spreadsheets.

Chr 3 CR Heidi Sharon

See, the DNA corrected my oversight!

Chromosome 5

There weren’t any Frazer Project matches to my family on Chromosome 4 that I had recorded. Here is the match between my sister Heidi and our 2nd cousin once removed Paul. He also matches my sister Sharon at the same spots.

Chr 5 Paul Heidi

My prediction is that the map should look like the one for Chromosome 3 in the first part of the Chromosome. Chromosome 5 is another Chromosome that I found difficult to map:

Chr 5 Heidi Sharon Paul

Note that I didn’t get a lot of Frazer in my Chromosome 5 (last row J). There is also a section from 107 to 173 where there would be no Frazer matches with me or my sisters. Perhaps if I tested another sibling….?

Chromosome 7

Here I see a smattering of matches. I included my fairly close Frazer relative Paul as a reference even though he doesn’t match my family on this Chromosome.

Chr 7

Here, none of these matches come together. What does the Chromosome map show?

Chr 7 map

As with many of my maps, I have different version as I have tried to perfect them. But something looks wrong here. Either the map is wrong or my matches above are wrong. Sharon should have a Frazer match with Jane at 99 to 107, but that is showing as blue which in this case is my non-Frazer Hartley side. I had one other case where one of the Frazers matched on my mother’s side. After lowering the thresholds a bit, I got this match between my non-Frazer mother and Jane:

Chr 7 Jane Gladys+

That means that Jane either matches one of my mother’s ancestors way back or is identical by state or by chance in this area. But what about the match between my sister Heidi and MFA of the Frazer DNA Project? I lowered the thresholds a bit again at Gedmatch and checked to see if MFA also matched my mother.

Chr 7 MFA and Gladys

Oh, my. It seems like everyone is related to everyone! Welcome to the family. Actually, if MFA and Jane were to be related to my mom, it would make more sense on her orange Lentz side (which is where they do indeed match). That is the side where my mom has a grandmother from Sheffield, England. The green side would make less sense at that is primarily German and specifically Germans that lived for many years in a colony in Latvia. Well, at least I don’t have to revise my Chromosome 7 map.

Chromosome 9

I see one lone match between my sister Sharon and my cousin Paul.

Chr 9 Sharon Paul

Chr 8

That makes sense. Sharon is the only one with Chromosome 9 Frazer DNA in my family. As no other Frazers in the Project appear to match here, I can assume that this match is on my McMaster side. Paul and Sharon share a Frazer ancestor that married a McMaster, so half our shared DNA could be on the McMaster side coming down through our respective Frazer lines.

Chromosome 10

Chr 10

Chr 10 Map

Out of curiosity, I checked to see if my sister Sharon would match Paul on the first bar (S) if I lowered the Thresholds. She did between 6 and 9 (top left green segment). Again, this could be McMaster DNA.

Chr 10 Sharon Paul

Chromosome 12

This Chromosome has been discussed before as it is part of a TG.

Chr 12 TG

Chr 12 TG Map

Here are few more [probably McMaster] segments that are matches between cousin Paul and my family:

Chr 12 Paul matches

Chromosome 14

My sister Heidi has a small match with Charlotte of the James Line.

Heidi Charlotte Match

I don’t know if it is a valid match, but it falls in the right area of Heidi’s chromosome.

Chr 14 map

Chromosome 17

Here I have a lone match with MFA

Chr 17

Chr 17 map

Looks like I’m the only hope for Frazer matches in this Chromosome. As the chromosomes get higher in number, they get shorter. The shorter chromosomes have fewer segments and are simpler than the longer lowered numbered chromosomes.

Chromosome 20

Here I am again with Bonnie from the James Line:

Chr 20

I wrote a whole blog on this Chromosome on January 12, 2016.

Chr 20 Map

I have a bit to finish on this Chromosome. Note that Bonnie’s match with me on the bottom bar fits in from 47 to 54. It seemed like Sharon should match Bonnie also. I looked more closely at my spreadsheet and she was there. Here is what gedmatch shows.

Sharon Bonnie

Chromosome 21

My sister Heidi matches Cathy. These 2 also matched at Chromosome 3 above.

Chr 21

Here I have a problem.

Chr 21 map

I have some nice colors but no grandparents named. I don’t have enough cousins that match me on this short Chromosome to identify which grandparent is which. But maybe that’s OK. When I check to see if Cathy matches with Heidi’s paternally phased DNA (that is, her Frazer side) there is no match. Cathy matches Heidi’s maternal, non-Frazer side (or is Identical by Chance).

Heidi Cathy Maternal

So either way, this is not a good match for the Frazer project. However, this is a good thing to know. This does not invalidate the match Cathy did have with Heidi at Chromosome 3.

Chromosome 22 (Last One)

There are just a few small matches in our family with cousin Paul left. They are small, and likely to represent the McMaster side of our ancestors. These McMasters apparently lived parallel lives to the Frazers in bordering County Sligo. Perhaps they came to their particular area of Ireland for the same reasons as the Frazers and stayed or left for the same reasons.
Chr 22

Finally, the last map.

Chr 22 Map

Summary

  • I have listed every known Frazer match to myself and my 2 sisters in the Frazer DNA Project
  • These matches were checked against my Chromosome maps to make sure they mapped to the correct Frazer grandparent
  • In some cases, the Frazer matches were found not be Frazer matches at all because they matched my non-Frazer mother
  • One pleasant surprise was finding an additional Triangulation Group at Chromosome 2. This TG was between the 2 main Frazer Lines in the DNA Project: The Archibald and James Lines.


Analyzing Chromosome 15 of a James Frazer Line Family

This is part of the Frazer DNA Project. For those descending from 2 brothers who were in North Roscommon in the early 1700’s. The younger brother was James and the older was Archibald. Joanna has 2 of her siblings tested for autosomal DNA. That means we should be able to figure from which of her 4 grandparents most or all of her family’s DNA comes from. This is using a methodology developed by Kathy Johnston. I previously looked at Joanna’s family’s Chromosome 22 in How a Maternal DNA Match May Shed Light On a Paternal Match. These Chromosomes were chosen for 2 reasons:

  1. They are Chromosomes where Joanna recently got a known relative’s matches on one of her non-Frazer grandparent’s side.
  2. They are Chromosomes where there were already matches in the Frazer DNA Project to at least one known Frazer relaive.

Rather than do this analysis and email the results to Joanna, I thought that I would do the analysis in a blog.

Joanna’s Chromosome 15: Three Siblings Compared

First, I go to gedmatch and compare Joanna’s three siblings to each other: Jonathan (1), Janet (2) and Joanna (3).James Line Chr 15

Here green is a Fully Identical Region (HIR), red is no match, and yellow is a Half Identical Region (HIR). Janet and Joanna match as a HIR for the whole length of Chromosome 15 That means they will share one granparent’s DNA for the whole Chromosome 15. Next I add the crossover points for all 3 and assign one person to each. This is the person that appears in 2 out of 3 of the crossovers. Well, here is something I haven’t run into before. All the crossovers belong to Jonathan (1):James Line Chr 15 Crossovers

There are 3 crossover points. They are between Jonathan and Janet and Jonathan and Joanna. The one in common with those crossover comparisons is Jonathan. That is complementary to the fact that there are no crossovers in the comparison between Janet and Joanna. Next we change this comparison into a Chromosome 15 map where we will look at the 4 grandparents that contributed DNA to this family. The 1, 2, and 3 below on the left stand for Jonathan, Janet, and Joanna. Jonathan and Janet have an FIR in the first segment. That means that they both got the same DNA from the same 2 grandparents – one on each side of the maternal/paternal split. That split is represented by the horizontal line between the 2 colors. So for Jonathan’s Line 1 and Janet’s Line 2 we add two colors representing these same 2 grandparents’ DNA that Jonathan and Janet inherited:

JL Chr 15 Seg 1

Jonathan has all the crossovers here. Janet and Joanna don’t have any. The crossovers are where the grandparents change. As Janet has no change (crossover), we’ll say she got her DNA from the same 2 grandparents along her whole Chromosome 15. Then I added numbers at the bottom. These are where the matches start and stop (rounded to the nearest million) between the 3 siblings as shown in the gedmatch comparisons above:JL Chr 15 Seg 2

Joanna (3) will be feeling left out by now, so let’s see what we can do. Janet and Joanna have that HIR that we talked about. That means they will match on one grandparent and not the other. Let’s pick one for them to match. It doesn’t matter whether it is the green or blue grandparent at this point, because the colors are only relative now and not locked in. I pick green as their match and purple will be the grandparent that Joanna has that doesn’t match Janet’s blue DNA-contributing grandparent. All these decisions!

JL Chr 15 Seg 3

Now we can try to fill Jonathan in. This should be easy:

  • Jonathan and Joanna have no match in segment 2 and 4
  • Jonathan and Janet have no match in segment 3

Joanna and Janet both have green grandparents the whole way. For Jonathan to not match them in all those places, there has to be a different color. I have been using orange for the 4th color representing the 4th grandparent’s DNA.

JL Chr 15 Seg 4

Next, I said that Jonathan and Joanna (1 & 3) have no match in the second and fourth segments. The non-purple in the lower half is blue. Jonathan and Janet are non-blue in the 3rd segment as they don’t match, so that is purple.

JL Chr 15 Seg 5

And that was probably the easiest chromosome I’ve ever looked at! Now to add real life actual grandparents. The new matches that Joanna’s family got in were with their maternal grandmother – Miriam Williams. Jonathan matched her, but Joanna and Janet did not. This match rounded in millions is between 90 and 97. I like how gedmatch has the commas; it makes life easier.

Jonathan match William Chr 15

This is on the right side of the Chromosome 15 segment map. I will say that Grandmother Williams is orange, as that is the one that is different from the 2 sisters on the right. Next we will look at Frazer DNA Project matches that Joanna’s family has. I have good matches and sketchy ones that are small.

Chr 15 matches

We decided above that Williams (Maternal Grandmother) should be orange on the top of the maternal/paternal split. That means that Frazer (Paternal side) will be below that maternal/paternal split line. Janet and Joanna have a large Frazer match on the right hand region, so that would be – uh oh, it looks like I made a mistake. Note in the above spreadsheet that Joanna and Janet both have large matches with BZ. BZ is a Frazer (paternal grandfather) relative. The only places that Joanna and Janet (2 & 3) can have the same grandparent (color) on the right hand side last segment is at the green location. That boots Granny Williams down to blue.

JL Chr 15 Seg 6

Where Did I Go Wrong?

I went wrong above when I assigned Miriam to orange. This was based on Jonathan having a match with a Miriam relative and Janet (2) having no match with that same relative. I did have a little qualm about doing this but reasoned thusly: “If Jonathan had a match and Janet didn’t, then it had to be orange.” Also why wouldn’t Janet have a Williams relative match? She has all that blue area to match. So I’ll have to take note not to make that assumption again. I suppose it’s one of those situations where absence of proof is not proof of absence. Fortunately, the Frazer matches bailed me out of my bad assumption.

Adding the Other Grandparents

JL Chr 15 Seg 7

One More Correction

After coming back to look at this after many months, I see a mistake I made. It was Joanna (3) that had a match with a Williams relative not Jonathan. This version is done in Powerpoint which is easier to use. I now have Joanna at the top and Jonathan at the bottom.

chr15frazermaprev

This has to be right. Purple is Joanna’s only unique color in the 90-97 area. And only Joanna had a Williams relative match. Likewise, Joanna and Janet had Frazer matches from 67-92. Green is the only color those two sister have in common in that area.

Summary and Conclusions

  • Powerpoint is a better software for visual phasing
  • It is best to use names for identification, not numbers
  • With just one maternal grandparent and one paternal grandparent, I was able to fill in the missing grandparents.