People say that YDNA is complicated. It is not too complicated. YDNA gets passed on from father to son unchanged. Except it does change on average about once every 144 years or so. That reminds me of how to have a good lawn. Plant grass seed. Wait 100 years and you will have a good lawn.
Rodney Added to the Frazer YDNA Tree

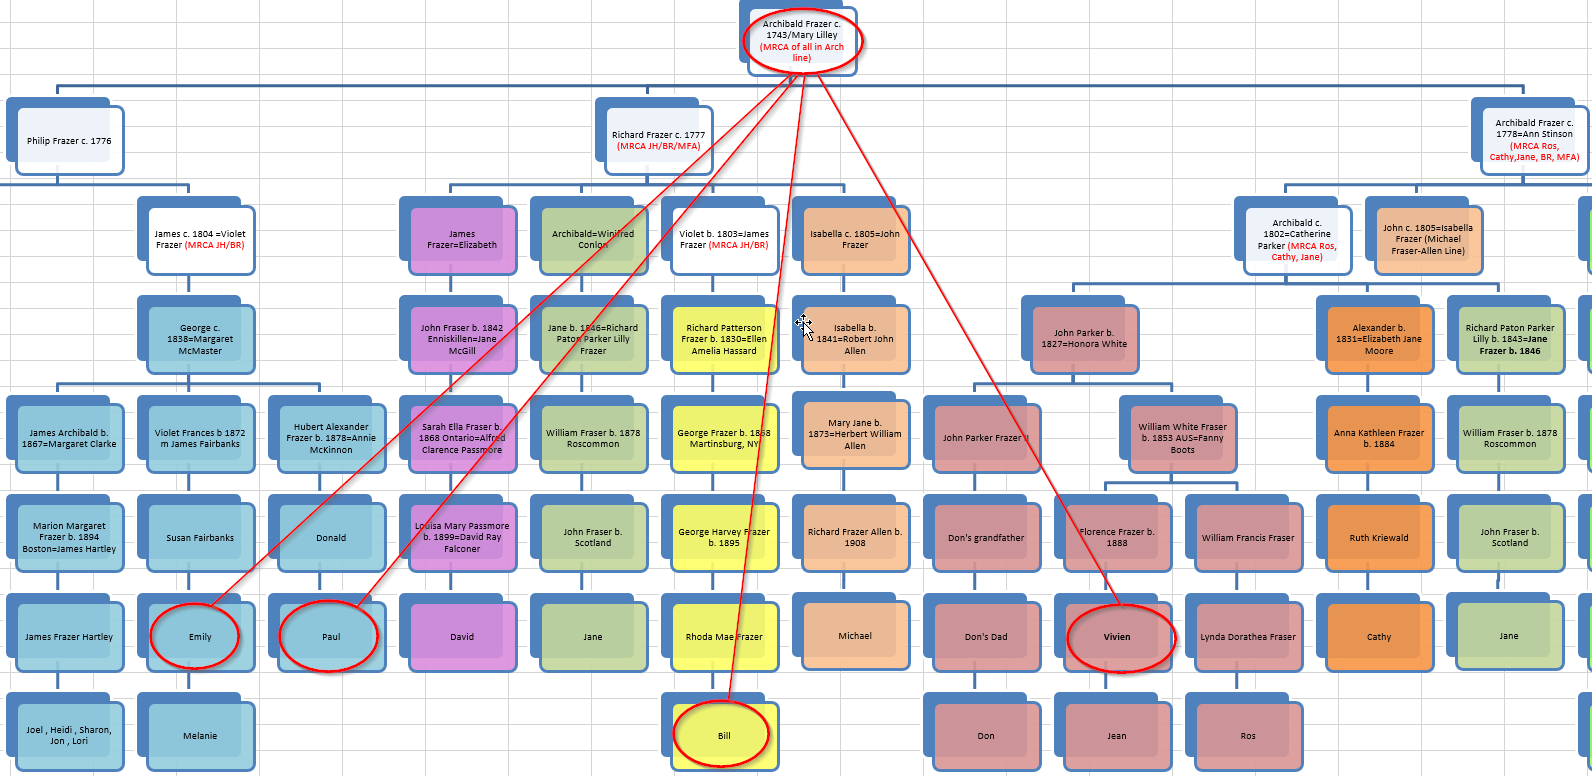
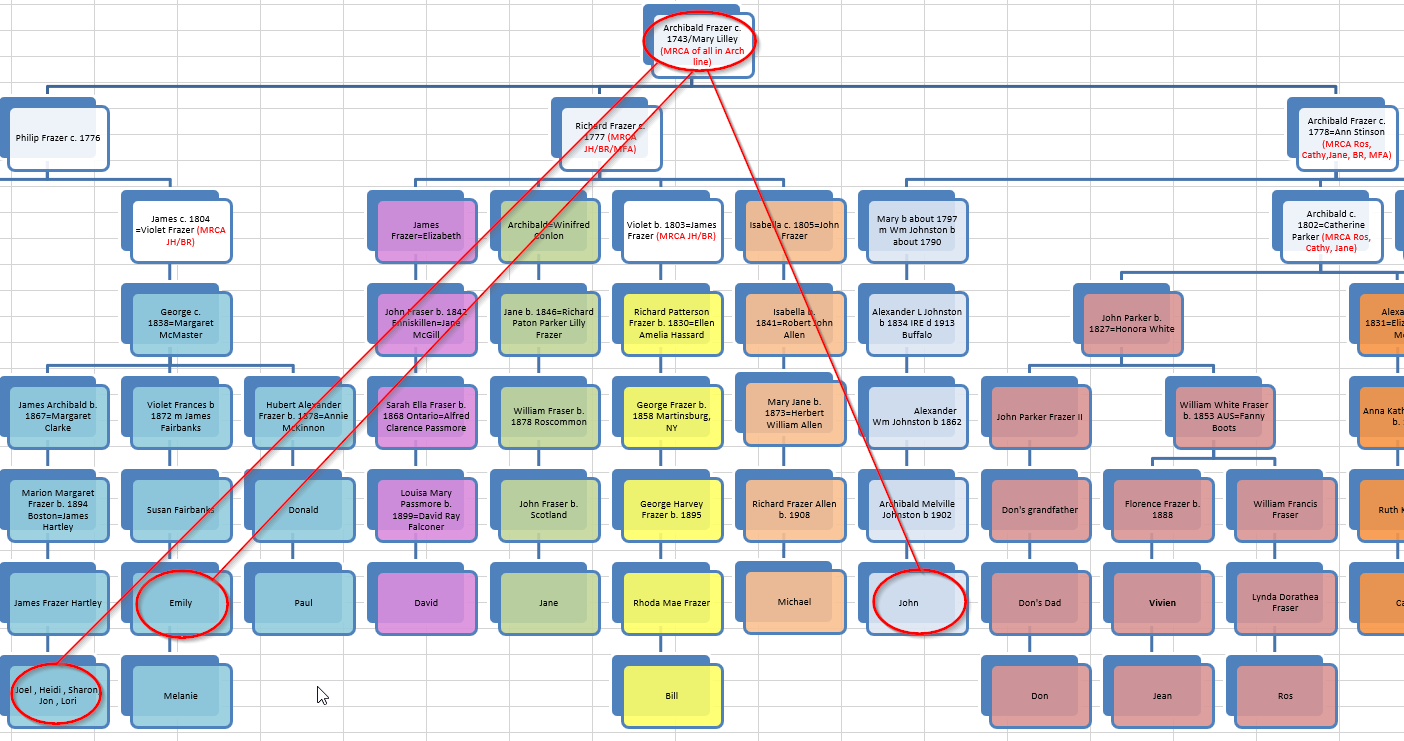
There is some confusion on the Archibald line (left side) as to whether there should be two Archibalds or one under the top Archibald. Some researchers added one to make the dates look better, but I am thinking of taking one back out. For example, an alternate tree has one Archibald but has Philip born 1758 instead of 1776.
Here is the alternate tree:

If nothing else, the symmetry is better on this one.
Rodney’s STRs
Rodney tested for 111 STRs. That is a good amount. Jonathan also tested for 111 STRs. Rick and Paul tested 67. STRs are Short Random Repeats. These are repeats of certain markers on the YDNA. They may increase or decrease every so many 100’s or 1,000’s of years. Some markers change faster than others. Over a large amount of time these markers could go up or down and we wouldn’t know it as we weren’t around 1,000 years ago to test them. However, this tree only goes back to about 1690 or so, so we shouldn’t have to worry about that.
Rodney’s Vs Jonathan on the Thomas Henry Line
Jonathan’s sister asked me about Rodney and Jonathan’s STR comparisons. Rodney and Jonathan had a perfect match at 67 STRs but a one difference at 111 STRs. That was because their only difference was between STR 68 and 111. The actual marker for this difference is at DYS552. Rodney has a value of 24 and Jonathan has a value of 25. That means that Jonathan has one more Short Random Repeat compared to Rodney. Out of all the STRs, that is the one that distinguishes Rodney’s Line from Jonathan’s line.

Which Line Changed: William or Edward Fitzgerald?
And does it matter? It would be nice to know who changed, because that would mean either 24 or 25 would be ancestral, meaning that Thomas Henry either had 24 or 25 for that marker and one of the lines changed. I did not have the 111 STR test done for my cousin Paul, but he has taken the BigY. When he had that test done, I uploaded his results to YFull and they extracted some of the STRs from the BigY test. Unfortunately, the extraction from the BigY test does not get good reads for all the STRs. Fortunately, Paul did get a result for DYS552. He had a result of 25.

That means that 25 is likely the ancestral value. 25 would also likely be the value for Archibald Frazer born around 1690.

This is the way I’ve heard STRs explained. Pretend at every conception along the male line through the ages, the YDNA is going through a copying machine. All the different STRs are being copied. Every three generations or so, one of the 111 STRs has a copying error and one more copy or one less copy is made. In Rodney’s case, one less copy must have been made of DYS552 in either Rodney, Rodney’s dad or his grandfather, William Frazer.
There is one implication concerning the mutation in Rodney’s line. When Paul is compared to Rodney and Jonathan, it looks like he is more distantly related to Rodney than Jonathan. These differences are called GDs or Genetic Distances. However, based on the tree, Paul is related no more closely or further away from either Rodney or Jonathan.
It’s Simple
That is why I said at the top that YDNA is easy. Rodney and Jonathan have a common ancestor of Thomas Henry Frazer born 1836. Jonathan and Rodney have a GD of 1. That means that change happened after Thomas Henry Frazer as he had only one value for each of his 111 STRs. Because we know Paul’s result for DYS552, we know Thomas Henry Frazer’s value at location DYS552. There is only one catch. It is possible for STRs to go up and down. What if DYS552 changed more than once since 1690? This would be highly unlikely. If DYS552 was a fast-moving STR or if there were several thousands of years to the common ancestor, this would be more likely, but that is not the case here.
The Bigger Picture
Using the same principles, I should be able to get some ancestral values for our common ancestor, Archibald Frazer. However, let’s start with a smaller part of the Archibald tree, like we did on the James Line.

Here is Rick and Paul on the Archibald Line of the Frazer YDNA tree. Where Rodney and Jonathan had 3 generations to have YDNA changes from their common ancestor, Paul has 4 generations and Rick has 5 generations from their common ancestor of James Frazer born about 1804.
Rick has taken the 67 STR test but not the BigY test. Paul has taken the 67 STR test and the BigY test. As a result, he has some results from the 111 STR test, but is missing many of the STR markers between 68 and 111. Here are the differences between Paul and Rick:

Getting the Ancestral STR Values
Now I want to know what values James had for his STRs for 444 and 576. These are the values that Rodney and Jonathan have going up to the orignal Frazer ancestor born around 1690.

That means that Rick’s STR of 444 went down one repeat from 14 to 13 and Paul’s STR of 576 went up from 18 to 19.
Putting it Together
Now we know that Archibald , born about 1690 had 444 = 14, 576 = 18 (oops, typo above) and 552 = 25. However, there are two other differences from the Archibald Line and the James Line. It will be easier to show this on a tree:

Now there is a tie, so how do we tell which values are ancestral? (That should be CDY above.) In order to figure out the ancestral values, we have to go outside the Frazer project and bring in some more distant relatives: Grant, Hayes, and Stewart. Fortunately, I have already done this in a previous Frazer YDNA Blog:

This shows the ancestral value to be 391 = 10 and CDY = 35-38. Now we have our five ancestral values for Archibald.
Here is the final Frazer STR Tree:

Observations:
- If I drew this right, Jonathan has no mutations going back to Archibald, born about 1690.
- Paul and Rick both have three mutations going back from the same Archibald.
- There are more mutations on the Archibald Line than the James Line, but they average out.
- Paul and Rick have a GD of 2. That represents differences in marker 444 and 576.
- Paul has a GD of three compared to Rodney and Jonathan. This is based on markers 391, CDY and 444. 552 was not counted as Paul did not test at FTDNA for 552.
- This tree contains some 67 STR results and some 111 STR resuilts.
- Other direct male Frazer descendants that have YDNA STR tests should be able to tell what branch of the Frazer tree they are in based on this tree.
- This gives an idea of how the mutations occur. There were two mutations that happened rather quickly between about 1690 and 1804 on the Archibald Line. So that was one every 57 years. Rodney had one mutation. I’m not sure when he was born, but let’s say one mutation in 260 years. Let’s say Paul and Rick had a mutation about once per 87 years. An average between Paul or Rick and Rodney would be about one mutation in 173 years. This is comparing a bit of apples and oranges as some tested at 67 STRs and some tested at 111. I don’t know how to average Jonathan in as he has no known mutations.
Dating Using the McDonald TMRCA Calculator
Rodney and Jonathan

That should say generations at the bottom. Jonathan and Rodney have a common ancestor at three generations. This calculator’s first choice for a GD of one at 111 markers is 2 generations away. Three generations would be the third choice.
Paul and Rick

This graph tops out at 5 generations. Paul and Rick are 4.5 generations away from a common ancestor, so that is close enough.
Paul Compared to Rodney (and Jonathan)

Paul and Rodney are 7 generations to a common ancestor. At least they are on the tree without the extra Archibald. This shows 8 as the first choice, but almost the same chance as being 7 generations away. Rick and Rodney should be at the same genetic distance (GD) and they show as 7.5 generations away from a common ancestor. These would also apply to the matches between Rick, Paul and Jonathan.
Summary and Conclusions
- Rodney’s YDNA test has added some symmetry to the Frazer YDNA Tree
- The YDNA test does not appear to be precise enough to tell us if the Archibald tree is correct or not. Either configuration would be reasonable based on the YDNA.
- The Frazer STR tree sets down some results that places the four tested Frazer descendants in their different branches.
- A Frazer that is unsure of his branch would be able to test his STRs and find out which branch he is in.