Part 5 – Raw DNA From 5 Siblings and a Mother – A New and Improved Method

In my last Blog, Part 4, I found that I needed to go back to improve a method from an earlier step to make a later step work much easier. This did two things:

  1. Gave me a cleaner database
  2. Set me back a ways

Re-do Principle 1: Homozygous Siblings

I need now to create a new table. This will have the allele from Mom and Dad for each sibling. I copied my previous table to a new one called tblV1andV2HomozygousSibs. I opened my new table in design view and added the 10 new fields that I needed:

The first five of the new fields will be have the Mom Patterns and the last five will have the Dad Patterns. Right now they are just blank. I’ll use an update query to add in homozygous alleles:

This query says when my allele 1 is the same as allele 2 (homozygous), put allele 1 into the slot from my Mom and my Dad. The Dad slot goes off the page, but is there. When I run the update, it fills in over 485,000 lines. To do this by hand would have taken a while. This is the first step to filling in the Mom and Dad Patterns:

I do the same query for each of my four other siblings. Care needs to  be made the the right alleles are going in the right place. For example I wouldn’t want to put a Lori allele into a JonfromDad column. Then I check to see if the columns are filling in:

If I recall right, this step fills in (or phases) about 8 million alleles. We don’t see any patterns yet other than AAAAA, but patterns are emerging in other parts of the table.

Step 2 – Homozygous Mom

Here when mom has a GG for example, she would have to give a G to each child at that position, as that is all she has. I’ll use the Update Query again for this. Here is the Criteria:

Here is the Update part:

Step 3 – Heterozygous Siblings

Here is an example:

I have TC in my two alleles at this position as do my siblings. My mom must have had CC as she gave a C to each of her siblings. That leaves a T that we must have gotten from our dad. It looks like I may need 10 Update Queries for this one. Here is the criteria:

The query says that Joelallele1 is not the same as Joelallele2 (Heterozygous Sibling) and I received my allele1 from mom.

I update the table to say I got my other allele from my Dad. This is a little more complicated Update Query. I then reverse the Joelallele 1 and 2. When I get allele2 from mom, I get allele1 from Dad. Before I run the Update Query, I view it each time to see if there is a reasonable number of rows being updated. If no rows are updated, there is probably an error in my query. This update is in the 40-50,000 row range. Also, if I get values in the view panes, it often means I have put the results in the wrong field. Usually many empty rows in the view output is a good thing.

I forgot to copy and rename my Homozygous Sibs Table, so I just renamed it to tblV1andV2w3Principles.

Finding Patterns

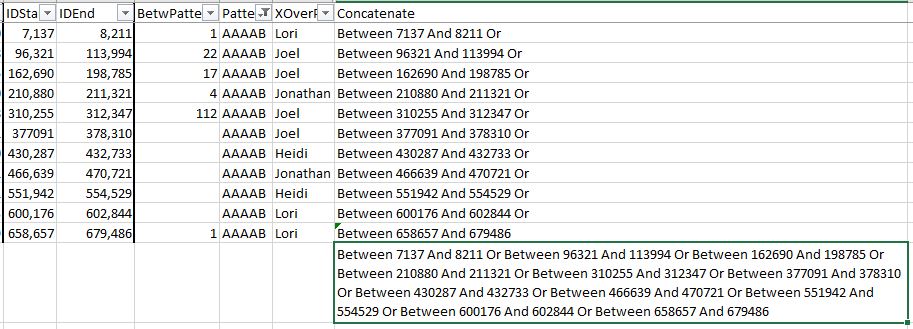
This time, I want to add ID’s to my patterns, so I’ll add two columns to my old Pattern Spreadsheet in Excel:

Rather than do formulae for each pattern again, I’ll just scroll through my table to see if I can finesse the Pattern boundaries and add Position IDs.

Finessing Pattern Boundaries

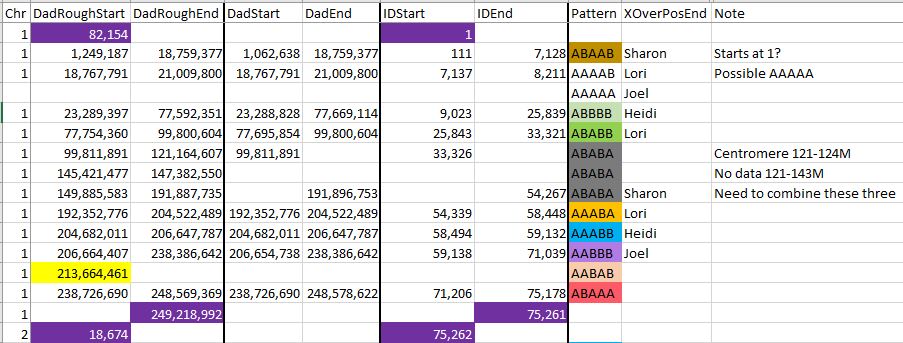
Here is an example at Chromosome 1 in the 77M range. There I had a change from ABBBB to ABABB. In my previous query, I only looked at Dad patterns where all the alleles were filled in. However, in the original pattern, we can infer the pattern even when alleles are missing.

Previously, I had the change at the top row where there is a full pattern. However, in going from ABBBB to ABABB, we only need the first three positions to identify the pattern. And actually, we only need position 2 and 3 to identify ABABB. At ID 25839, there is an AGG??? Pattern. This has to be in the form of ABBBB. Then 4 lines later, is ?AG??. This has to be an ABABB Pattern. Here is how I noted the change in the 77M range on my Excel Dad Pattern Spreadsheet:

The DadStart and DadEnd columns have the refined Position numbers.

Refined Chromosome 1

  • I had noted previously a possible AAAAA Pattern between AAAAB and ABBBB. It turns out that that is required. This is because to go from AAAAB (same as BBBBA) to ABBBB would require two changes. Only one change is allowed at a time. I will need to fill in the Positions and IDs.
  • The three ABABA Pattern areas need to be combined into one. They occur in a Centromere and in an excess IBD area. The Genealogy Junkie has a good Blog on that topic. I downloaded a file she had with the exact areas.
  • I added the IDs for the start and stop of the Chromosome as tested as well as the start of the next Chromosome. These are highlighted in dark purple.
  • Only 22 chromosomes to go.
Chromosome 2 Refined

Here I added a new column. This is the number of IDs or SNP positions between patterns. Note that there is a negative 4 in one case. This was an odd case where the two patterns at the crossover were inverted. I didn’t know what to do there, so I left it as is. There is a Centromere from 92-95M, so I will combine the two AAAAB Patterns that I have when I create the clean version of this table.

Chromosome 4 refined

Here I had to add a green AAAAA Pattern to make this work. Note that I am getting fewer crossovers.

Chromosome 5

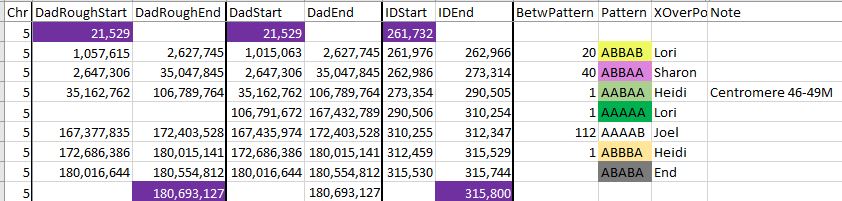
Here is another case where an AAAAA Pattern is needed:

The pattern is needed between AABAA and AAAAB for two reasons. For one, there is a large gap between the end of AABAA and the beginning of AAAAB. Also, to go from AABAA and AAAAB requires two changes and only one is allowed. That requires an intermediary step of AAAAA between these two patterns [AABAA > AAAAA > AAAAB].

Here is Chromosome 5 completed:

The addition of the AAAAA Pattern results in the addition of two crossovers. Another note is that I could have had the first pattern start at the beginning of the Chromosome and have the last pattern end at the end of the chromosome. That is because there is not much room there for other crossovers.

a chromosome 8 Decision

The issue here is the two AAAAB Patterns in a row. Should they be combined or should I add an AAAAA Pattern between the two AAAAB’s? I’m going with combining. The reason is that if I put an AAAAA between the two, that would give Lori two paternal crossovers in a fairly short span. This does not happen in nature – at least in the middle of a chromosome. This would be like inheriting a 2 cM segment from a grandparent.

Chromosome 9 decision

Lori has two crossovers in a row, which is not ideal. Then there are two ABAAA patterns in a row. I decided to combine these. This is because when I look at the table, there is a centromere in there and a lot of missing SNPs. If I did create an AAAAA pattern, that would result in two close crossover for Sharon.

Here is the cleaned up version with the rogue SNPs taken out:

Missing Pattern Chromosome 10

There is a missing pattern between Lori and Jonathan’s first crossovers. AABAA > ABAAA is two changes, so I need to insert an AAAAA Pattern between the two. This will result in two new crossovers: one for Heidi and one for Sharon.

Chromosome 11 – Halfway?

The good news is that I’m at about 2/3 of the way. I have over 900,000 locations and Chromosome 11 brings us past the 600,000 mark. Note again the need for an AAAAA Pattern between the last two patterns. That will add a Lori crossover and a Jonthathan crossover, so they won’t be left out.

Chromosome 12 patterns

Chromosome 12 looks like it is missing a lot betwee ABBBB and AABAA. However, it is just missing an AAAAA. That is because ABBBB is the same as BAAAA. The progress goes BAAAA > AAAAA > AABAA. As it turns out the crossovers that have to do with transposing relate to me (Joel). The extra crossovers go to me and Heidi.

Here are the numbers filled in for Chromosome 12:

Sketchy Chromosome 13

I note that Chromosome 13 is a bit sketchy, with no identified sibling crossovers. It appears that AAAAA Patterns are needed here also.  There is about a 4M space where there is room for an AAAAA Pattern between 24M and 28M. There is also room after the AAAAB Pattern which would give Lori another Paternal crossover. This last crossover is shown in Gedmatch:

These are matches of my father’s first cousin to myself and four other siblings. This shows Lori’s crossover on the bottom match. As all siblings match to the end of the Chromosome, that would be the AAAAA Pattern.

Here is the finished Chromosome 13:

Lori’s crossover as shown in Gedmatch shows on my table at about 90M. Keep in mind that Gedmatch uses Build 36 and my table is in Build 37.

Chromosome 21: Refinement Example

Here is an example of a refinement. In my initial query, I was looking for patterns that were filled. However, in going from AABBA to ABAAB (which defines my crossover), it is the same as going from BBAAB to ABAAB. The only change in pattern is in the first three letters: BBA to ABA. We can see that change here even though the last three letters are missing:

Chromosome 22: Extra AAAAA needed

On Chromosome 22, there is a lot of room at the beginning of the Chromosome to put in an AAAAA Pattern:

There are about 5M SNPs between the start of the Chromosome (16M) to where the AAABA Pattern starts at 21M. I have 4 of my siblings mapped out using visual phasing:

This shows on the paternal side (Frazer) that there is an AAAAA Pattern. That is represented above at the start of the Chromosome in blue. I am just missing Lori. Without looking at all her results, I see she has a full match with Heidi at the beginning of the Chromosome:

And here is the last Paternal Chromosome finished:

It was a lot of work, but now I have what should be the start and stop points for all the Paternal segments for me and my four siblings.

Summary

  • I needed sequential IDs for my Access Queries to fill in missing alleles
  • To do this I needed to go back to the beginning and re-import the raw data for six people
  • I created a table for five siblings showing where they got their paternal and maternal alleles based on three principals.
  • I went back to my Paternal Pattern Table and refined what I had already done
  • I also added IDs to my Paternal Pattern Table
  • Next up is to look at the Maternal Pattern Table and start filling in blanks using MS Access


Part 4 – Raw DNA From 5 Siblings and a Mother – A Problem with Filling in the Blanks

In my last Blog, I looked at Maternal and Paternal Patterns created by initial phasing of my raw DNA. The Paternal side patterns were pretty complete, but I didn’t have much on the Maternal side. I summarized the patterns I found in a spreadsheet. I added siblings’ crossovers where found and added start and end positions on each chromosome where found.

Filling in the Blanks

  • First I made copies of my Mom and Dad Spreadsheets
  • Then I cleaned them up, taking out the Patterns that were only at one location (one SNP)
  • Then I used a filter to get the patterns.

The AAAAB Pattern filter on the Paternal Patterns spreadsheet looks like this:

On the Maternal Table, it looks like this:


I’ll start with the maternal Patterns as it will be easier. First I copied that Table I was working on to create a new Fillin Table called tblFillinStep1.

Here is what I portion of the Chromosome 10 AAAAB Maternal Pattern looks like:


In my previous analyses before I had 5 siblings tested, I had sequential ID’s. This made things easier in choosing patterns. Now, however, I am having trouble getting the ID’s sequential. This is probably due to my adding the extra alleles. My options now are to update the missing alleles by hand or create queries to update them.

Just Like Starting Over – a New Access Database

I decided to try importing all the raw DNA files into a new Access Database. This time I won’t let Access assign the key data field. I’ll use the rsid as the key data field. Perhaps then I can assign a new ID that will apply to the merged V1/V2 AncestryDNA dataset.

One problem that I’ve noted with the AncestryDNA downloads is that they only give you a date on the filesname. There is no indication in the file or in the file name of who the data is for. That means that it is important to rename your files. I uploaded my sister Heidi’s results to Gedmatch on 26 April 2015, so that is a clue. I see an AncestryDNA zip file from 25 April 2015, so that is a clue. I guess I’ll add her name to the file now!

The Clean start

Here is the Access Database with just 5 tables:

Here’s my Query to create an AncestryDNA V1 Raw Data Table:

I see in my results, I got more lines than last time. I checked and I forgot to only include Chromosome 1-23. I corrected that and got the 700,153 lines as before. I did and analogous query for Jon and Lori and got 666,532 rows.

All V1 Results plus the v2 results where they are they match v1

Next, I’ll create a Query between the two tables I just made.

This will have a right hand join. As stated above, it will produce all the V1 data and only those records from V2 where they equal V1. That brings in Jonathan and Lori into the V1 results. I made this data into a new table.

Finding v2 data not in v1

Next I want to add only the V2 part that isn’t in V1. When I get this, I can add this to my query to get all the results. This is the query that I couldn’t remember how to do last time. I put V2 on the left, with a right hand query.

This gives everything from V2 plus the V2 that equals V1. However, the trick is that I set V1 to ‘Is Null’ which takes out the V1. That should give only the right section of the peach colored circle below.

For some reason, my new number for the right entire circle is 666,532. The new query results is the right hand circle minus the overlapping data which is 242,494. I’ll append this query to the table I made with my previous Query. I renamed this table as tblV1andV2 and it has 942, 647 rows.

Next, I want to sort the table and add an ID.  I copied the structure of the table to a new table. Then I added a Position ID (Pos ID) with an autonumber. Then I made a query to append the old data to the new table with the autonumbered Pos ID. This gave me what I wanted but not in the right order. So then I used the sort function to get the table in the shape I wanted:

I can tell the table is right by going to the last record:

Before the last record would include the V2 alleles that were added but they weren’t sorted. This long process gives me a sorted ID in the same relative position as the sorted Chromosome positions. The reason I need that is to describe my patterns  in a simpler way than by Chromosome start and stop.

Summary and Next Steps

  • Going down the road of filling in patterns, I found something that I needed to correct in an earlier step
  • This caused me to start afresh with cleaner tables.
  • I was able to add a unique ordered Position ID to the combined V1/V2 table
  • This position ID will be used to identify each Pattern for filling in missing alleles
  • However, I have to re-do the patterns. This time, I will include the Position ID in the start and end of each pattern in my summary of Mom and Dad Patterns.


Part 3 – Raw DNA From 5 Siblings and a Mother – Patterns

In my previous Blog, I looked at Whit Athey’s Principle 3 for my mom, my 4 siblings and myself. Based on that Priniciple and the previous 2, I phased our DNA up to a point. The next step in the phasing has to do with patterns.

Patterns

The patterns I am talking about are the patterns that the five siblings receive from either their mother or father.  For example, an AAAAB pattern means that the first 4 siblings received the same allele and the fifth sibling received a different one. I had mentioned previously that the patterns should be in this form:

  • AAAAA
  • AAAAB
  • AAABA
  • AAABB
  • AABAA
  • AABAB
  • AABBB
  • ABAAA
  • ABAAB
  • ABABB
  • ABBBB

The first situation is a special case as this situation can happen within the other patterns ‘by accident’ as Athey puts it.

AAAAB Dad pattern

First I’ll look at a query to find an AAAAB pattern.

That Query results in this:

Except there are actually over 8,000 lines. I summarized the rough starts and stops in an Excel Spreadsheet:

This part can get a bit tedious. In Chromosome 2, I noted a possible break between 89 and 96M, so I’ll need to keep an eye on that. Highlighted in yellow are single patterns which may or may not be significant.

quality check

I took my AAAAB Query results and put them into an Excel spreadsheet. Then I subtracted the previous position number from the current position number to see where there were gaps. Then I filtered the gap to 1,000,000 or more positions:


This is my gap analysis. I highlighted the 7 million position gap where I put in an extra segment on the AAAAB pattern. This points out some of the single AAAAB patterns also.

mapping the initial results

Let’s look at Chromosome 13 between 28 and 87M. With an AAAAB pattern, that means that Joel, Sharon, Heidi and Jon match the same paternal grandparent. Lori matches a different one. However, we don’t know which paternal grandparent without a reference cousin. Fortunately, I have one. He is my dad’s first cousin. He would match on my paternal grandfather’s side. That grandfather is James Hartley, b. 1891:

Paternal cousin Jim matches the 5 siblings here:

As you may guess, Lori is on the bottom (#5). She has a crossover at about 85.5M according to Gedmatch. That means that before 85.5M she is matching on my father’s mother’s side: Marion Frazer. So, if I wanted to, I could start to map Chromosome 13. From 28 to 87M, I could say that 4 siblings got their DNA from their paternal Hartley grandfather and one sibling, Lori got hers from her paternal Frazer grandmother.

Further, I would expect an AAAAA pattern starting at 87M based on the gedmatch browser results above. The bad thing about an AAAAA pattern is that there is some missing DNA for the other grandparent. In this case, the Frazer DNA is lost on the right side of the map below. Another point is that these patterns change one letter at a time. So it makes sense that an AAAAB would go to an AAAAA. For example, an AAAAA would never go directly to an ABABA.

Here is a paternal only map of Chromosome 13 based on our very initial results:

aaaab Mom pattern

I notice that the formula that I used to find the AAAAB Dad pattern, I can move over to the mom side. So I might as well do this while I’m thinking of AAAAB pattenrs and put the results in Excel.

I randomly used Heidi as the ‘A’. So Lori not matching Heidi becomes the ‘B’. The results for this maternal query was much smaller with only 189 lines.


This was a lot easier. The Mom and Dad Patterns don’t interrelate with each other, so I have them on separate worksheets. Note that there is the same AAAAB pattern in the same starting place on Chromosome 13 as there was on the paternal side. This is a coincidence and the starting spot is a coincidence. This is just a rough number now and may be refined later. I could make a map of this also.

Here is a cousin on my mom’s father’s side:

Here she matches Joel, Sharon, Heidi and Lori from about 74-99M. Here is a map drawn on the Gedmatch browser and raw data phasing:


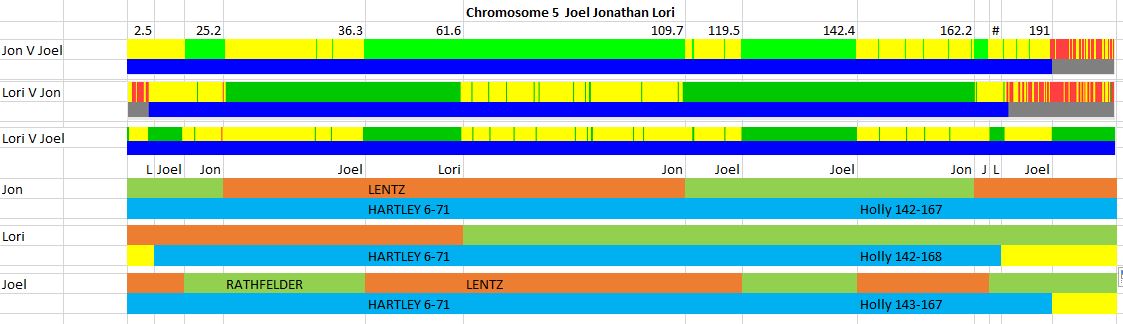
This shows what a AAAAB pattern looks like that is both paternal and maternal between 28 and 45M. I also show two crossovers for Lori: (Frazer to Hartley) and (Rathfelder to Lentz). In addition, Jon has to have a crossover from Rathfelder to Lentz and Lori has to have another crossover from Lentz to Rathfelder somewhere in the white spaces. There is a reason that I could tell the maternal A’s of the AAAAB pattern were Rathfelder even though our cousin match did not overlap that area. It is because the patterns do not change that fast as I explained above.

Now that I know which sibling has one of the paternal crossovers I can mark it on the Dad Pattern Spreadsheet:

I name the crossover column in the spreadsheet for the end of the pattern position, so it will be clear where it is. This is the ultimate goal of the process: to find the crossover locations and assign them to the siblings. Once this is done a map may be drawn for all the siblings.

The Next Step

In the next step, I could fill in the missing alleles between the Start and End positions of the AAAAB patterns. Here is how that will be done:

The highlighted row is where the AAAAB Pattern starts. Basically, what will happen is if there is at least one Allele in the first four positions, I will be able to fill in any of the other alleles in those first four positions with the same allele. However, in the last row, for example, there is just one G in the last position. We don’t know if the other four alleles will be a G or another letter. The row that has TTT??. We know that we can fill in the fourth T to TTTT?. However, the last allele we don’t know if it will be a T again or a different alelle. So we also need to leave that space blank.

However, I want to make sure I have all my patterns right, so I will look at all the patterns first and reconcile them.

AAABA Pattern

If I drew my map correctly above, I will be expecting Lori to have a maternal AAABA pattern on Chromosome 13. This should change to an AAABB pattern at about position 95M. I’m already on a maternal query, so I’ll start there.


I used Heidi again as the A. Now Jon is the B that is different than Heidi. I was surprised with the results as I only had this maternal pattern in Chromosome 1 and 23:


My prediction of a Chromosome 13 AAABA Pattern did not come true. I wonder what went wrong?

Paternal AAABA Pattern

Here is a partial summary of the Paternal AAABA Pattern:


On Chromosome 11, we see the AAABA pattern twice with an AAAAB pattern in-between. To go from an AAAAB to AAABA there has to be a transition pattern: either AAAAA or AAABB. Hopefully this prediction will be correct! That leads me to the AAABB pattern.

AAABB

This pattern requires a slight modification of my previous query:


This pattern is adjacent to the AAABA Pattern, so I will be able to assign some crossovers:


These crossovers belong to Jon and Lori as Jon is in the next to the last position of the patterns and Lori is in the last position of the patterns. Note that in Chromosome 19, Lori goes from an AAABA to an AAABB at about 5M. However, there is a rogue AAABB in the AAABA pattern at around 3M. That could be due to a misread or a mutation. I’m not sure. Jon has a crossover on Chromosome 8. These are all Lori and Jon crossovers, due to the positions of the pattern changes we are looking at. The changes are all in the last two positions.

AAABB Maternal

I’m still getting very few crossovers here. I’m not sure why:


I’m not sure why the maternal side is not keeping up with the paternal. I have no crossovers here yet.

AABAA

Following my alphabetical reasoning, AABAA is my next pattern. I’ll start with the maternal:


I changed to having my [Joel’s] allele the ‘A’ in the Pattern. The results look right:


It seemed like there was a break in Chromosome 5 between 46 and 50M.

AABAA Paternal


On Chromosome 5, there was a gap similar to the one on the Maternal side.

Centromeres

According to ISOGG, these are the Build 37 Centromeres:

This is good information to have. I assume that the Centromere is not counted, so I will ignore the Chromosome 5 missing area and make a note that the centromere is there. This also makes a difference on all the results.

AABAB: Are We There Yet?


Here are Heidi’s first crossovers. I’ve also heard of crossovers referred to as cut points. I am noting where the centromere is – though not quite spelling it correctly above.

Here is the Maternal AABAB. I am still annoyed that there are so few patterns. They seem to be missing for some reason:


I suppose, if this trend continues, I could do the project over and add in my mother’s and my FTDNA raw DNA results.

AABBA

I didn’t find any AABBA Patterns on the maternal side. However, that was with a query using my results as A. However, from my previous Blog, I recall this chart:


This showed that on the Mom side, Jon and Lori had the most alleles. I’ll run the query again this way:


Still no patterns.

Here are some more Dad Patterns:


However, there are a few problems. Chromosome 17 is missing a pattern. I can solve this by looking at the original table.


Here the pattern is AABAA.

The next problem is that there are two patterns in one spot on Chromosome 22. I ran pattern AAABA again and see it should have ended earlier:


Here is the right answer below that also shows a Heidi crossover at that location:


AABBB

Paternal


Maternal side

Still nothing.

ABAAA

Maternal side


Paternal

This side had more patterns.

ABAAB

Had several of ABAAB Patterns on the dad side, but only one on the mom side. I think that there is a fill-in step that fills in the mom side from the dad side that may correct this later.

ABABA, ABABB, ABBAA

I did notice a Dad Pattern discrepancy on Chromosome 6:


There are three single patterns, I figured were discrepancies. However, there appeared to be a longer AAABB Pattern within the ABBAA Pattern. This is where it helps to look at the raw data.


The blue section is the start of the AAABB rogue pattern that I had. However, a closer examination reveals that this pattern is not continuous from position 30514810 to 30594827. Between those two there are a lot of ABBAA patterns. This is clear at position 30544401. However, this is also clear wherever the first 2 alleles are different. For example, on the last line, I see GT???. This will be filled in with GTTAA as this is within the ABBAA Pattern area. So what happened was that there were two single AAABB patterns. When I did the query for these, it looked like the pattern was continuous, but it was not. Based on the above, I’ve modified my Dad Pattern Spreadsheet to show two single discrepancies:


I won’t overwrite this information, but I will keep it in mind for later in case it is important. If this was a real crossover, it would be mine. However, crossovers in the middle of a chromosome don’t change that fast for one person on one copy of their chromosome.

Some of the Dad Pattern Crossovers are starting to fill in:


Starts and Ends of Chromosomes

At some point, it is important to know where the Chromosomes start and end. The testing companies don’t always start at the beginning positions of each chromosome. The ends are different also based on the lengths of the chromosomes.

I was able to find what I was looking for using a min/max Query in Access. I took my table with the 900,000 plus alleles and made a query that looks like this:


When I run the Query, I get this helpful table:

This tells me the start and end locations for each of the chromosomes that I am looking at.

I put this into Excel and highlighted the information in purple. Then I sorted it into my mom and dad pattern spreadsheets:


Now, I can tell that I am near the beginning and the end of Chromosome 20 with the pattern locations. However, on Chromosomes 21 and 22, there is still room for more at the beginning of those Chromosomes. As the Chromosome 20 patterns are complete, this also tells me that my sister Lori has no paternal crossover on Chromosome 20.

ABBAB, ABBBA, and ABBBB

These are the last three patterns, not counting AAAAA. I finally have one crossover on the maternal side. It is on the X Chromosome:


I have a mess to clean up on Paternal Chromosome 2 :


There appear to be two patterns occupying the same space between 123 and 128M, which is not good. I’ll take a look at my Table: It appears that the AAAAB at 127,841,390 is a one-time occurrence. Here is my correction:


Note that there is still a gap at AAAAB. There may be an AAAAA Pattern stuck in there.

Lessons Learned and Next Up

  • It is good to document the process in case something goes wrong
  • The start and end points are needed for each chromosome
  • The start and end for each centromere is needed also
  • Attention is needed for the location of each crossover and who it goes to as this is a main point of all the work.
  • Changes along each copy of the chromosome are gradual. They happen one at a time and those one at a time changes correspond to siblings.
  • Next up is filling in the blanks. That was discussed briefly in this Blog.

Raw DNA From 5 Siblings and a Mother: Part 2

In my previous Blog, I started to phase 5 siblings based on their raw data and the raw DNA data from their mom. I looked at homozygous results. That is, when each sibling had the same allele, it meant that they got one of each of those same alleles from each parent. Also when my Mom had homozygous results, say GG, she had to have given one of those G’s to each of her children in that location.

I am using an Athey paper on Phasing from 2010. I looked at his first 2 principles in my previous Blog. Here is Principle 3:

Principle 3 — A final phasing principle is almost trivial, but it is normally not useful because there is usually no way to satisfy its conditions: If a child is heter
ozygous at a particular SNP, and if it is possible to determine which parent contributed one of the bases, then the other parent necessarily contributed the other (or alternate) base.
Heterozygous is a fancy term meaning two different alleles. This principle also lends itself to MS Access, but it requires a few more steps. In my case, the known contributor is my Mom. So in the case where my Allele 1 is different from my Allele 2 and I have an allele from mom. My allele from dad will be my other allele. I just have to make a formula out of that. It sounds like a high school math word problem.
First, I copy my homozyous allele from mom table to a new table. This is in case I make a mistake and have to go back to my previous table. I’ll call my new table, ‘tbl5SiblsHeteroMomtoDad’. Again, I’ll use an Update Query, to update the table with the new ‘from Dad’ alleles. There shouldn’t be an allele from Dad in any of these situations, as we have only put those in where the children were homozygous.
I used the Access Expression Builder to get my heterozygous results:
Here is the second part of the criteria:
This part says that where I’m heterozygous, and my allele from mom was allele1, put allele2 in as from Dad. Before I run this, I presently have 485,834 alleles from Dad. When I go to run the Update Query, I get this message:
After I run the Update Query, I now have 533,517 results. This is the same as 485,834 plus 47,683, so I assume that I am on the right track. I next have to run this one more time for myself for the case when my allele from Mom is allele2 and my allele from Dad would then be allele1. Then I will run this eight times for my four siblings.
5 Phased Sibs Update: V1 and V2

I did all my Principle 3 phasing and here is the update:

What is a little surprising is that Jon and Lori who were tested as AncestryDNA V2 had more Mom-phased alleles. I did mention above that they were getting extra phasing on SNPs that they hadn’t tested from their mom, but I didn’t realize how much.

I mentioned in my previous blog that the combined number of SNPs tested between V1 and V2 is 942,269. That number represents the merging of V1 and V2.

Also some of the specifics are a bit off. For example, my numbers include phased results for myself from my dad (16,536) on the X Chromosome. Well, I didn’t get an X from my dad. This means that the JoelfromDad and JonfromDad numbers above are a bit high.

Next up: DNA patterns


Playing With Raw DNA Data From 5 Siblings and a Mother: Part 1

In many past Blogs, I have written about the raw DNA data of my siblings and my mother. They can be searched in my Blogs under “Raw DNA Data”. First, I looked at three siblings compared with our mom. Next I looked at the results of four siblings. Now I have a 5th sibling tested.

Phasing With Raw DNA Data

The reference I use is Whit Athey’s 2010 paper called, Phasing the Chromosomes of a Family Group When One Parent is Missing.

Basically, Whit uses certain rules and iterative processes to fill in blanks of what the parent’s alleles would be as passed down to their children. From these lists of alleles one can see patterns. From the patterns, one can see where the maternal and paternal crossovers would be. The process is similar to the visual phasing process developed by Kathy Johnston. However, Kathy’s version does not require the use of a parent. Also Kathy’s version does not require looking at hundreds of thousands of alleles.

Lori’s raw data

The fifth sibling in my family to have an autosomal DNA test is Lori. She tested at Ancestry DNA. First I unzipped her results. They open in notepad. I then opened those results in Excel, so all the data would align in columns.


The columns are a SNP ID, the Chromosome, the position on the Chromosome in Build 37 and allele 1 and 2. I added Lori to the allele columns, so I could distinguish between siblings when comparing. One quirk is that when I convert from text to Excel, the blanks in the allele columns go to zeros. I then have to search for all zero’s in those columns and replace them with blanks. The blanks are no-calls.

This data shows Lori’s alleles unsorted. We do know that where she has a C and a C, that one is from her dad and one from her mom. However, where she has an A and G on Line 380436, we don’t know which is from her dad and which is from her mom.

Lori’s DNA in MS Access

I didn’t realize I could upgrade my old computer to Windows 10. It was just new enough to do that. When I did that, I rented Office 365 which includes Access. Access is good for comparing large amounts of data. Lori has 666,531 lines of data. There are 2 alleles for each position. So with six sets of data, that is a lot of alleles. I figure about 8 million. However, the crossovers occur at a distinct point. Finding crossovers is like finding a needle in a haystack.

First I import Lori’s Excel File into Access. It looks pretty much the same there. Except that Access adds an extra ID to keep track of things. Next I want to make an Access Query based on Athey’s Principal 1:

Principle 1If a person is “homozygous” at a location that is, having the same base on each of the two chromosomes of a pair, then obviously at that location it is possible to know with certainty that both chromosomes of the pair have that base at that location, but this is an almost trivial form of phasing.

Principle 1 in Access Query form

Here is Lori’s first query in design view:

It’s a bit small. All I did is put all of Lori’s imported raw data into a query. Then in the last columns I created a field called Lorifromdad. Then there is a formula that says if Lori’s allele1 is the same as her allele2, then put in allele 2. When I run that query, I get this:

Next, I want Lori from mom, which will look the same as Lori from dad. This is easy. I can just copy the same formula and give it a different name:

Also, I forgot that Ancestry has other DNA information in the raw data that I don’t need so I need to restrict the data to Chromosomes 1-23:

It’s nice to check the results to make sure you are getting what you want. This looks pretty simple, but Access does this operation over 600,000 times, so it saves a lot of time.

Next I add Jon:

I have the same kind of formula to Jon’s homozygous results from his mom and dad. I made an equal join in the query above. Note that Jon and Lori both tested with AncestryDNA V2. That means that they have the same SNPs tested. My 2 sisters, my mom and I all tested with V1. So we have to be careful with these joins. If I was to have used an equal join between a V1 and a V2 test, I would only get the results which were common to both.

When I view the query above, it looks like this:

Note that on the third line, Lori has homozyzous results and Jon does not.

Adding AncestryDNA V1 and V2 raw results

The next step is that I would like to carefully add the V1 homozgous results to the V2 homozygous results. Also I would like to make a large table out of what I get.

  • On my existing V1 Homozygous Table, I have 700,153 rows
  • On my new V2 Homozygous Table, I have 666,153 rows
  • The V1 SNPs that are the same as the V2 SNPs are 424037 rows or results

That means that I would like to have a table that has the V1 results plus the V2 results, minus the results in common, so that should be 942269 rows. Somehow I ended up with such a table. I know that’s not very scientifically reproducible, but that is what happened. I’m not sure how important it is to have the V2 results as they won’t phase with my mom. However, I’ll have them in case I need them.

The results of the query left the two V2 siblings’ results on the bottom of the table, but they can easily be sorted:

Principle 2

According to the Athey paper:

Principle 2 — If data from one of the parents are available, and that parent is homozygous at a SNP location, then another almost trivial phasing is possible
since obviously that parent had to send the only type of base s/he had at that location to the child.


This principle lends itself to Access. Basically, I want to tell Access that if Mom has the same two alleles, then show that each child got that allele from her. However, there are a few considerations. If mom has no-reads and the child doesn’t, then we don’t want to overwrite a good read with a bad one. The other consideration is, if mom had an incorrect read and the children had a correct one, we wouldn’t want to overwrite that either. However, I don’t know how rare that is. I guess it is pretty rare. I did a query to check and didn’t find any such instance. So that is one less thing to worry about.

Principle 2 in access

I want to say if mom has two non-null alleles that are the same, put that allele in as from her for all her children. Looking at my old queries, it looks like I need an Update Query. First, I copy my previous table of results to a new table called tbl5sibsMomHomozygous. I’ll try this query:

Before I update, I’ll take a view:


If I take out the ‘And is not null’ statement, I get the same results. I then changed the syntax to ‘Is not Null’ first and got one less record: 481977. It makes me wonder what that record is? I’ll use my second wording as it may be more accurate. Next I hit the !Run button and it updates the table I recently made.

This will give V1 mom alleles to Lori and Jon even when they weren’t tested for them. Here is an updated table view of just the alleles from Dad and the alleles from Mom:

I picked these results at random about halfway down the table. It looks like about half the alleles are filled in already. So now my siblings are more than half phased. The first 5 rows are alleles from Dad for each of the 5 siblings. The 2nd five rows are alleles from Mom for those same siblings.

a pattern preview

The highlighted row shows a pattern from Dad and one from Mom. The first row also shows the same pattern. This is what we will be looking at later in more detail to determine crossovers on the maternal and paternal side. This is what I’ll call the ABABA pattern for both. Here it is coincidental that both the Dad and Mom patterns are the same. Obviously with 5 siblings, there will be a lot of different types of patterns:

  • AAAAA
  • AAAAB
  • AAABA
  • AAABB
  • AABAA
  • AABAB
  • AABBB
  • ABAAA
  • ABAAB
  • ABABB
  • ABBBB

Those are the combinations that I can think of right now. AAAAA is a special case. This could mean that all five siblings could share the same grandparent or sometimes an AAAAA pattern is that way by coincidence. Where the maternal or paternal pattern changes is where the crossover is. This pattern should be gradual. That is, only one letter should change in a pattern change. For example, ABABA may change to ABABB or AAABB. There are many possibilities but only one letter will change. The placement of the letter represents one sibling. So that sibling will own that crossover. For example, a maternal ABABA to ABABB change would represent a maternal crossover for Lori as she is in the last position on my table. The place where the A goes to a B is the location of the crossover.

Next Up

Next up is Athey’s Principal 3 as it applies to 5 siblings and a Mom.


Chasing Down My Wife’s Rooney Connections

My wife’s father is half Irish and half French Canadian. On the French Canadian side there seems to be  a lot of genealogy and a lot of DNA matches. On the Irish side, there is a not so much genealogy and a lot less identified DNA matches.

Mapping the French Canadian and Irish In Laws

I have used a method to map out my father in law’s DNA that he got from his four grandparents. To do this, I compared him to his two sisters, Lorraine and Virginia. Here is their Chromosome 14.

The good news was that I could map the Chromosomes by looking at the DNA results of the three siblings compared to each other. Then I could find many matches to reference the French Canadian side. That got me the LeFevre and Pouliot grandparents above. The problem was that I couldn’t find enough matches to reference the Irish side.

Gaby to the rescue

However, on AncestryDNA I found my wife’s 2nd cousin on the Irish side. Because of Gaby, I can now tell which of my father in law’s grandparents are Irish.

Any DNA matches that Gaby has in common with Lorraine, Richard or Virginia are Irish. Gaby and my wife Marie, share the same Butler and Kerivan Irish ancestors. The next problem is that we can’t tell whether these matches are Kerivan or Butler.

Working Gedmatch To Get Kerivan and/or Butler Matches

In order to separate the Butlers from the Kerivans, we need to find matches that are further out. To find these I looked at DNA matches at Gedmatch that matched both Gaby and Lorraine. I used Lorraine because she was tested at AncestryDNA. The matches would be on the Irish side. That was the first cut. Next, I hoped that some of these matches would have trees at Ancestry that would match my in-law’s tree.

For example, here is someone that matched both Lorraine and Gaby on our example Chromosome 14.

The above image shows how Lorraine matches someone with a Rooney name (#1) and Gaby (#2). This tells me that this Rooney match is on the paternal side or Irish side, so that is also good. The other good thing is that my father in law’s grandmother’s mother was a Rooney:

All I have to show is that the match indicated in yellow above with the Rooney name is related to Alice Mary Rooney above. There were other common surnames, so the match didn’t have to be a Rooney. However, I noticed that there were some Rooneys in Massachusetts which is where my wife’s Rooney ancestors lived. Based on that, I thought that it would be a good idea to start with Rooney.

Doing the Rooney Genealogy

Lorraine’s Rooney AncestryDNA match that is also at Gedmatch and matches with Gaby at Chromosome has a Rooney Tree:

However, these two trees seem a little out of whack. Maybe Timothy Rooney in my wife’s tree could be a brother of Terrance Rooney in the Rooney tree?

A third Rooney Tree

I found another Rooney tree as an Ancestry Hint. It looks like this in a different view:

This tree shows that Timothy Rooney had two wives. It appears that Margaret Gorman was the first wife and had a John Rooney born 1827. Apparently Ann Nancy Lilley was the second wife and had Alice Mary Rooney. That could explain why the two trees didn’t match up. This tree shows the Terrence Rooney from the Rooney Tree as the same Timothy Rooney from my tree.

Putting the rooney trees together

Assuming that the Rooney Tree reconciliation was correct, the Rooney DNA match on the bottom right in purple would be a 1/2 third cousin once removed to my father in law Richard and his two sisters.

Back to the Chromosome 14 Map

That looks better. We now have the paternal side thanks to Gaby and a Rooney match. When I check the Rooney match, he matches Lorraine and Richard, but not Virginia.

The yellow matches on the Gedmatch Chromosome browser correspond with the green in the Chromosome 14 map above. The crossover for Richard at 54M also shows up.

The other good thing about the new Chromosome map is that it shows where the Butler matches would be. This is like a spy glass looking into the past. A match on the Butler side is like a match with Virginia’s grandfather who was born in 1875. Matches to these grandparents should be helpful in straightening out my wife’s Irish genealogy.

Summary

  • Use a paternal cousin to find other paternal cousin matches that are more distant
  • Connect that further out cousin to a known ancestor
  • Use that further out cousin match to complete a Chromosome map
  • Use that completed Chromosome map to identify other cousins as they match in identified areas of the Chromosome map representing grandparents of my father in law.
  • Use those identified matches to focus on further genealogy and break down former research barriers.
  • This method works best with people that have DNA testing results at both Gedmatch and Ancestry.

Double Visual Phasing

Many articles have been written lately about visual phasing. This is a method developed by Kathy Johnston. I would like to write about double visual phasing. Previously, I had tested my father in law and his two sisters and tried visually phasing them. Here is the result of my attempt to visually phase their Chromosome 15:

Chromosome 15 – Richard and Sisters

I can tell that I did this a while ago as it was done in MS Word which I don’t use now for visual phasing. L is Lorraine, R is Richard and V is Virginia.

What is Double Visual Phasing?

This is a term I made up. I’m guessing that others have tried this, but I have not seen any Blogs on the subject. Richard has a second cousin named Fred. He is related on the Pouliot side (in orange above). Fred has had his sister Sleuth tested and his brother Don. If I phase Fred and his two siblings who are related to Richard and his two siblings, I’ll have double phasing. As they both share a Pouliot grandparent, it will be interesting to compare the results.

A Brief Genealogy

For the purposes of this Double Visual Phasing, here are the people involved:

Let’s Visually Phase Fred and His Two Siblings on Chromosome 15

The first step is to compare the three siblings to each other at Gedmatch.com using the Chromosome Browser:

I used MS Excel for this and I adjust the columns to the segment changes. Note that all the segments don’t line up perfectly, but I’ll say they are close enough. Next I add locations in millions:

I also put in darker vertical markers. I’m hoping that the places where the segments don’t align perfectly do not indicate additional crossovers.

Next I need to show who the crossovers belong to:

From this, it looks like Fred has four crossovers, Sleuth has two and Don has only one. Fred’s first crossover is at position 22M.

Next, I can assign colors based on Fully Identical Regions (FIRs). In these regions, there will be a match on both one maternal and one paternal grandparent. These grandparents will be represented by two of the same colors in that region extending to the person’s next crossover.

Where there is no match, I can assign two different colors and extend those to each persons’ crossover.

I make sure that the boundaries for each person line up with their crossovers. So on Fred’s map his first FIR with Don is short as it is within Fred’s two crossovers.

Mapping Half Identical Regions (HIRs)

Here I get one chance to map an HIR. My inclination is to map the HIR on the right between Sleuth and Don. My reasoning is that Sleuth is already at her last crossover at that point, so I’ll extend her segments all the way to the right. I already know from my previous map for my father in law’s family that Fred has some matches with my father in law and his two sisters on the left side of Chromosome 15 shown in Orange. So that information may help me map the left side of Chromosome 15:

Chromosome 15 – Richard and Sisters

Here is Fred and family’s partially completed Chromosome 15 with the HIR added for Sleuth:

However, there are blanks. Also we haven’t figured out which side is maternal and which side is paternal.

Two other testers

There are also two other testers: Patricia and Joe. They are my father in law’s first cousins. They are related like this:

The next thing I do is to compare all these eight people in gedmatch.com to each other. I download the results into a spreadsheet. Here are the matches on Chromosome 15:

I have the matches between siblings filtered out so they don’t show. I have Fred, Don, and Sleuth in the first column and the others in the second column. Every match represents DNA from Joseph Pouliot (or his wife Josephine Fortin – let’s not forget her). The way I have it mapped right now, the most important match is Joseph to Don and Sleuth. The only place that match could be is on the blue portion:

This is good news, because this sets the paternal and maternal sides for Fred, Sleuth and Don. It also sets where their paternal grandparents are. Here are Fred’s grandparents:

That means that blue is Pouliot and pink is Ford. Like my father in law’s family, Fred has a French Canadian side and an Irish side.

Next, we should be able to fill in the left side of the puzzle using the other matches:

A few observations:

  • The same match that Fred had with my father in law’s family helped finish my father in law’s visual phasing and Fred’s visual phasing.
  • All four of Fred’s grandparents DNA is represented between the three siblings. The one exception is a small portion of green from 22 – 27 M on the maternal side
  • The purple segment that Fred has from 22 – 27 seems quite small. It is a little unusual to have a small internal segment like that. By internal, I mean a segment that is not right on either end of the chromosome
  • Without the match between Joe, Sleuth and Don, I don’t know if I would have been able to complete this Chromosome
  • I don’t know about Fred’s maternal [Irish] side. He may already have matches that would identify the Halloran and Drennan DNA.

Comparison of the Double Visual Phasing

  • Unlike Fred’s results, my father in law’s family does not have good Pouliot coverage (in orange) between the three siblings.
  • This explains why Richard’s family matches Fred’s family in the beginning of the Chromosome and not the end. Pouliot DNA is missing between 60 and 95M.
  • It appears that Sleuth and Richard could have matched between 95 and 100, but I didn’t find a match over 3cM. Could this be because one received DNA from Joseph Pouliot and one received DNA from his wife, Josephine Fortin? Perhaps this is also an explanation of why the match between Don and Viginia (V) stops at position 38M.

Summary

  • Double visual phasing has benefits in that there are at least six people to compare matching DNA results with each other.
  • Double visual phasing should result in a crosscheck for the visual phasing of each family and better Chromosome maps of contributing grandparent DNA.
  • There are benefits in noting which group has the better coverage of DNA of a shared ancestor.
  • Comparison of results appear to indicate deeper crossovers between ancestors

Next Up

There are matches between Fred and his two siblings and the other five tested people on every chromosome except for 18, 19 and 22. That should make mapping the chromosomes with matches relatively easy.

I would like to try double visual phasing between two sets of siblings where the siblings are from different generations. However, it may take a while to get the additional samples done.

Cousin Rusty’s Surprise YDNA Results

First, my first cousin Rusty surprised me by ordering an autosomal DNA test. I saw his results and it was the first, first cousin autosomal match that I’ve had. Next, Rusty decided to order a YDNA test of 37 STRs. His results surprised us both a bit. He found out that he had no matches to the last name he grew up with. Instead, his matches were predominantly variations of the MacFarlane surname. Since the test results came in, Rusty tells me his grandfather was adopted which could account for the surprise.

In this Blog, we’ll look at Rusty’s YDNA results and some of his genealogy.

YDNA – The Male Lineage Indicator

YDNA is good for surname studies. It follows the DNA that the father passes down to the son. This passing down has been going on since genetic Adam. Little changes in this YDNA account for the various YDNA branches that are in the world today. In addition, there are other branches that have just died out.

R1b – The Common YDNA for europe

Rusty and I share an R1b heritage. We are both on a branch of the R1B tree called L21. I was glad when I was first testing my YDNA to find out that I was part of the L21 group. This represents a group of people that aren’t identical to, but are associated with what has commonly been called the Celts. These would be the older people of the British Isles prior to invasions by the Danes, Vikings and Anglo-Saxons. The dark red indicates the older L21 people being moved over to the Northeast by the later invaders.

This map shows the highest concentration of R-L21 in the NW of Europe. The map shows the association with the Celtic cultures of Ireland, Scotland, Wales and Normandy.

The R-L21 Tree

Here is an outdated R-L21 Tree

The main reason that the tree is outdated is that the tree grew so much, there was not room to put all the branches on it. There are two main branches under L21. I believe that Rusty is on the smaller branch of DF63 at the top right of the image above. I am on the larger DF13 Branch. Below that I am in the L513 Branch with a rectangle around it.

R-DF63

Why do I think that Rusty is DF63? Let’s take a look. Rusty recently upgraded his 37 STR test to a 67 STR test. The STRs are markers that can change in two different directions. These STRs are used to estimate how close someone else may be related. They are also used to estimate SNPs. DF63 is an SNP. This is a more marker that is more stable than an STR that indicates a specific branch of mankind.

Here are Rusty’s two closest STR matches.

Both these matches are a Genetic Distance (GD) of 3 from Rusty. That means that out of the 67 STRs compared, there is a difference of three for both of these men to Rusty. Both these men have McFarland ancestors. Note that the first one had an ancestor that was born in Northern Ireland and died in PA. Rusty is from PA, but his grandfather was from Ireland. This means that this particular person could not be Rusty’s ancestor, unless he left children in Ireland.

Here is the TIP report for these two as they compare to Rusty. This report shows the probability of how long ago Rusty and Rusty’s match had a common ancestor:

This is showing that it should be pretty likely that either or both of these matches should predict a common ancestor in the last 8 generations. When I check 8 generations in my tree, that brings me to about 1680. So that is in the range of the first ancestor shown in the list above.

This is interesting, but I still haven’t shown how Rusty could be DF63. Let’s look at Rusty’s top two matches again. On the right are their Terminal SNPs. The first Terminal SNP is R-CTS6919. The second is BY674. These are both under (or children of) DF63 as shown by the FTDNA Haplotree:

So it stands to reason if Rusty matches two people who have SNPs that are below DF63, then he would surely be DF63.

BY674 – Mostly McFarlanes

A lot of McFarlane descendants have taken the BigY test. This is a test that discovers new SNPs and helps to build new branches of the SNP tree (or Haplotree as FTDNA calls it). Those that have taken the BigY test, have been put into something called the Big Tree, created by Alex Williamson. Here are the McFarlanes in that Big Tree:

Note that there is a McFarlane or similar name in every branch of BY674. The one exception is the McAfee/Givens branch. Based on this, I could argue that Rusty is not only DF63, but also BY674. Rusty plans to take the DF63 panel. With that test, he should be able to tell which branch of McFarlanes he is in. Here is what the DF63 Panel looks like:

So if Rusty takes the SNP pack, it should tell him that he is positive for DF63, CTS6919, A92, Z16506, and BY674. From there, Rusty could be in 7 different branches. One of those branches could be that he would remain in BY674 with McFarland and McKinnon. If he is in one of the other 6 branches, there may or may not be branching below that.

The MacFarlane family ydna project

Rusty also joined the MacFarlene Family YDNA Project. He was placed in this group:

I think that the Cadet Lineage refers to the idea that the MacFarlane Clan may be an offshoot of the House of Lennox. That sounds like a big deal.

So that covers Rusty’s YDNA pretty well. He is related to McFarlanes by STRs and SNPs. Next, I’ll look at Rusty’s genealogy and see how he is now apparently a Scotsman where before he thought he was an Irishman.

Rusty’s Paternal Genealogy

Rusty is related to me on his mother’s side. I’ll be looking at his dad’s side. And specifically, I’ll be looking at his dad’s dad’s side. We are interested in how the Breen turned into a McFarlane going from now to then. Or how the McFarlane went to a Breen. So far the tree looks like this:

However, I won’t be following the McCullough line. Rusty says that his dad told him that his father was orphaned young and joined the British Army at age 14. Rusty further got in touch with his cousin and found this out:

She thinks it is probably due to my grandfather being adopted.  I knew this, but always assumed he was older and retained he biological fathers name.  Actually I knew he was orphaned.  Margie says he was brought up by a Other than Catholic minister, but that there was some sort of agreement that he was to be raised Catholic.  Maybe he never knew his biological fathers name.

What an interesting story. It looks like Rusty’s grandfather may have been brought up by a non-Catholic Minister that raised him as a Catholic. How did that work out? What was the minister’s name?

Barriers of distance and time

Distance and time tend to erode family stories. Traveling from Ireland to the United states as well as the loss of parents results in the loss of a lot of family history. Where did John Alexander Breen come from?

Naturalization records

John left some paperwork behind when he came to the U.S.

In this document, John said in 1917 that he was 29 and wanted to become a citizen. It shows he was 1/2 inch short of six foot tall. His residence in Ireland was what looks like Omagh, County Tyrone. At the time of the application, he was a steel worker in Philadelphia. He came into the port of New York on the Ship California in what looks to be September 29th, 1910. This document from Ellis Island on the Declaration appears to correct his arrival time:

According to his 1923 Petition, he was born in County Armagh:

Here’s a simple map of Northern Ireland:

From the Naturalization records, it appears that John Alexander Breen was born in County Armagh and later lived in Omagh in County Tyrone before coming to live in Philadelphia. However, based on the research that follows, perhaps Count Armagh got mixed up with Omagh. I’m not seeing other evidence of County Armagh.

Sailing on the s.s. california

I have the an image of the ship records when John sailed to the US from Londonderry. Here is some information from the top of the ship record:

I included last address and nearest relative for John Breen on the bottom. Then I included three other people near him as they had an Omagh/Philadelphia connection. Here are the names, in case there is any connections:

Of course, this raises a few questions. Who is Susan Breen if John was orphaned and adopted? Was that her maiden name? Was that her married name, and if so might she have been married before? From what I can tell, Susan was living in Deverney:

According to Townlands.ie, Deverney is a part of the Townland of Recarson.

The second page of the shipping record says that John was also born in Deverney. Also that he planned to stay with a friend, rather than a relative in Philadelphia:

Here ‘s the shipping record from the UK side showing that folks kept the same order. Now John is a mechanic.

1911 British census

One year before John sailed to New York, he was indeed in the military.  He was a private with the 1st Battalion Royal Innishkilling Fusiliers.

I highlighted his birthplace. It would be nice to know where this is. I am not getting Deverney out of it. Apparently, this is Drumragh, which is both a Civil Parish and Townland near Omagh. Here is where townlands.ie shows the Townland to be:

This looks to be fairly close to Deverney.

Other Irish census results?

I am having trouble finding John Breen in the 1901 Census. I am also having trouble finding Jane Breen. So I will look at the women that were traveling with John on the Ship to New York.

The first I’ll look at is Mary McGinn. I see her in 1911:

Her story holds together as she is a seamstress. She was likely closer to 29 than 25 when she sailed to Philadelphia. Let’s say that John was watching over these women on the way to Philadelphia. After all, he appears to have been a world travels already from his British Army experience.

Here’s Tattyreagh where Mary McGinn lived:

Next is Mary McGaughey:

Here is the seamstress connection. She is shown in 1911 in Aughtermoy (Ballyneaner, Tyrone). On the ship, she gives her cousin Charles McGinn as the closest relative for some reason. I’m not positive I have the right person above as on her ship record, she says her last address was Philadelphia. Also this family was Presbyterian.

John in the 1st Battalion Royal Innishkilling Fusiliers

Rusty mentioned his grandfather’s military service. From the census, I found John in Hong Kong in 1911 with the 1st Battalion Royal Innishkilling Fusiliers. After some searching I found an enlistment record dated June 29, 1908 for a John O’Brien:

This could explain why it was so difficult to find John Breen in the 1901 Census. Now, when I look up the Breen surname online, I learn that the name comes from O’Brien if I understand it correctly. This military record is interesting as we found out in the 1911 Census that John was with the Fusiliers. The age of this person is very close to the John we are looking at.  20 years and 4 months from this time would put us at February or March of 1888 and John was born March 1888.

Are John Alexander Breen and John O’Brien the same Person?

The enlistment paper above shows that O’Brien was born near Drumquin, Parish Longfield, County Tyrone. If nothing else, I’m learning a bit about Northern Ireland geography.

The 1901 Census shows a John O’Brien as a servant in Doogary:

Here is townlands.ie rendition of Doogary near Omagh.

Under the scenario, John O’Brien would have been orphaned and became a servant. Probably soon after 1901, he joined the army. Note that when O’Brien signed in 1908, he was already part of the armed services.

O’Brien’s re-enlistment showed that he was already part of the Innishkilling Fusiliers. I am guessing that at some point in the Fusiliers, O’Brien changed his name to Breen.

More military papers for O’Brien

Under O’Brien’s 1908 enlistment papers, I found other military records. This is O’Brien’s initial enlistment from [February?] 1905:

Assuming O’Brien and Breen were the same, the age would be very close, as he would have been 17 within a month. Interesting that in 1905 they asked about O’Brien’s present (or former) Master. This appears to be M. McNulty in or near Dromore.I’m a little curious as to the term Master. I assume that this means that under a certain age, you were under the control of a Master, be it your father or someone else.

Dromore is shown on the previous Drumquin map:


On O’Brien’s Military History Sheet, I find this:

So if Breen and O’Brien are the same, then I have to work out why the mother was Susan Breen for one and Annie O’Brien for the other.

Annie O’Brien

Going with my Breen/O’Brien theory, it would make sense to look for Annie O’Brien in the Census. The oldest Annie O’Brien I found in the 1911 census in County Tyrone is here:

She is listed as 37 which would make her 14 in 1888. However, ages are quite unreliable in the Census. She could have been much older in 1888. I find it odd that a single woman would be the head of household, by herself and a dairymaid. Here is the Townland of Ballyard where she is shown as living:

Let’s try 1901. Now there are a lot of people listed with Annie. She is in the same Townland of Ballyard, though perhaps not the same house.

Look at all the company she has now. Annie’s age is consistent with the 1911 census as she is now 27. Following out on my house of cards theory. What if this was the family that raised John Breen/O’Brien? Annie is the only Catholic in the house.

Summing It Up

I could tell a story about what I’ve found so far. I’m not sure it’s right yet, but it’s a start.

Annie O’Brien was born in County Cork and made her way as a teenager to County Tyrone. While there [probably Deverney], she had a child John Alexander O’Brien. She was apparently a single mother and was taken in by a protestant family. Perhaps this is the same family of Funstons in Ballyard where she was a dairymaid in 1901. Perhaps the father was a McFarlane. John went to work as a farm servant in Doogary. John enlisted twice in the Royal Ennishkilling Fusiliers where he apparently traveled to Hong Kong as he was there in 1911. In 1912, he sailed from Londonderry, Ireland to New York. From there he made his way to a friend’s house. The rest, is history.

Postscript: 1920

However, there is a little more. There always seem to be with genealogy. Fast forward 8 years to when John Alexander Breen is married with two children. Here they are on 1208 Eleventh Street, Philadelphia:

I notice a boarder named Felix McAnulty. This reminds me of John O’Brien’s Master M. McNulty when John first enlisted in 1905. Also next door is John Cassidy. Remember, John was going to stay with an Eliza Cassidy in Philadelphia when he sailed from Londonderry to New York.

I wasn’t able to find Felix in the Irish 1901 Census, but I did find a Falix:

This place is very close to Deverney which is one of the places where John was supposed to have been born:

Actually, it seems like I’ve covered almost everywhere around Omagh. So that seems to be it for now. If my story is right, Rusty is still a Breen, or rather an O’Brien through Annie. And he is a MacFarlane.

Late Breaking News

I just checked the 1911 Census again. This time, I see that there is a John Breen listed there in Recarson. This is quite confusing but may be good news.

This will certainly change the story. It is not now clear if the John O’Brien in the military is the same one as the one in the Hong Kong Census or the one here (or neither). The interesting thing about the document above is that this is for Recarson. Recall that Deverney where John was from is part of Recarson. My understanding is that the Census was to be taken at the same day for everyone, so unless there was some mistake, John Breen could not have been in Recarson and Hong Kong at the same time.

My, this is embarrassing. Now I have two competing stories for Rusty. Let’s say that this should be more accurate. The best part about the census above is that there is a grandmother. That means three generations are represented as well as other relationships. That is always good. I’ll leave it to the reader to adjust the story based on the Census above. I’ll continue this story in a subsequent Blog.


Determining Whether a Match Is Irish Or French Canadian By Visual Phasing

In this Blog I will look at a DNA match that my in-laws have. I would like to know whether the match is Irish or French Canadian. I will use Visual Phasing of my father in law and his two sisters’ DNA match to try to figure that out.

Irish at First Look

Something caught my attention with one of my father in law’s matches at FTDNA. My father in law Richard’s match Ann had this tantalizing detail under her Ancestral Surnames:

White (County Waterford Ireland to New Brunswick Canada)

I had recently found out, with the help of DNA and DNA researchers, that my father in law’s immigrant ancestor had shipped out from Waterford to New Brunswick. I have very few DNA matches for my father in law on this Irish side that I have identified. Most of the matches are French Canadian.

Irish or French Canadian?

At first, I didn’t notice other French Canadian names in Ann’s ancestry. However, after finding out she was listed at Gedmatch and Ancestry, I looked at her Tree and did see some French Canadians.

Visual Phasing

I do have DNA from my father in law Richard and his two sisters Lorraine and Virginia. So perhaps Visual Phasing will give and answer to the question whether the match with Ann is French Canadian or Irish. Ann’s best match to Richard, Lorraine and Virginia is on Chromosome 9:

Lorraine has the largest match above followed by Richard and Virginia. It looks like Richard and Virginia have crossovers at about position 107M.

I have used MS Word for phasing, but it wasn’t the best. PowerPoint worked well, but lately I have preferred using Excel. First I cut and paste the comparison of the my 3 in-laws into Excel.

Then I add the crossover points for the three siblings:

At first I thought that the first crossover belonged to Richard. however, there is a short break in the Lorraine V. Virginia comparison, so that adds an additional first crossover for Virginia. Actually the Virginia/Richard should be Virginia/Lorraine. There are likely 2 close crossovers there. I ignored the last small match between Lorraine and Virginia as there wasn’t anything going on in the comparisons above and below that match. Next I add the locations of the crossovers:

Lorraine and Richard have the largest Fully Identical Region (FIR) shown in green. I map that with the same two colors for Lorraine and Richard:

Lorraine only has two crossovers, so we extend her colors all the way to her left crossover and on the right to her crossover (L):

As Lorraine only had two crossovers, this perhaps explains why she had the largest match with Ann on Chromosome 9. Next, I fill in FIRs and Regions that don’t match (shown as red in the Gedmatch comparisons) with corresponding colors:

Unfortunately, that lead to a bit of a dead end. Instead, I’ll try starting with the Richard and Virginia FIR on the bottom comparison:

This version looks better. Next we choose a Half Identical Region (HIR) shown as yellow above. The longest one starts at position 14 between Lorraine and Virginia. A HIR maps as matching only one color and not matching the other.

Above, I chose for Lorraine and Virginia to match on the green and not match on purple and yellow. That is how the HIR is represented. I can then extend Lorraine’s purple and green to her crossover (L) on the right and fill in more FIRs and non-matching areas:

Now, except for the two ends of Virginia and Richard, I have a four grandparent map represented by four colors. Next, we have to identify the grandparents.

The Pouliot French Canadian Connection

One of my in-laws’ grandparents is a French Canadian Pouliot. Fortunately, my in-laws have a Pouliot cousin named Fred. Fred’s sister has also tested. Here is Fred’s matches with Virginia (78-83.5 and 107-110) and Richard (107-115).

Here is Fred’s sister’s matches with Virginia, Richard, and Lorraine.

Note that Lorraine only has one small match with Fred’s Pouliot sister. This is leading me to believe that the match with Ann is on the Irish side. Can we use these Pouliot matches to identify our blank map above? I think we can. The 2 green matches above are for Virginia and Richard at 17-31M. The only place between 17 and 31 where Fred’s sister could match Virginia and Richard, but not Lorraine is on the yellow. If the match were on the green segments, Fred’s sister would have had to have matched all three siblings at that location. Note that mapping out the smaller matches should also be on the yellow segments.

I should point out that my in-law’s had a father of Irish descent and mother of French Canadian descent. This means that both their paternal grandparents were Irish and both their maternal grandparents were French Canadian. As Pouliot is the maternal grandfather, that sets the maternal side of the map as yellow and purple. That also sets purple as the other maternal grandparent: LeFevre. Further, salmon and green now represent the paternal Irish grandparents.

So Is Ann a French Canadian or Irish Match?

Although I was leaning toward the Irish earlier, I now think that the match is French Canadian. Take another look at the match between Ann and Lorraine, Richard and Virginia:

The pattern looks a lot like the purple LeFevre segments. Lorraine’s larger match is on top. Richard’s green match stops where the purple LeFevre segment stops. Virginia’s smaller blue match starts where the purple Lefevre segment starts again. I’ll put the matches in the same order as Gedmatch to make it easier to see:

If Ann were to have matched on the green paternal grandparent area, there would have have to have been three equal matches in that region shown on the Gedmatch browser.

The fact that Ann did not match with the French Canadian Pouliot grandparent did not mean that she was an Irish match. In this case, it meant that she matched the other French Canadian Grandparent.

Summary and Conclusions

  • Visual Phasing can help map an unknown match to a grandparent.
  • That phasing needs to be in conjunction with at least one known cousin to identify a grandparent.
  • These results help to know where to invest genealogical research time. There is no sense in barking up the wrong tree.

An Updated Z17911 Hartley STR Tree

In my last Blog on the subject, I wrote about a Hartley Z17911 STR Tree. Since that time, I created a broader Z17911 STR Tree. However, that broader tree was not the best idea. Soon after creating that tree, I found out that at least one person in that tree was actually in a new SNP group further downstream from Z17911. This was based on Big Y and SNP testing. Within not too long from creating my tree, the SNP tree as created by Jared Smith went from this:

to this:

The link to Jared’s Website is here.

So, while Goff appeared previously to be in my SNP group, in fact, he was not. He was as far as 4 SNPs away. That means that any closeness in STRs could have been coincidental. When comparing SNPs and STRs, the rule is that SNPs take precedence.

A STR Tree for Hartleys Only

At this point, it seems to make sense to create a Hartley only STR tree. There is still no guarantee that Hartleys that are related to me by STRs will have the same SNP results as me. However, I think that it is more likely than not that they will.

Since my previous Blog, there have been two new Hartley STR testers. I have the results for one of those that tested at 67 STRs and one I don’t have results for yet who tested at 111 STRs. Previously, there was one other Hartley testing at 111 STRs. I have had my STRs tested indirectly through the BigY test. YFull analyzed 500 of my STRs – although some of the results were inconclusive. That means that there are three Hartleys with about 111 STRs tested, but I only have the results for two. I should be able to create a very simple tree from that.

The First Ever Hartley 111 STR Tree

At least I think it is the first. Those in the group I’ll call West Yorkshire Hartley,  and me. My ancestors are from Lancashire, so I’ll be Lancashire Hartley. I think that this will be interesting as I feel that the Lancashire Hartleys predated the Hartleys for West Yorkshire. However, I get the impression that my Hartley YDNA administrator favors an earlier date for the West Yorkshire Hartleys. Here are the differences in 111 STRs between a West Yorkshire Hartley and a Lancashire Hartley:

There are a few interesting things from the numbers above:

  • The 16357 Mode is the SNP above Z17911, so it would be older.
  • STR 449 could be a back mutation. It goes from 32 to 31 and back to 32 for West Yorkshire Hartley.
  • The 455 STR has an orange number above it. That refers to the slowest STR mutation rate. As that is the slowest STR rate and my result is the same as the 455 modes, I infer that my STR test represents the older Hartley version. However, a sample of 2 is not much.
  • I am a GD of 14 from the West Yorkshire Hartley.
  • Both the West Yorkshire and the Lancashire Hartley are a GD of 7 from the Z17911 mode. That would have given us a tie for the oldest STR profile if we hadn’t considered the effect of mutation rates.
The simple 111 STR Hartley tree

This Tree is a bit on the conceptual side. However, it does point out some things:

  • These two Hartleys likely descend from a common Hartley. However, at this stage, we don’t have the 111 STR Mode for that common Hartley.
  • The STR mutations are therefor shown to Z17911 rather than to a common Hartley.
  • As mentioned above, I favor the theory that the West Yorkshire Hartley Line originated in Lancashire. This is partly based on something called the founder effect. That means that due to the large number of Hartleys in the Colne/Trawden area, it is possible that the area was a founding area for the Hartleys. However, the distance between the Lancashire and West Yorkshire Hartleys is not far.
  • I did not include all the STRs for simplicity. The slowest marker is shown in orange.
  • The three last slower moving STRs (540, 445 and 1B07) are in the 111 panel, so will not show up in the 67 STR analysis.
  • I have the year of 1075 (125 years per STR mutation) shown above. This is supposed to represent a difference of 7 GD. However, I don’t know if that date should represent the Hartley Mode or the Z179111 Mode. If the date were to represent the Hartley mode, then that would likely be at the beginning of when Surnames were beginning to come into use.
  • As the overall GD difference between the two Hartleys is 14, I don’t see how the difference to a common Hartley ancestor could be less than 7.
  • There is also the possibility that these two Hartleys had a common ancestor just before the implementation of surnames and that due to this relationship, common area of origin or by coincidence they both took on the Hartley surname

Back to 67 STRs

Let’s keep the above tree in mind as we get down to the six Hartleys with 67 STRs tested. Checking the tree I made in a previous Blog, I see that Lancashire Hartley (me) and West Yorkshire Hartley were at opposite sides of that Tree:

In the above tree, Hartley #2 is the same  as West Yorkshire Hartley.

The New 67 STR Hartley Tree

The Hartley we want to add is believed to have Quaker roots in Lancashire in the 1600’s. He also is taking a Big Y test which is exciting. The results for that exploratory YDNA test will likely show us the first Hartley family SNP. I currently have many private SNPs. However, once the Quaker Hartley tests, his SNPs that are in common with my now private SNPs should become the new Hartley family SNPs. Here are the new Hartley 67 STR results:

  • Due to the fact that there are now 6 Hartley results, this causes there to be a tie in some of the modes. In these cases, shown with a 3 in the bottom row, I used the older values. This ended up in also being the lower values.
  • I chose to make a split on STR 455. This STR has the lowest mutation rate of those in the table. I didn’t think it likely that these last three results would have mutated independently.
  • This split also separates the two Lancashire Hartleys from the two West Yorkshire Hartleys
  • Again, the Lancashire Hartleys tend to be the older group as they are closer to the Hartley mode by one GD (STR difference).
  • For these markers the Z17911 Mode is identical with the Hartley Mode. This suggests that Hartley is an old Surname.  This result agrees with the 111 STR analysis above.

A New 67 STR Hartley Tree

Here is my interpretation of the above data in a tree form:

  • The Hartley Mode results are shown in 2 boxes at the top of the Tree. This is meant to represent a common Hartley signature or the signature of a common Hartley ancestor in the distant past.
  • I split the two branches at the top based on the slow moving STR 455. These two branches appear to represent a Lancashire Hartley Branch and West Yorkshire Hartley Branch
  • On the Lancashire side, Sanchez and Joel are together due to their STR similarities
  • Similarly, Hartley #3 and Bradford West Yorkshire Hartley are together as due to their similarities
  • It appears that the Quaker Hartley’s mutations happened between the Quaker Ancestor and our Hartley tester. However, these mutation would be spread out up to the common Hartley Lancashire ancestor. The same would be true for the Hartley tester with the West Yorkshire ancestor William Hartley. However, his mutations would be spread out up to a common West Yorkshire ancestor under the above scenario.
  • Based on the above point, the Quaker Anc. and Wm. Anc. boxes in the Tree above are not really needed.
  • An early split between these two branches could explain the parallel mutations. For example, Sanchez and W Yorkshire William both have double mutations at location 398b. However, they are shown in different branches and not grouped together. Under my scenario, these two double mutation would have happened independently over a long period of time.
  • Unique mutations are in bold italics.
  • Adding the mutations up the tree gives the GD to the Hartley mode. The double mutations must be counted as two.
  • A rough guess for dating the tree would have the Hartley mode at 1100. The split between Lancashire and West Yorkshire at 1300. The further divisions around 1500. These dates are give or take 100 years or so. The bottom line represents tested Hartleys living today.

Here is the streamlined version of the new Hartley Z17911 Tree with some rough guesses on timeframes:

Summary and Conclusions

  • There would be other ways to draw the 67 STR Hartley Tree. This one seemed most logical to me.
  • The addition of a new Hartley 67 STR tests helped to define a Hartley ancestral mode. It appears to have defined a Lancashire and West Yorkshire branch of Hartleys
  • A pending BigY test should result in one or more Hartley Family SNPs.
  • It is possible that there are unique SNPs for the two Hartley branches shown as coming from Lancashire or West Yorkshire. However, it may take a BigY test from a Hartley from the West Yorkshire Branch to confirm this.