Cathy’s DNA From the Newfoundland Dicks Family

The DNA results for Cathy just came in. She fits in on the Dicks/Burton Line here:

cathydicksburtonline

Cathy’s closest relative in the Dicks DNA Project is Denise (2nd cousin once removed). Here is how she matches everyone in the Project:

cathytoall

The first thing I noticed is that Cathy doesn’t match anyone in the Henry Dicks Line. They are in the rectangle to the lower right of the comparison. The Henry Dicks is believed to be a brother to Christopher Dicks b. 1784. As expected, Cathy’s largest match is with Denise.

Cathy and Esther at AncestryDNA

Cathy got my attention as she is mentioned in 2 New Ancestor Discoveries (NADs) at AncestryDNA. Esther is my wife’s 1/2 great Aunt. Esther and Cathy share many surnames including Dicks, Burton, Kirby and possibly Butler. When Ancestry sees that many people match by DNA and match by genealogy they give what is called a NAD. Actually, the others match each other by DNA, but they are not in Esther’s genealogy. That is why the note for Esther’s NADs says these are potential ancestors or relatives not already in Esther’s family tree:

esthernads

Here are the areas where Cathy and Esther match:

cathyesthermatch

The names above would be on Esther’s maternal side where she doesn’t match Joan. I checked gedmatch and Esther does not match Cathy and Joan in these three above segments. That means that it possible that these segments could represent the Kirby or Butler names as suggested by AncestryDNA.

Cathy and Triangulation

Now I will see who Cathy triangulated with in the Dicks Project. Triangulation is a more rigorous method than AncestryDNA uses. Triangulation means that 3 people match each other on the same Chromosome and the same segment of that chromosome. When this happens, those three (or more) have a common ancestor. This is helpful in verifying genealogy and finding new ancestors.

Cathy’s Triangulation Group (TG) at chromosome 2

There is already a Dicks TG at Chromosome 2 with Denise, Sandra, Joan and Nelson. Now Cathy has joined it.

cathytg2

All the people in the column to the right above should be in this TG.

cathytg2chart

I mention Molly and Kirsten as it is interesting that they are not in the TG. They are shown in purple circles.  It looks like they could have at least matched Cathy and Denise but did not. That means that they their match at this spot represents a different common ancestor than the others in the TG. One possibility is that The TG represents Christopher Dicks in the top circle and the match Molly and Kirsten have represents the wife (or it could be the other way around). Another possibility is that Molly and Kirsten have a separate common ancestor from the Dicks.

Cathy in a new TG (chromosome 5)

Sort of. This should have been a TG before.

cathytg5

Here we have a TG with Cathy, Nelson, Judy, and Wallace. The reason I didn’t have this TG before is because I found no match between Judy and Nelson. Now with Cathy in the mix, I see that Judy and Nelson should be in the TG. So I looked for a smaller match (between 5 and 7 cM) between Judy and Nelson and see that there was one right where we needed it for the TG.

tg5cathychart

It seems we know quite a bit about the DNA of Christopher Dicks and his wife Margaret. Here is the updated Dicks TG Matrix. This represents 20 DNA tested Dicks descendants and 33 TGs.

dickstgmatrixrev

Two New Christopher Dicks Descendants DNA Results

I recently came across two new Dicks descendants’ DNA results. One is for Cheryl and the other is Charles. They are both from the Christopher Dicks Line of Newfoundland, born 1784. The group is getting big, so here is part of the Christopher Line:

cherylcharles

Cheryl is important for the Adams line as now there are three there. Charles is important for the Burton Line as he also makes the third in that line. Plus he is the closest to the common ancestors of the line of Frances Dicks and Charles Burton.

Cheryl and Charles’ Newfoundland DNA

When I compare Cheryl to Nelson at gedmatch, it says that their common ancestor is 3.5 generations away. That is exactly what we should expect for these two as they are 2nd cousins, once removed. Here are Cheryl and Charles compared to the other 19 Dicks descendants’ DNA:

automatrixcherylcharles

I found it interesting that Cheryl and Esther were more closely related by DNA than Cheryl and Nelson. Remember Cheryl and Nelson were 2nd cousins once removed. However, Cheryl and Esther are 3rd cousins once removed. My guess is that Esther and Cheryl have some additional common ancestors.

The Dicks DNA Details: Triangulation Groups

Triangulation Groups (or TGs) are when 3 or more people have DNA that matches each other on the same chromosome and the same segment of that chromosome. When that happens, those 3 share a common ancestor. However, it may be difficult to determine who that common ancestor is. In a family project such as this, it is most likely that that common ancestor would be a Dicks ancestor or a spouse of a Dicks ancestor.

What I do is compare the detailed results of each of the 21 Dicks descendants in the project to look for TGs. Then it should be possible to draw some conclusions from those results.

Chromosome 1: One TG Or Two?

Here we have our 2 new Project people: Cheryl and Charles:

tg1cherylcharles

This is a new TG and it gets a little complicated right from the start. This is a four person TG, so there are different overlaps. If we look at this as 2 TGs, the first would go from 70M to 83M and the second TG would go from 83M to 106M. Here is how it looks from Cheryl’s point of view:

cherylchr1

#1 is Cheryl’s match to Esther. #2 is Joan showing where she comes into the TG later (in green). #3 is Charles. #4 is Wallace, #5 is Claude and #8 is Nelson – all outside the TG(s). I am tempted to call this one TG. One reason is that Joan and Charles match from 70M to 84M, going a little over the first 83M boundary of the TG. Also the same people are in both sections. It may be that Cheryl just had a poor DNA read in the section between her green and yellow sections of her matches.

Another possibility could be that this could represent 2 Dicks Lines. Recall we have a Henry Dicks Line and a Christopher Dicks line.

Here is what the new TG1 looks like on the Dicks Genealogy Chart:

tg1

Observe:

  • Sandra and Nelson match in this area, so their match is likely on the Mercer or Adams Line.
  • This is a non-Molly TG. She is in two other Dicks Lines. She matches Wallace in the area of this TG, so perhaps that match is on the Joyce Line.
  • Claude is thought to be in the Henry Dicks Line, but we are not sure.

TG9A Revised

I had already found a TG at Chromosome 9. Now Cheryl is added to that.

tg9a

This will look a lot like TG1 except that Kirsten is replacing Charles:

tg9achart

TG10 – Adams Or Dicks DNA?

tg10

Here is my guess for TG10, although technically, this TG could be pointing to either Elizabeth Dicks or Thomas Adams DNA:

tg10chart

TG13 – A Two Way Split

tg13ab

I split this existing TG13 into TG13A with Cheryl and TG13B with Judy. Kenneth and Gordon from the Henry Line are in both TGs.

tg13abchart

Here I have Gordon and Kenneth in red. Cheryl is in TG13A and Judy in yellow (TG13B). Again, this chart is focused on the Dicks family. There is a possibility that there could be another family in common between these lines that I don’t know about.

Chromosome 15 – A Lot Going On

chr15r

Here I see 2 TGs and some people that are not in the 2 TGs. First is Charles, Joan and Esther in gold. Then there is Nelson, Gordon, Charles, Kenneth and Judy in the pink TG. Howie, Molly and Pauline would be in a TG, but siblings are generally not considered as part of a TG trio. That is because they had to get all of their DNA from their parents, so it would be like 2 people if you consider Molly and Howie as their parent and Pauline as the other person.

Here are a few comments:

  • Pauline, Molly and Howie are likely matching DNA on their Joyce side
  • If the match with Gordon and Kenneth is a Dicks match, why don’t Charles, Esther and Joan also match them? Does that mean that the Charles, Esther, Joan TG is a non-Dicks TG?
  • I previously had TG15 split in two. It appears I can get it down to one TG with a common location between 51 and 62M on the Chromosome.
  • I had noted before that Gordon seems more closely related to the Christopher Dicks line than the Henry Dicks Line. He is also in TGs with the Christopher Dicks Line. Both his line and Esther and Joan’s line have a Christopher b. 1812 or 1813. Both Christopher ancestors are married to an Elizabeth. Gordon’s line identifies her as a Collier. Could it be that the lines are the same? Something to think about.

tgs15

Note that Charles is in two different TGs. The blue circles represent the non-TG with Molly, Howie and Pauline who have a Joyce ancestor.

New TG17

newtg17

The common area in this TG is between 30M and 37M. As this is likely a Dicks TG. Esther and Joan’s match likely represent the non-Dicks Upshall ancestry. This is important to know when checking matches in this area of the Chromosome.

Chromosome 18 – Two New Cheryl TGs

tgs18

Here is what Cheryl’s browser looks like:

cherylchr18

  • #1 Molly
  • #2 and #3: Sandra and Nelson (probably an Adams TG)
  • #5 and #6: Judy and Wallace

New Chromosome 20 TG

newtg20

Again, I am thinking that Charles may be related on the Upshall Line of Esther. Another possibility is the Burton line. Esther and Charles both have Burtons in their ancestry.

Updated Dicks Triangulation Matrix

I have made quite a few changes to the Dicks Triangulation Matrix:

dickstgmatrixnew

  • Gordon is in 5 TGs with the Christopher Dicks Line and in none with the Henry Dicks Line
  • Cheryl is in 7 TGs including 2 that appear to be non-Dicks TGs
  • Project members are in an average of 6 TGs each

Summary and Conclusions

  • Cheryl and Charles have added important DNA results to the Dicks family puzzle.
  • It looks from the DNA, common ancestral names and birth dates that Gordon could be more likely in the Christopher Line rather than the Henry Dicks Line. Someone who knows the genealogy better may be able to confirm this theory or refute it.
  • On the other hand, Charles is in TGs 4 out of 5 times with Kenneth. Is that significant?
  • It appears that Charles could have more of a connection to Esther and Joan than just the Dicks family. Both Esther and Charles have Burton ancestors. A connection with Esther and Joan’s Upshall line is an additional possibility.
  • It is possible to draw conclusions for matches that are in areas of a TG but are not in the TG. That means that those matches outside the TGs do not have the same common ancestors as those within the TG.

More Dicks DNA – Marilyn’s Brother

I just finished 2 Blogs on the Henry Dicks Line which is a parallel line to my wife’s Christopher Dicks Line. Then I heard that Marilyn had her brother tested. Marilyn is on 2 different Christopher Dicks Lines.

Henry Dicks Line Updates

In other news, I found out that Eric’s dad, Claude, has been tested for DNA. What is more it is Claude that Eric believes to be likely related on the Henry Dicks Line. The confusing part was that Eric was in a Triangulation Group with my mother in law Joan and Joan’s half Aunt Eshter. So isn’t that confusing. That means that for now (as I understand it) Eric’s TG with my wife’s side of the family may not refer back to a Dicks ancestor. I’ll take Eric off the TG Matrix for now and put his father into the Dicks family comparisons. The good news is that there are a lot of Dicks descendants around. The bad news is that is is difficult to keep track of all of them.

I also got this note recently from Crystal from the Henry Dicks Line:

In looking at Ivy’s ancestors, We also share another ancestor. We are both related to The Vatchers as well as the Matthews and the Dicks. Burgeo is so small that you bound to be related in 2 or 3 different ways going way back!

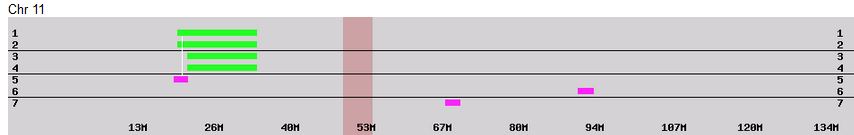
In addition, Crystal tells me she has extra Dicks DNA on her dad’s side as shown here on this Henry Dicks Chart. Her mom’s side of the Dicks line leads up to the first pink rectangle. I have Crystal in a slightly different green to make sure I don’t forget she is in two Dicks Lines.

henrychartnew

Back to the Christopher Dicks Line and Marilyn’s Brother

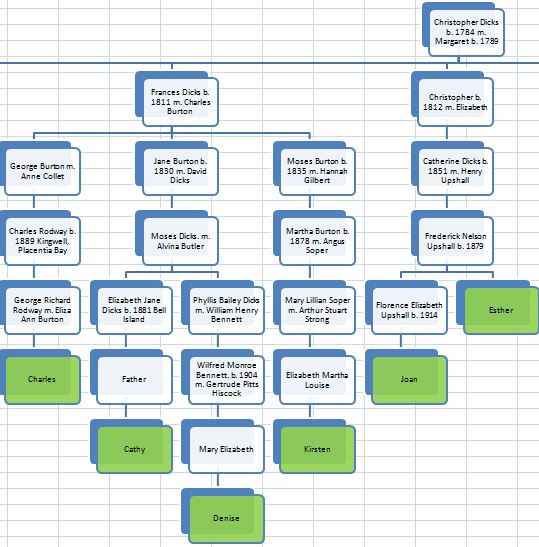
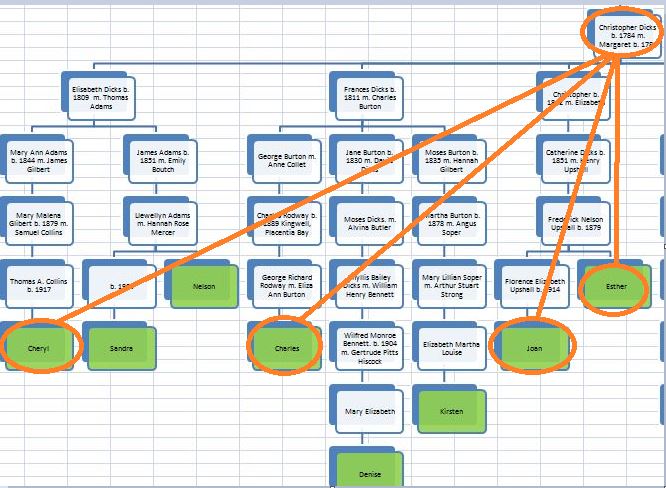
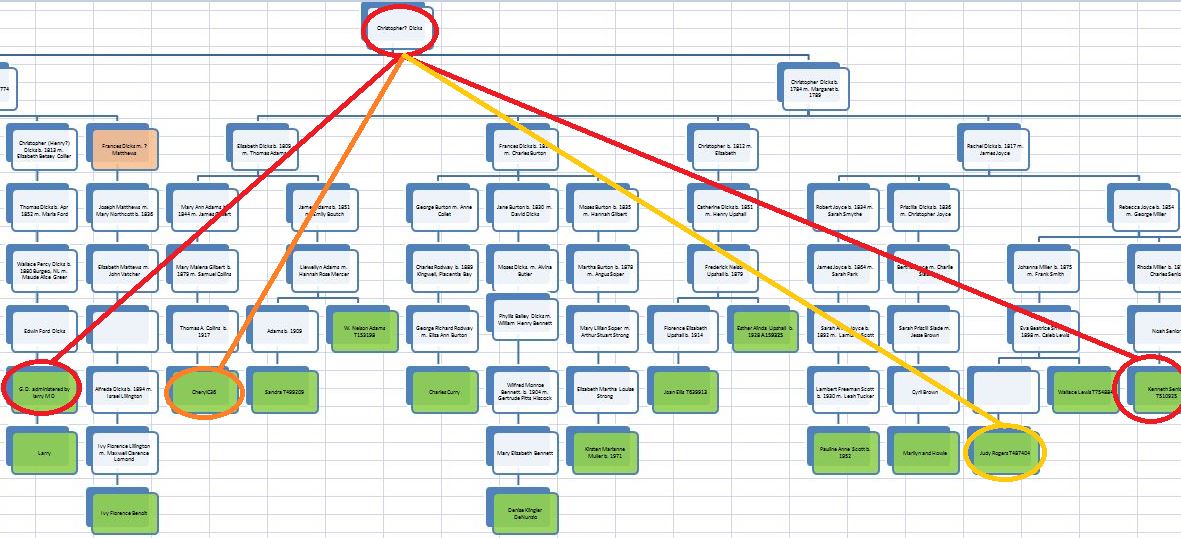
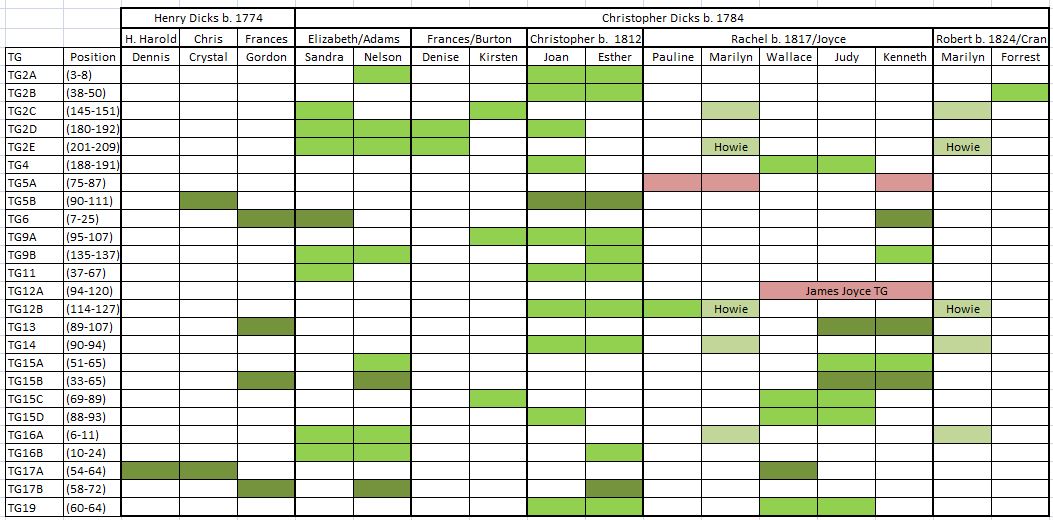
Here is an updated Christopher Line Chart. All I did was add Marilyn’s brother Howie to an old chart I had:

marilynsbrotherchart

The chart is getting tiny. So I will point out that Marilyn and her brother are on the Joyce and Cran Lines. The Joyce Line is the large Line to the right of center and the Cran Line is on the right. That reminds me of something I brought up in an email. My wife’s 1/2 great Aunt Esther has 2 Dicks Lines also. One is through Christopher. The other one she doesn’t share with Joan due to the 1/2 part. However, I noted that Esther is in 3 TGs that she does not share with Joan. In those 3, she shares all 3 of them with people from the Adams Line. The Adams line is the one on the left.

esthernonjoantgs

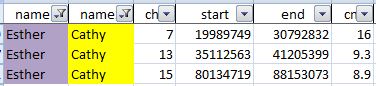
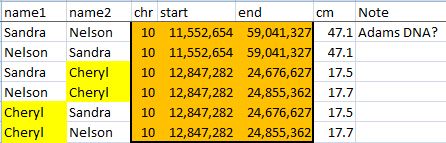
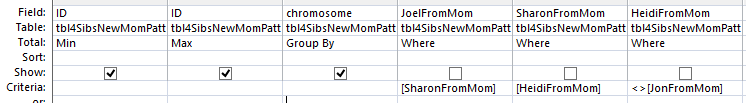
These are the non-Joan, Esther TGs. They all have Nelson in them and two of them have Sandra. I just need to check to see if Esther’s other Dicks ancestor might fit in. “Hi Sandra, any room for Esther’s ancestor?”

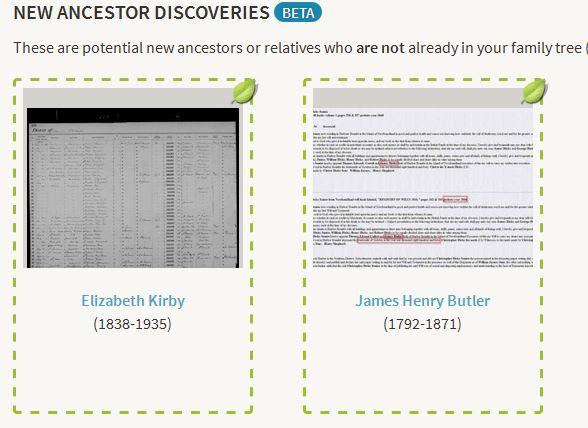
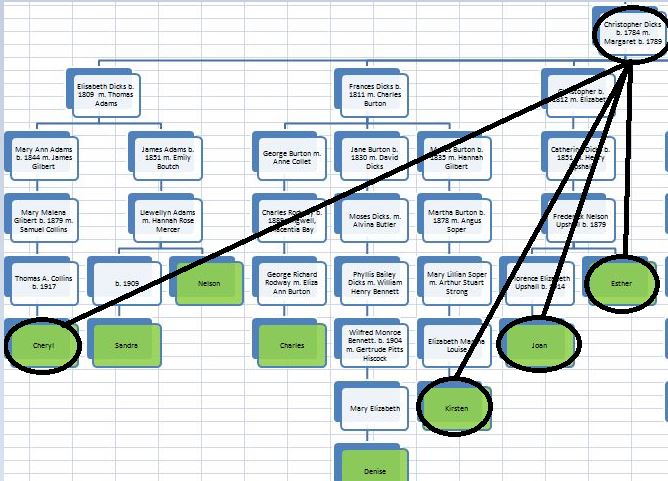
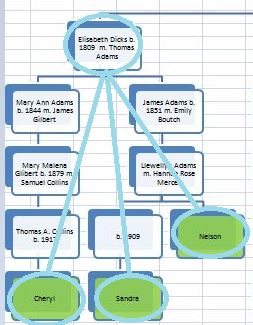
However, when I look at Esther’s tree, this is what I see:

estherstree

Assuming that this tree is right, there is no room for Jane Ann Dicks in Sandra’s tree. That is because Jane Ann was b. 1841 and Sandra descends from Elizabeth Dicks b. 1809 who married Thomas Adams. Sandra would have descended from a male Dicks. I will leave this as a mystery for now. Perhaps the 3 TGs above between Esther and Nelson are non-Dicks TGs.

Marilyn’s Brother and Claude

Now I will compare all those who have Dicks ancestors. I will look especially at Marilyn’s brother and Claude (Eric’s) dad who may have Dicks ancestors. This resulted in 754 lines of matches. However, each match is listed twice, so there are only 377 matches. A lot of these matches are between close relatives. There would be a lot more matches if I had included Eric and Larry in the mix.

Chromosome 2

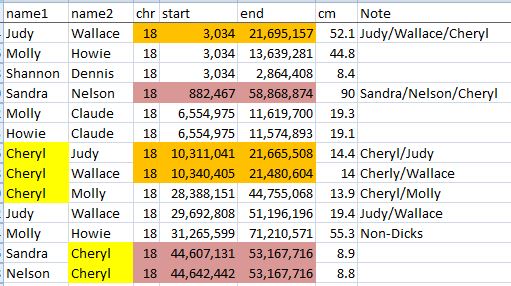
Here we have a complicated stretch of DNA:

tg2dicks

This may take a bit of explaining. Previously, I had this as two TGs:

  • TG2D (180-192) with Sandra, Nelson, Denise and Joan
  • TG2E (201-209) with Sandra, Nelson and Marilyn

I see now that Denise should have been in the TG2E. Now we can add Howie to TG2E also. There is another way to look at this TG. That would be that it is a larger TG and that Joan’s DNA didn’t extend to the higher end of it and Marilyn and Howie’s DNA didn’t extend to the first part of it. A few other things:

  • Kenneth and Judy are not in this TG. As they both descend from a Miller line, that would be a likely source of their DNA match.
  • Kirsten also does not appear to be in the TG. I’m not sure how to explain the matches between Kirsten and Marilyn and Kirsten and Howie. The simplest explanation would be that Marilyn and Howie are in the TG through their father’s side and match Kirsten on their mother’s side. However, I don’t know enough about everyone’s genealogy to know if that is feasible.

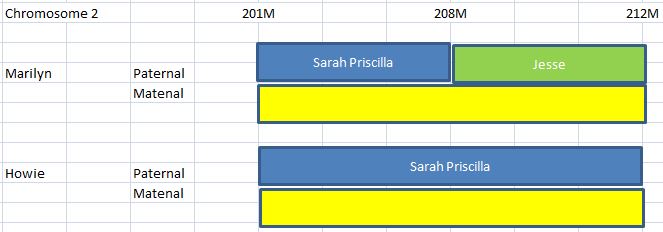
Here is the larger TG drawn out:

tg2chart

This was a little tricky to draw. What this is supposed to represent is that Sandra, Nelson and Denise are in the larger TG. Joan (in yellow) is in the first part of it and Marilyn and Howie are in the second part or it. I guessed that Marilyn and Howie might be in the box on the right as none of the other four Joyce line descendants are in this TG.

crossovers

I can give a likely reason Joan dropped out of this TG and Marilyn and Howie dropped in. It has to do with crossovers. Let’s look at Joan first. Joan has 2 copies of her Chromosome 2 as we all do. One is maternal and one is paternal. Joan’s Dicks DNA comes from her maternal side. Joan’s maternal DNA is made up of her mother’s two parents DNA joined together (recombined). Those 2 parents were Joan’s grandfather Frederick Upshall and grandmother Daly. Joan’s maternal Chromosome 2 is alternating between Upshall (whose mother was a Dicks) and Daly.

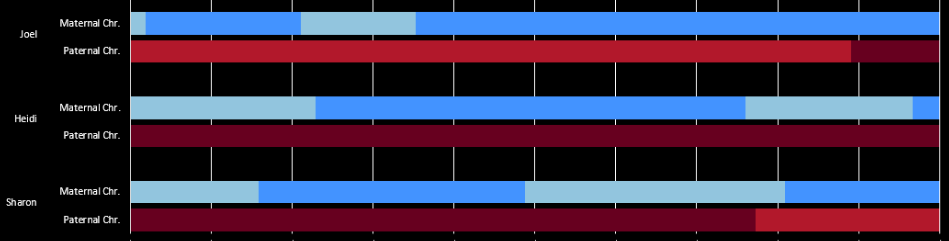
Here is a map of my actual Chromosome 2 showing the alternating pattern:

joelchr2

This chart was created by M MacNeill [prairielad_genealogy@hotmail.com]. It is possible to map this out if you have 2 parents tested, or if you have one tested and 2 or 3 siblings tested. There is even a way to map your grandparents with siblings and no parent tested. In the case above. Light blue represents my maternal grandmother and dark blue is my maternal grandfather. The light red is my paternal grandmother and the dark red is my paternal grandfather. Everyone’s DNA follows the same type of pattern. The actual configurations where the changes are will be different. The place where a color goes from one to another is called a crossover. Sometimes there is no crossover or recombination and you will have all your DNA on a particular copy (maternal or paternal) of a chromosome from one grandparent instead of two.

Back to the TG at Chromosome 2:

chr2joan

Notice what Joan’s matches with Sandra, Denise and Nelson have in common: they all end around 192M. That should be the place where Joan’s DNA switches from her grandpa Upshall to grandma Daly.

Here is Joan’s Chromosome 2:

joanchr2

This shows her matches with:

  1. Esther
  2. Nelson
  3. Sandra
  4. Denise

To the right of the one blue bar on top of the 2 green bars is where Joan drops out of this Dicks TG. I can almost map Joan’s Maternal grandparents from this gedmatch chromosome broswer. Here is my guess:

joanchr2map

A few notes:

  • Joan’s Daly grandmother is not from Newfoundland
  • Another possibility could be that the Upshall segment could extend to Joan’s matches with #2, 3, and 4, eliminating the first Daly segment I have.

Another interesting question is: Why doesn’t Esther match Joan where Joan matches Nelson, Sandra, and Denise? The answer would be that Esther has Upshall DNA in this area rather than Dicks and Joan got Dicks DNA in this area. It’s a bit confusing as you have to picture what is happening on each side of the match between Esther and Joan.

Marilyn and Howie’s appearance in TG2

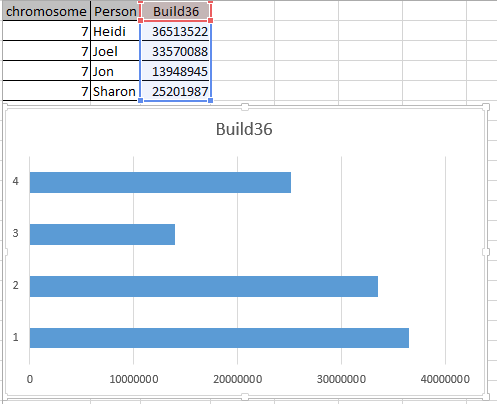
I’d like to bring up an interesting point about siblings. Siblings represent the only relationship where you will find appreciable FIRs. FIRs are Fully Identical regions. Here is Marilyn’s match with her brother Howie on Chromosome 2:

marilynhowiechr2

This shows that Marilyn and Howie match each other along the blue line. That is from 0 to 147M. Then they don’t match from 147M to 182M. Then they match again to the end of the Chromosome 2. Above the blue bar are green and yellow areas. The yellow is how we match everyone other than siblings. The green is the FIR. That means a double match. As siblings, Marilyn and Howie share all their 4 grandparents: 2 Paternal and 2 Maternal grandparents. Looking at Marilyn and Howie’s Chromosome 2, I can know what the green, yellow and red regions mean:

  • Green – Marilyn and Howie both share a maternal grandparent and a paternal one. We just can’t tell which one right now.
  • Yellow – Marilyn and Howie both share a maternal grandparent or a paternal grandparent. Again we can’t tell which one right now.
  • Red – Marilyn and Howie share the DNA of neither their maternal nor paternal grandparent.

Here is the 2nd part of the TG at Chromosome 2:

tg2marilynhowie

The appearance of Marilyn and Howie in this TG is clear: 201M. I just found out recently that there is a way to expand matches to great detail as shown in the Gedmatch Chromosome Broswer. Here is Marilyn and Howie expanded at around 201M:

marilynhowiechr2-201

This is difficult to see. The number in the middle is 200M. That is one tick mark away from 201 where Marilyn and Howie enter the TG. Another interesting thing is that Marilyn (Molly) above gets out of the TG at 208 and Howie gets out between 212 and 218.  What does all this mean?

  • Based on the expanded view, Marilyn and Howie are FIR from a little after 195M. They jump into the TG at 201. FIR means that Marilyn and Howie share the same 2 grandparents – one maternal and one paternal. However, without the comparison of another sibling, this is difficult to see. I am assuming that from 195 to 201M, Marilyn and Howie share the same 2 grandparents, but not necessarily the same two as after 201M. At 201M, Marilyn and Howie both get their DNA from their paternal grandmother Sarah Priscilla. Sarah is the one with Dicks DNA.
  • At 208M, Marilyn drops out of the TG before Howie.

Here is an expanded view of an already expanded view of Marilyn and Howie at 208M:

chr2-210

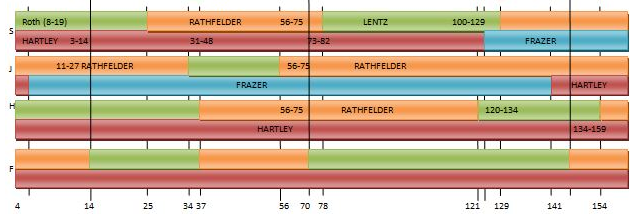
Every little tick mark [^] is 1M. So 2 ^’s before 210M is 208M. That is where Marilyn and Howie go from FIR to HIR. An HIR is a Half Identical Region. That means that Marilyn and Howie match one grandparent (on the maternal or paternal side) and they don’t match the other grandparent (on the opposite of the maternal or paternal side where they do match). This is easier to show by mapping it out:

chr2map

It is clear that from 201 to 208, that Marilyn and Howie are in a TG. They are also FIR. That means that they have 2 grandparents the same (one paternal and one maternal, here represented by blue and yellow). The TG identifies the paternal grandparent as Sarah. She is the one that descends from the Dicks family. We don’t know which Maternal grandparent that Marilyn and Howie got their DNA from. We just know that it is the same grandparent.

At 208M, two things happen. Marilyn exits the TG and is now in an HIR with her brother Howie. HIR means that Marilyn gets her DNA from one grandparent (on the maternal or paternal side). On the other side from where she gets her DNA, she doesn’t get her DNA from the other. In this case, that means that she continues to match the same maternal grandparent and switches the paternal grandparent that she gets her DNA from from Sarah to Jesse.

All this is to say that it is helpful to have a sibling or more tested.

Chromosome 12

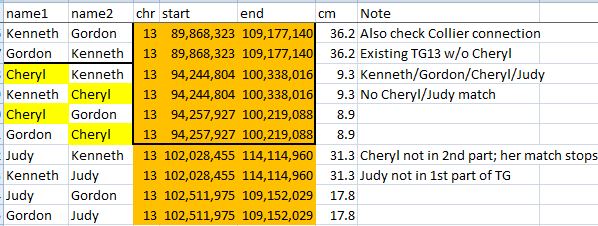
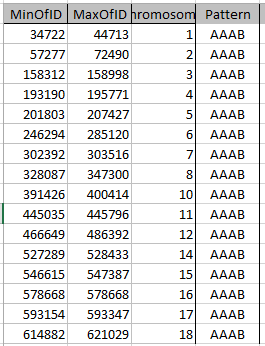
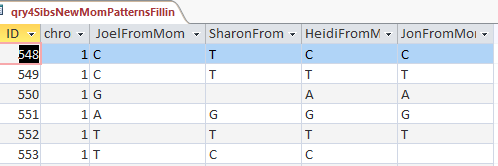
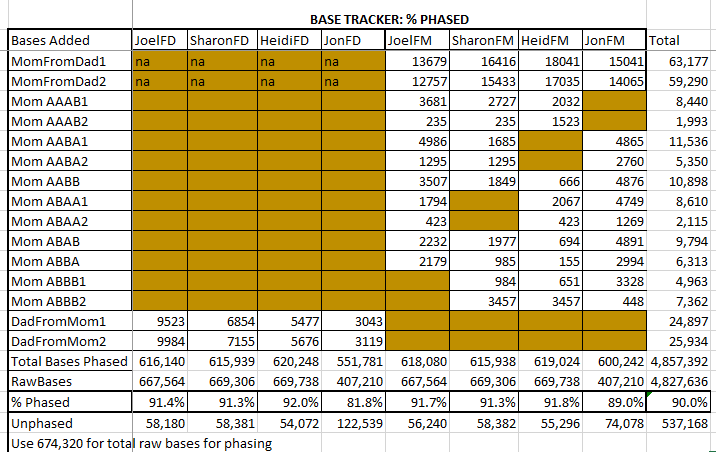
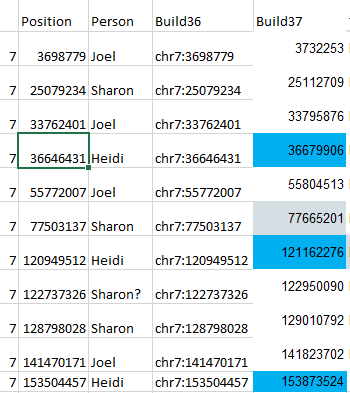
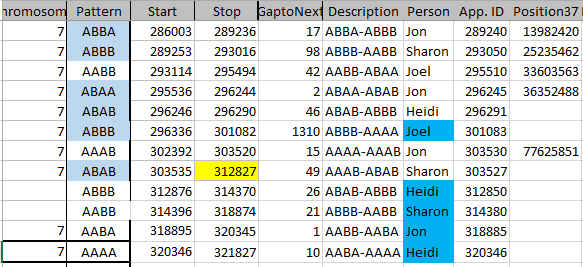
Like the TG at Chromosome 2, the TG that Howie is in at Chromosome 12 is not new. It has been described previously. Here is what it looks like in a spreadsheet:

tg12howie

The difference is that there is a Joyce Line TG within an apparent Dicks TG (in gold). Also within the gold TG there are single matches of people from the Henry Dicks Line. That could mean a few things:

  • The green matches are in non-Dicks lines
  • The green matches are with Dicks lines. If that is true, that would mean that the gold TG must point back to the wife of Christopher Dicks who I have as Margaret b. 1789.

In TG2, I had missed Denise in part of the TG. Previously I had missed Pauline in this one. Part of the reason I may have missed Denise in TG2 is that her match with Marilyn was less than 7 cM so didn’t show up at Gedmatch at threshold levels. In this case Marilyn doesn’t match Pauline, because she drops out of the TG right around the spot where Pauline joins in the TG (127M).

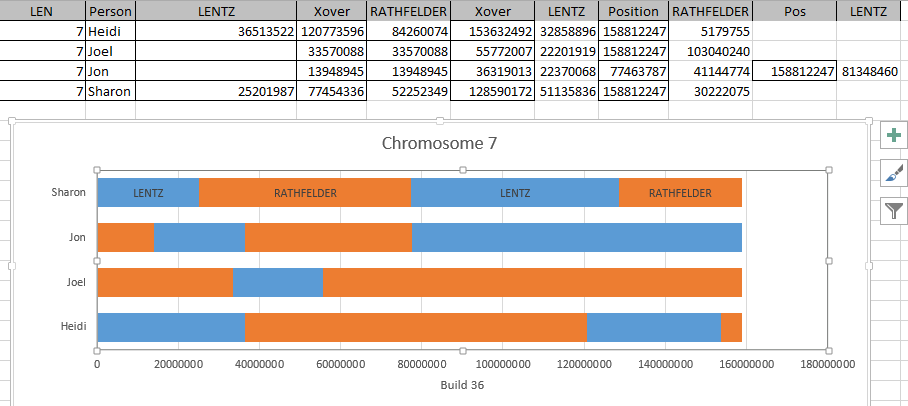
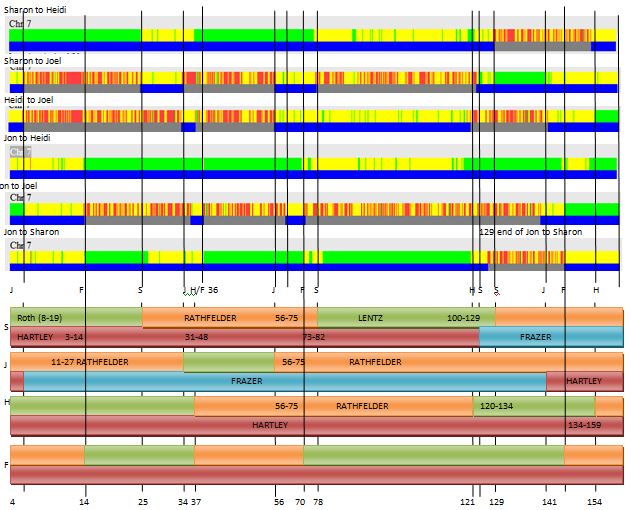
Here is Joan compared with Esther, Howie, Marilyn and Pauline:

joanchr12

In the above browser image, Joan’s maternal grandparent mapping would likely go Upshall, Daly, Upshall. One can see where Howie and Marilyn jump into the TG in the 2 yellow bars. You can also see how Marilyn (#3) jumps out of the TG on the right and Pauline (#4) jumps in (green bar).

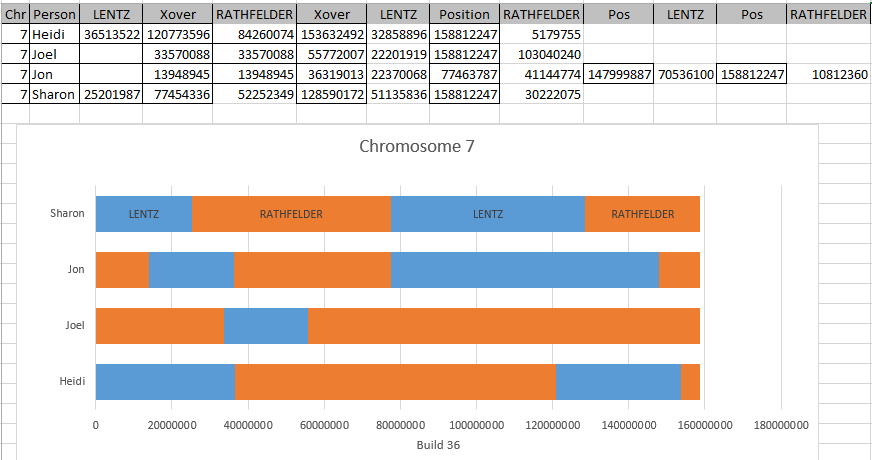
For comparison, I will show the same matches from Esther’s point of view:

estherchr12

Esther’s view has to be exactly the same for #1 as they are comparing the same 2 people (Joan and Esther). Esther’s view gives a crisper indication of Marilyn’s crossover.

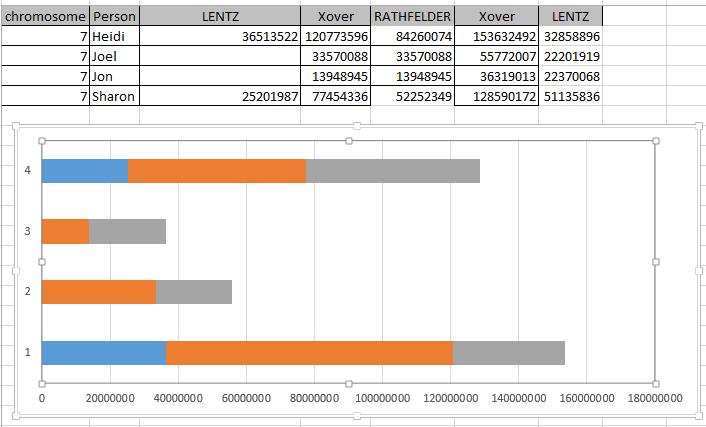
Chromosome 12 is shorter than Chromosome 2, so it should be simpler. Here are Marilyn and Howie compared at Chromosome 12:

mhchr12

Marilyn and Howie have 3 HIR’s, one FIR and one area where they don’t match either of their grandparents. In that area where they don’t match, if Marilyn got her DNA from her her maternal grandmother and paternal grandfather, for example, it would mean that Howie would have to get his DNA from his maternal grandfather and paternal grandmother.

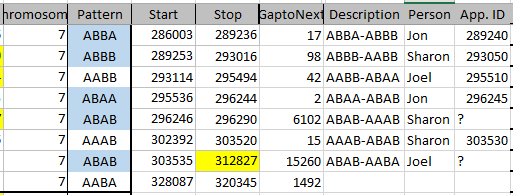
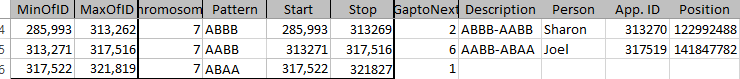
We have more detail on the positions from the TG:

tgpauline

Howie and Molly jump into the TG at 114M. Molly jumps out at 126M and Howie jumps out at 132M. Actually, he had to as that is the end of the Chromosome!

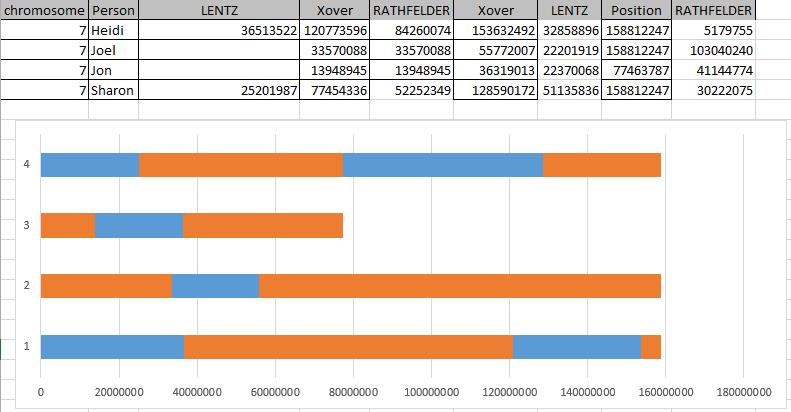
Looking at Marilyn and Howie’s expanded view of Chromosome 12, their FIR starts at 101M. That switches to an HIR at about 126.5M. That corresponds where Marilyn gets out of the TG. It also corresponds where the green goes to yellow in the Gedmatch Chromosome browser in the image above.

mh12map

This looks similar to the Chromosome 2 map of Marilyn and Howie. This time I was a bit more brave due to my experience with Chromosome 2 and mapped their DNA to the beginning of their HIR rather than just to the beginning of where they jumped into the TG (113M). The reason for this is for there to be a change at 113M would require a double crossover for these two which is unlikely. Another note is that the yellow grandparent in this example may not be the same as the yellow one in Chromosome 2. It is just meant to represent one of the maternal grandparents in each case.

One More Question On Crossovers

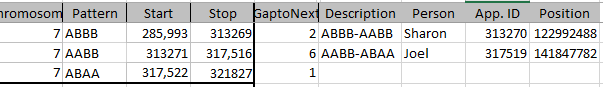
I’m learning this as I go along. I had determined a crossover above at 126.5M above where one sibling left the TG and the other stayed in. However, I did not have a crossover at 114M where both siblings entered the TG. Why is that? I had a crossover at 126.5 because the chromosome browser verified that the siblings were switching from a FIR to an HIR at 126.5. To me, this verified the crossover in conjunction with the change in TG at the same location. At 114M, there was no change:

chr12pos114m

Above is the close-up view of Marilyn’s match to Howie on Chromosome 12 between positions 110 and 120M. The whole area on either side of 114M is FIR. That likely indicates no crossover at Marilyn’s and Howie’s grandparent level. However, it was Marilyn’s great grandmother Bertha Joyce that had her grandparents’ Dicks and Joyce DNA recombining into a crossover. It is likely that this TG represents the DNA that Bertha Joyce received from her grandparents probably sometime around the American Civil War. I note that the TG that I looked at above at Chromosome 2 followed the same pattern. The crossover was where one sibling left the TG and the other remained. Where the two siblings started in the TG, there was no change in the FIR region to an HIR.

So the answer is that there was a crossover at some point at position 114M, but quite a while before the time period that we are looking at here. So it is hidden in my map above.

Dicks TG Matrix Update

dicksmatrixupdate

  • Here I took out Eric as his father Claude (who is believed to be the one descended from the Dicks family) was not found to be in a TG. Eric was in a TG with Joan and Esther, but that must have been on his maternal (non-Dicks) side.
  • I didn’t add 2 extra columns for Howie, but put him in the appropriate boxes where the existing TGs for his sister Marilyn were.
  • I added Denise to TG2E and Pauline to TG12B. That was an important addition for Marilyn and Howie as it seem to indicate that their Dicks DNA comes from the Joyce rather than the Cran Line in this case. Recall that in TG2E, I was suggesting that this might represent the Cran line for Marilyn and Howie.

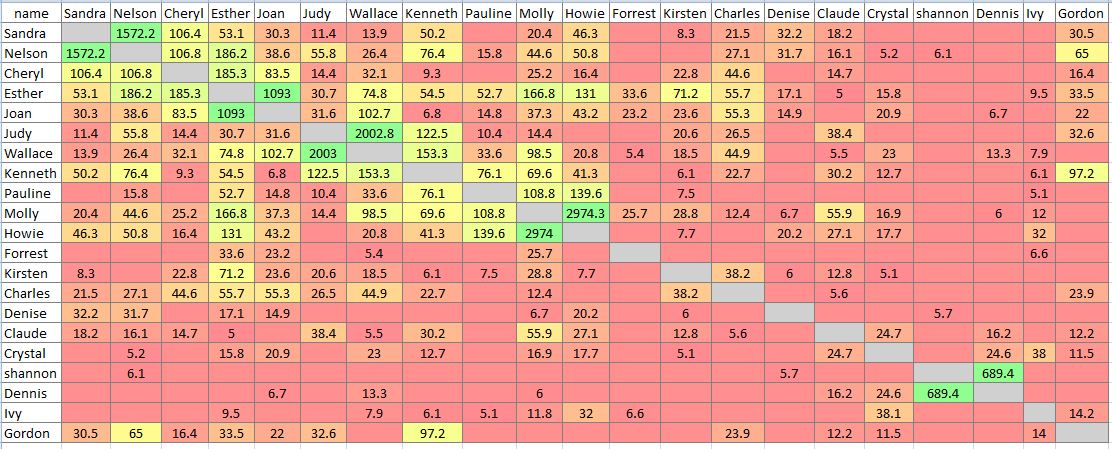
The All-Dicks Comparison

autosomalmatrix

The top left box are the Christopher Line descendants. The bottom right box is the Henry Dicks Line descendants. This now includes Claude and Howie. For an interesting comparison, run down the two columns of Molly and Howie and see how the total cMs of their matches differ.

Summary and Conclusions

  • I didn’t add any new TGs by the addition of Marilyn’s brother Howie and Eric’s father Claude.
  • Marilyn and Howie are the first known Dicks descendant siblings to have their DNA tested. So I took advantage of that to explain how crossovers work and how they are important in mapping DNA.
  • The combination of the sibling comparisons and TGs made it possible to partially map two of Marilyn’s and Howie’s paternal grandparents on portions of Chromosomes 2 and 12.
  • I also showed a likely scenario for Joan’s crossover point within a TG which would lead to mapping segments that she received from her maternal grandparents
  • I clarified a few issues and refined the Dicks Triangulation Group Matrix


A Bad AncestryDNA Hint Analyzed

In a previous Blog, I looked at what I called a false AncestryDNA hint. What I meant by that was that the DNA match itself was false. Because I did not match the other person’s mother’s or father’s DNA results, I could not match the person. There was much discussion on Facebook as to whether the AncestryDNA Shared Ancestor Hint (SAH) was good, bad, false, unconfirmed, etc. However, whatever the hint should have been called, there was no sense in following up on a DNA match that was false.

In this Blog I want to look at a SAH that is not false, but only bad. I don’t have a generic definition for what a bad SAH is, but in this case it is an AncestryDNA member match that lead to an ancestry tree hint on my father’s father’s side. In this blog, I will show that the actual DNA match as shown at Gedmatch was on my father’s mother’s side.

What AncestryDNA Shows

Here is the shared DNA of my member match Carol:

shareddna

Ancestry has their little DNA symbol and even gives the amount of DNA we share across 1 segment. This DNA matching information is on the very same page with this heading:

dnamatch

Somehow this leads me to believe that the DNA match is leading me to an Ancestry Tree hint right below my DNA member match information:

davissah

Incredible. AncestryDNA has found a hint of two shared 7th great grandparents nine generations away from my match and me. Except that it is incredibly wrong based on the DNA match. How do I know?

My Ancestry Match at Gedmatch

Fortunately, my match, Carol,  was wise enough to upload her results to gedmatch. Here is our match at gedmatch:

joelcarol

This looks like a decent match. Now I know where we match. I can check on my Visual Phasing map of Chromosome 11. Thanks to Kathy Johnston for the method.

visphase11

The middle bar is me (J). The paternal half is shown as blue and purple. Oh no, it shows that the area that I match Carol (24-36M) is a Frazer segment for me. This is my father’s mother’s side, not my father’s father’s side that had ancestors going back to colonial Massachusetts (John Davis and Hannah Lombard). All my Frazer ancestors were in Ireland before the 1880’s or so. I must have made a mistake. I’m just sitting here at a 10 year old computer that is about to die and Ancestry with it’s billions of dollars of resources is giving me a hint that they think is right. Ancestry really makes me doubt my work. So I check other Hartley reference matches. I add my brother to the visual phasing. No, it looks like I had it right after all. This is definitely an Irish Frazer match.

Shared Matches?

Perhaps if AncestryDNA had given me some shared matches, it would have tipped me off that this is the wrong DNA. However, at this level of match, apparently they don’t do this.

noshared

But that’s OK. I have Gedmatch which will give me shared matches. Gedmatch will even show how the shared matches match Carol on Chromsome 11 on a Chromosome Browser:

chr11shared

#1 and #2 are matches to Carol that I don’t know. #3 is me and #4 is my sister Sharon. It even looks like these matches to Carol could triangulate. However, Ancestry has told us that triangulation has about a one percent chance or less of happening at this level of relationship. That is why they use circles. Should I go against the advice of the mighty Ancestry? Below is Ancesty’s probability that 3 people will match at the same segment (triangulation).

ancestrydna-insights

I’ve gone this far, so let’s see what happens. Perhaps I will have beat the Ancestry odds of my finding a Triangulation Group (TG). At Gedmatch, I used the Multiple Kit Analysis for Carol and her first 3 matches as shown above and downloaded the segments for Chromosome 11:

tg11carol

I didn’t bother adding my sister Sharon to the mix. It looks like Cheri and Hazel are closely related, but that’s OK. I see that:

  • Hazel matchs Cheri
  • Carol matches Cheri
  • Carol matches Hazel
  • Carol matches Joel
  • Joel matches Cheri
  • Joel matches Hazel

That meets the definition of a Triangulation Group.

So far with Carol I have:

  • Checked her against my paternally phased kit to make sure she matched me on my paternal side.
  • Checked her results against my visual phasing map and mapped her to the appropriate grandparent
  • Shown that she was in a TG

To me, this confirms that my match with Carol is a real match on my father’s mother’s Frazer side and not my Hartley side.

Can Ancestry Redeem Itself?

After giving me a ‘bad’ hint, no chromosome browser, and telling me that resistance as well as triangulating is futile, can Ancestry redeem itself? Now that I know my match with Carol is not in Colonial Massachusetts, but Ireland, I can go back and check Carol’s Map and Locations button at AncestryDNA. Hmmm…. where should I look? Perhaps Ireland?

carol-map

Oh look. Carol has ancestors in Enniskillen, not too far from my blue ancestors. In fact, some of my other DNA relatives along the Frazer line have shown Enniskillen as a home base.

Summary and Conclusion

  • Ancestry gave me a ‘bad’ hint in that the DNA they used to point me to Colonial Massachusetts should have pointed me to Ireland
  • By implying that their DNA match leads to a specific tree, they also imply where the DNA came from. In this case the implication was the DNA match inferred my Hartley ancestors. In fact, I have shown that the DNA points to my Frazer grandmother whose parents were both born in Ireland.
  • Ancestry Shared Ancestor Hints take the easy way out. They point to places with good records and trees that are relatively easily created rather than to the places with more difficult ancestry such as Ireland. That is not helpful in furthering my research.
  • The Colonial Massachusetts match between Carol and myself may be correct. However, there is no sense trying to confirm or denying our shared Colonial Massachusetts ancestry with a DNA match that leads to late 1800’s Ireland.
  • I seriously doubt Ancestry’s probability of finding triangulation at the 4th cousin level between three people as being 1% or less. The 2 surname groups that I have worked on have large matrices of TGs for each surname.
  • Ancestry Hints are not useless without Gedmatch. However, they can be misleading.
  • It looks that close to 90% of my SAH’s are in the Distant Cousin range. Be very wary of these Distant Cousin matches that have not been verified by Gedmatch.


The DNA of Henry Dicks of Newfoundland b. 1774: Part 2

In my last blog, I gave some updated information on the DNA matches of descendants of Henry Dicks of Newfoundland. As I was writing the blog, new DNA was being uploaded to gedmatch.com. Perhaps the most important results for the Henry Dicks group were tokenized between the last Blog and this one. Those were the DNA results of Gordon. Here is why his results are so important:

henrydickschart

You might say that Gordon is higher up on the ladder than the other Henry Dicks descendant DNA testers. That makes all his relationships to other Dicks ancestors closer by a generation or more.

Step 1: All Gordon’s Matches

The first thing I do when I look at new results is run a ‘one to many’ at Gedmatch. That shows all the matches Gordon has.

gordontopmatches

Out of Gordon’s top 13 matches, 6 are already in our group. Larry is his son. Kenneth, Nelson, and Judy were mentioned in the previous blog. Esther is my wife’s great aunt. Esther and Nelson are one rung up the ladder from Gordon – closer to a common ancestors.

Step 2: All Gordon’s Dicks Descendant Matches

The next utility I use at Gedmatch is called the Multiple Kit Analysis. Here I’ll look at 18 Dicks descendants at once and compare them to each other:

gordonmatixmod

The first 6 testers are from the Henry Dicks Line. The 2nd 12 are from the Christopher Dicks Line. The numbers are in cM and represent the closeness of their DNA matches. I don’t have the names going across the top, but the order is the same as going down. The first grey box in the top right is grey because it represents Gordon’s match with himself. The next box shows that Gordon and Ivy match each other at a level of 14.2 cM.

Now, how to interpret this?

  • Shannon has poor matches overall, so we will look at her Uncle Dennis’ results instead
  • Gordon and Eric seem to have larger matches with the Christopher Dicks Line as compared to the Henry Dicks line. There may be more than one explanation for this.
  • Ivy, Dennis and Crystal have higher matches with Henry Dicks descendants than they do with Christopher Dicks descendants.
  • Dennis and Crystal share a common ancestor of Henry Harold Dicks b. 1811. That explains their larger match.
  • Crystal and Ivy share Dicks and Matthews ancestors. That would explain their larger match.

Step 3: Dicks Triangulation

Triangulation Groups or TGs have been called the gold standard of genetic genealogy. In this step I download all the specific matches from the last chart. The specifics are what Chromosome the matches are on and what location on the chromosome that the matches are on. These go into a spreadsheet of 608 lines. This represents 304 shared Dicks descendants’ DNA. Not all the DNA is from Dicks. The closer the relationship that is looked at between the 2 people, the more likely the match is not representing Dicks DNA.

Chromosome 6 TG

The first TG that Gordon is in is fairly straightforward.

tg6spreadsheet

The gold area is the area of the TG. There are 3 other matches that could be in the TG but aren’t. They don’t even match with people within the TG. For that reason, my assumption is that they match on the non-Dicks side of the realtionship. For Wallace and Judy that would be their Lewis ancestors. Likewise the Mercer ancestors are likely represent on Chromsome 6 for Nelson and Sandra. For Joan and Esther, the large segment they share is likely Upshall DNA. So the TG helps not only those that are in the TG, but those that could be but aren’t.

Here is the Dicks TG on Chromosome 6 displayed on the genealogy chart:

tg6chart

So the fact that Gordon is in TGs with those in another line of the Dicks family doesn’t mean that Gordon is not in the Henry Dicks Line. It just means that there are more outside his line to match and the relationships outside the Henry line are as close as those within. For example, the relationships here are 5th cousins. The relationship Gordon has with the person to his lower right in the Henry line is 4th cousin twice removed. That is equivalent to a 5th cousin.

Chromosome 15 TG

This is the one I mentioned I would address later in my previous Blog. Now is later. This one is a little more complicated, so I took out the double match entries to simplify it:

tg15ss

This is a 4 person TG, so there are more matches. However, within the TG are 2 non-TG matches. These are likely for the Upshall and Joyce Lines. I wasn’t going to draw out the genealogy chart TGs, but doing so illustrates a few points:

tg15chart

Here the patriarch, assumed to be Christopher Dicks, is at the top of the orange TG. The first point I wanted to make is that Gordon is a 4th cousin once removed to Nelson. That is a closer relationship than he has with those currently in his own Henry Dicks Line. The second point I tried to make showing the blue TG. The blue TG is the existing TG which consists of those within the Christopher b. 1789 (son of Christopher) TG. There is even a 3rd point. Assume that Gordon does not descend from Christopher b. 1789 (and I have no evidence that he does). This diagram shows a pretty rock solid intertwined pair of TGs. The first TG identified Christopher b. 1789 and the second one identified that there is also a TG leading up to the patriarch Christopher. In other words, this is proof to me that Henry and Christopher Dicks are brothers. Finally, the above can be seen as one or two TGs. I would prefer to keep them separate as one identifies one ancestor and the other identifies older Christopher ancestor.

Chromosome 17 TG – Hold on to your seats

The ride may get a bit bumpy on this next TG. Here is Chromosome 17 from about 52M-78M:

tg17two

Here, we have the TG found in the previous Blog with Dennis, Crystal and Wallace from about 52M-64M. Then after that is a new TG with Gordon, Nelson, and Esther from about 58M-72M. So that shows 2 TGs with different people in them, but the TGs overlap a bit. Then after that are two matches. One is between Forrest and Esther that would have to be outside the TG. The other is between Nelson and Sandra that would also be outside the TG.

These two TGs have has me a bit stumped. I have a few theories:

  1. This could be due to endogamy. Esther has Dicks on her father’s and mother’s side
  2. Could it be that one TG represents the patriarch Christopher’s DNA and the other represents his wife’s DNA? In that case we would be seeing a sort of mid 1700’s phasing?
  3. Another option is that these 2 TGs represent common ancestors from different lines.

I suppose it won’t hurt to draw these 2 out.

2tg17s

Given that the chart is geared toward the Dicks Line in general, it would tend to favor Theory #2. Does anyone else have any ideas?

A Note on Ivy and crystal

In a previous Blog on the Henry Line, I had identified a TG with Esther, Joan, and Crystal. Here is what it looks like in gold on the current spreadsheet:

tg5ivy

Note that Crystal is conspicuously missing from this TG. Well, not that conspicuous as I didn’t notice at first. I was looking at Ivy/Crystal DNA matches, because at the top of the blog, I had noted they matched each other more than usual because they both shared not only the ancestor of Henry Dicks but also shared a common Matthews ancestor. Now we have a TG on Chromosome 5 between Esther, Joan and Crytal. We assume that TG represents Dicks DNA and a common ancestor of the patriarch Christopher Dicks. That means that between 73M and 111M Esther and Joan share Dicks DNA. Then why do Crystal and Ivy match each other and not match Esther and Joan from 77M to 85M? A likely explanation is that location is where they share Matthews DNA. This also means that at some point between 85M and 90M, Crystal has a crossover. This particular crossover is where the DNA she received crossed over from Matthews to Dicks or more specifically from John Matthews to  Fanny Dicks.

crystalivy

So we can identify very specifically from this TG, the exact ancestor that Crystal got her DNA from in these two segments of Chromosome 5. Usually we can just know it is one or the other ancestor. We have essentially phased Crystal’s 2nd great grandfather William Matthew’s DNA into a paternal and maternal side.

There are other likely implications from this TG

  • Wallace and Judy probably share Miller DNA in their Chromosome 5 segment above
  • Pauline and Kenneth likely share Joyce DNA in this area of Chromosome 5
  • Molly and Kenneth likely share Joyce DNA in this area of Chromosome 5

Now look at the last two bullets. If Kenneth shares Joyce DNA with Pauline and Molly, why do Pauline and Molly not share Joyce DNA with each other? The answer is that they do:

newjoycetg

So while finding a non-Dicks match within a Dicks TG, I found a separate non-Dicks TG. These 2 TGs, like the Chromosome 17 TGs are overlapping TGs to some extent. However, unlike the Chromosome 17 TGs, I was able to explain these 2 overlapping TGs at Chromosome 5. Perhaps what I have learned at Chromosome 5, I will be able to apply to Chromosome 17. But not now.

My Dicks Family TG Summary Table

This is a sort of a fingerprint of the Dicks TGs to date.

tgsumtable

A few notes:

  • I have the new (non-Dicks) Joyce TG I mentioned above as TG5A in a raspberry color
  • Here I split out TG 15A and 15B. 15A goes with Christopher Dicks b. 1789 and 15B goes with his father Christopher.
  • TG17A & B are the problem ones!
  • Gordon is in the most Henry Line TGs
  • The dark green TGs represent the common ancestor of the patriarch Christopher Dicks and his wife. The light green represent Christopher Dicks b. 1789, the son of the patriarch.
  • There is still no TG just within the Henry Dicks Line. A lot of that is due to there being no critical mass there yet. There needs to be a few more Henry Line testers for that to happen.

Summary and Conclusions

  • The addition of Gordon’s results have resulted in some more Dicks TGs
  • G17A and 17B were a problem as these were 2 overlapping TG – making it difficult to interpret the results
  • TG16A & B were interesting as they appear to show a definite link between the Henry and Christopher Lines and a link between the father Christopher and his two sons.
  • There appears to be no reason to question the genealogy chart as posted
  • I was able to find some non-Dicks DNA while looking at TGs. What other secrets are lurking out there deep within our DNA?
  • It has been interesting watching the Dicks DNA project expand.


The DNA of Henry Dicks of Newfoundland b. 1774

My past Blogs on the Dicks family of Newfoundland with one exception have focused on the Christopher Dicks descendants. I’ve written about the Christopher Dicks descendants because my wife is from that line. Here is a Henry Dicks Line working tree:

henrydickstree

I haven’t put much thought into the tree. I just mushed together trees I found. Eric is unsure of how he is connected to this line, so he is off to the side until we find out more. I believe that P.M. is on Ancestry but not Gedmatch.com so will not be analyzed. The others in green with first names are on Gedmatch. I use Gedmatch.com to analyze the DNA.

  • One important thing to note is that this chart shows that Shannon, Crystal and Ivy are all 6th cousins to each other. As such, their chances for sharing much of the Henry Dicks (b. 1774) DNA is quite small.
  • G.D. aka Gordon has the best chances to match others. He is a 4th cousin once or twice removed to the other Henry Dicks Line testers.
  • Also note the ancestors in pink. There are 2 Frances Dicks. They both married a Matthews. This is possible, but also looks suspicious.

This chart is from FTDNA which indicates less than 2% chance of matching for 6th cousins:

FTDNA Chances of Finding a Match

The chances of a 4th cousin, once removed matching should be halfway between the > 10% and > 50% (>30%?).

Now All the Dicks DNA

henry1774blog

Above I have the everyone comparison. Actually not everyone as I don’t have Shannon’s Uncle Dennis and Larry’s father Gordon yet.

Here’s what I see:

  • Ivy, Larry, Shannon, Crystal, and Eric in the purple rectangle are believed to be from the Henry Line from their research.
  • Everyone else is from the Christopher Dicks line.
  • My wife’s mom is Joan and her 1/2 great Aunt is Esther.
  • Christopher and Henry are believed to be brothers.
  • The DNA tested people within the Henry Line group don’t appear to match each other at significantly higher levels than those within the Christopher Dicks group. One exception to that rule appears to be Ivy and Crystal.
  • The DNA above seems to suggest that Ivy, Crystal and Eric are from the same line. On my earlier genealogy chart, Ivy and Crystal both show descent from Frances Dicks who married a Matthews. Perhaps this is one line instead of two. Perhaps Eric is also in that line.
  • To the right of the purple box shows where the Henry Line Dicks descendants match with Christopher Line Dicks descendants. This could mean that the groups match at the parents of Henry and Christopher. Alternatively, it could mean that 1) The two groups match because they descend from both lines or 2) The two groups could match on another non-Dicks line. Confusing, isn’t it?

To get to an answer to the questions in the last bullet requires a closer look at the Dicks DNA.

Dicks DNA and Triangulation

Triangulation is the case where at least three people have matching DNA. The DNA must be in the same area of the same Chromosome. Also Person 1 must match person 2, person 2 must match person 3 and person 1 must match person 3 in the same area. When that happens, we say that triangulated matching DNA segment represents a common ancestor or ancestral couple. This is helpful in sorting out which Dicks descendant goes in which Dicks Line. In a place like Newfoundland where intermarriage was not unusual, triangulation can be both helpful and/or confusing!

To triangulate, I downloaded everyone’s match to everyone else (with the exception of Larry and Gordon for now). Those DNA matches are put in a spreadsheet.

dicksmatchspreadsheet

Here I have highlighted the Henry Dicks Line testers in green. The way this downloads from Gedmatch, every match shows up twice: once in the name1 column and once in the name2 column.

A Deeper Look Into Chromosome 13

I picked Chromosome 13, because it appears that a lot is going on here.

dickschr13

Here I have sorted by Chromosome and Start Position. Right now, let’s just look at Larry, Kenneth, and Judy. It appears that there is a Triangulation Group (TG) between these 3 people. Larry matches Kenneth and Judy and Judy matches Kenneth. That is all we need and it is all at location 107M or before on Chromosome 13. That means that Larry, Judy, and Kenneth must have a common set of ancestors. But who are they? A good candidate would be Christopher Dicks. This is the Christopher who is believed to be the father of Henry. This will be difficult to show as I need to go to the bigger Dicks Chart:

tg13dickschart

On the left, I circled Larry and his dad. On the right is Judy and her 2nd cousin once removed Kenneth. That means that Larry is a 6th cousin with Judy and a mere 5th cousin, once removed to Kenneth. Just to be sure, I’ll check Larry’s dad, Gordon, to see how he matches with Kenneth.

kengordonmatch

That is a good match. Gedmatch thinks that these 2 have a common ancestor close to 4 generations away. Their actual Dicks ancestor according to the Dicks genealogy chart is actually 6 generations away from each of them. Other explanations:

  • These 2 may have more than one set of common ancestors. That isn’t obvious from my chart, but my chart doesn’t show everything. It just focuses on the Dicks lines.
  • These 2 could have a set of common ancestors that is closer to 4 generations away that isn’t obvious right now.
  • These 2 may just share a lot of DNA down from the mid 1700′ from Christopher Dicks and his wife.

Speaking of Larry’s father Gordon, I wrote to Larry and told him that his DNA results – at least for this Blog – would become obsolete once his father’s results were in. The reason for this is that Larry got all his DNA from his Dad and his dad would have on average twice as much Dicks DNA as Larry. Larry was fine with that.

Now that I have this new TG, I need a place to put it. Fortunately, I have a chart of the Dicks TGs that I have discovered:

dickstgsummrev

I have the Henry Line TGs in darker green – or rather the TGs in which there were Henry Line descendants . The Christopher Dicks Line only TGs are in lighter green. Non-Dicks TGs are in pink. Marilyn is in 2 different Dicks lines, so she is in grey as it is difficult to tell which line she is in from the DNA. The TG numbers and positions are in the first 2 column. As I look at Gordon’s new TG with Judy and Kenneth, I see the only other TG that Judy and Kenneth share is with Nelson. That TG is on Chromosome 15 from 51-65M. Let’s see if Gordon matches Nelson.

gordonnelsonmatch

They do match on Chromosome 15, right in the area of an existing presumed Dicks TG. But that will be the subject for a future Blog on the Henry Dicks line.

Back to Chromosome 13

What about the other matches on Chromosome 13?

dickschr13

First is Ivy and Esther. I’m not sure about this match. Esther is my wife’s 1/2 great Aunt. That means that Esther’s father was my mother in law’s grandfather, but Esther was from a second wife after the first died in the Flu Epidemic.Esther also has Dicks ancestors from both her parents. One Dicks line has not been figured out yet.

The next match is Joan and Esther. There is no overlap between this match and the previous. If there was, we may be able to show that the matches were for 2 different lines. This could be an Upshall match.

Nelson and Sandra – these 2 are uncle and niece, so they will share a lot of non-Dicks DNA.

More on Shannon’s Uncle Dennis

While I was out doing an errand I see that Dennis’ DNA at Gedmatch has been tokenized. I’m not sure if that is a real word, but it is a good thing. That means I can use all the features at Gedmatch now for him. Here is the revised all Dicks Matrix with Dennis at third down from the top of the list:

matrixrev

Now this is interesting. Where Shannon had no DNA matches with other Henry Dicks Line testers, her Uncle Dennis does. He matches with Crytal and Eric. The larger match between Dennis and Crystal appears to confirm a common ancestor with Henry Harold Dicks b. 1811:

If the chart is right, these 2 would be 4th cousins, once removed.

denniscrystalchart

Dennis’ First TG – chromosome 17

Here Dennis matches Wallace and Crystal. Then Crystal and Wallace match each other: a classic 3 person TG.

dennistg

tg17chart

This is a bit of a far-flung TG with Dennis and Crystal on the left representing the Henry Line and Wallace on the right. Assuming Christopher Dicks as the common ancestor, the chart represents 5th cousins, once and twice removed.

chr17matrix

This is the first Dicks TG for Chromosome 17. Also the first TG for Dennis and the first Henry Line TG with 2 Henry Line descendants.

Summary and Conclusions

  • The addition to the Dicks DNA project of Ivy, Shannon, Dennis, Larry and Gordon is making a big impact.
  • Those in TGs will need to check their genealogies to see if there are other possible common ancestors. If not, we can assume that we were right in assigning common ancestors to the Dicks line.
  • Comparing the DNA in some ways is the easy part. Then there is the interpretation of the DNA matches.
  • Next, I will look at Gordon’s DNA and also see if there are other implications that can be made from the DNA matches.


A False AncestryDNA Shared Ancestor Hint Analyzed

In this Blog, I would like to look at a Shared Ancestor Hint at AncestryDNA that appears to be a false DNA match. Deborah matches myself and my 3 siblings in the 6 cM range according to AncestryDNA using their own method which is supposed to take out false matches. Deborah’s match also results in a Shared Ancestor Hint (SAH) with myself and each of my 3 siblings:

deborahsah

This SAH looks fairly straightforward. It shows we have colonial Massachusetts ancestors that lived in Plymouth. Here is my phased paternal match with Deborah at Gedmatch:

phasedpatdeb

These results were also consistent with the visual phasing I did between 2 of my siblings:

chr13

The above Chromosome 13 map shows that the match with Deborah was in my Hartley grandfather’s region to the right of each blue bar. The first bar shows Sharon’s DNA, the second shows mine and the third is my sister Heidi’s.

This was initially exciting. I now had a chance to identify specific DNA and assign that DNA to a specific set of colonial ancestors. I contacted Deborah and found out that both her parents were tested also and  those results were at Gedmatch. She affirmed that the match would be on her mother’s side (based on genealogy). I compared my kit with Deborah’s mother’s and got no match. That appeared to prove that the Ancestry Shared Ancestry Hint was incorrect. The DNA that Ancestry matched with Churchill and Burbank could not be right.

This lead me to believe that I matched on Deborah’s father’s side. I checked that match at DNA which came up a blank. I wrote back to Deborah to say that this looked like my first confirmed Identical By Chance match.

Just to make sure, I compared Deborah’s family and my family:

deborahandhartley

What this shows is that neither I nor any of my siblings match Deborah’s parents. That is shown by the blank pink areas in the upper right and the lower left portions of the chart. Again, that means our match is not real. Yet, Deborah shows up as having a Shared Ancestor Hint for me and my 3 siblings. What is also interesting is that my sister Sharon has a 21.6 cM false match with Deborah. However, when I compare Sharon and Deborah ‘One to One’ at Gedmatch, I get a more reasonable result:

sharondeb

I suppose Sharon and Deborah share smaller segments. I checked again with a 5 cM threshold and indeed Sharon and Deborah share 2 more segments between 5 and 7 cM.

Any False Triangulation?

One other way to check Deborah’s match with my family is to see if she triangulates. I compared Deborah and Sharon in the Utility at Gedmatch that shows others that match both Sharon and Deborah. Here is the results of those matches at Chromosome 13 as shown in a browser:

sharondebchr13

Deborah and Sharon’s match is the blue top right one. Here there is clearly no indication of triangulation with Sharon and Deborah.  I would expect many other matches lining up below the top right blue match bar if there was any triangulated matches. This is further indication of a false match.

Summary and Conclusions

  • Ancestry is wise in not supplying me with a Chromosome Browser as it would prove some of their Shared Ancestor Hints as false.
  • A corollary would be, if you don’t want to prove AnceteryDNA Shared Ancestor Hints wrong, don’t use Gedmatch to compare your results
  • As others have noted, it is not enough to match someone through your phased kit. You also have to match the other person’s phased kit (or one of their parents) to be a real match.
  • This analysis applies to a relatively small match. This Shared Ancestry Hint was also at or near the bottom of the AncestryDNA list.
  • Be wary of the smaller matches. Focus on the larger ones unless you have good analysis such as triangulation to verify a smaller match.


DNA Phasing of Raw DNA When One Sibling is Missing: Part 10

In this Blog, I would like to portray my phasing results in an Excel Bar Chart if possible. This has been one of the most difficult parts a phasing my DNA for me.

I have looked at Stacked Bar Charts in Excel as they seem to be the closest to what I am looking for. Today I looked at a method for producing Gantt Charts at ablebits.com which seems to hold some promise of application for DNA mapping:

bar-chart-excel

I had my Maternal Patterns’ Starts and Stops from my last blog. I took those and converted them to Build 36 and put them in a spreadsheet:

momcrossoverstable

Start is the ID# I was using. Start36 is the Chromosome position of the Start of the pattern in Build 36. App ID is the approximate position of the Crossover. Then I have that same location in Build 37 and Build 36. Following the logic in the Ablebits.com tutorial, I have the first Maternal Crossovers for Chromosome 7 in my simplified Chart:

matfirstxover7

I got this by choosing the Build 36 column and choosing Insert Stacked Bar. I suppose a better Title would have been Chromosome 7 Maternal Crossover rather than Build 36. This was taken from my Column Header. The goal is to get a 2 color bar above. However, I already see a problem. The bar needs to be different colors for different people. Well, I have to start somewhere.

Next, I put in the next crossover location for each person. I took this position and subtracted from it the first Crossover to get a length.

step2crossexcel

You may note that the Bar Chart inverts the original order. It gives Sharon a 4 which is now on top. Here is my visual phasing of Chromosome 7 that I am trying to replicate:

chr7visphase

My Excel Bar Chart order is Sharon, Jon, Joel, Heidi. My visual phasing order is Sharon, Joel, Heidi, Jon. The 2 maternal colors I have above are green and orange representing Lentz and Rathfelder. If I keep orange as Rathfelder, that means I want to change bar 2 and 3 (Joel and Jon) on the Excel Bar Chart. One way to do this is to move over the first Crossovers for Joel and Jon in my spreadsheet:

modchart

However, that made the 2 male siblings’ first maternal grandparent match too long. I needed to move the start over 2 places in my spreadsheet:

mat7revised

Now the Chr7 Maternal Crossover column can be called Lentz and the 2length column can be called Rathfelder.

Next, I added another column for the next Lentz portion of DNA:

chr73rdxover

I was hoping that if I named the next column Lentz, that Excel would give me the same blue as the first Lentz. I was able to right click on the gray and change it to blue. I then added another Rathfelder segment. For this to work in Excel, a Rathfelder length is added rather than a start and stop location.

chr7xover3

Again, I had to reformat the Excel-chosen color to be consistent with what I had for Rathfelder. I chose the last position for Heidi and Sharon as the highest that I had as this was their last segment. After a bit of wrangling with Excel, I was able to get this:

chr7

So that is the presentation. However, I notice that on my visual phasing, I had 5 segments for Jon and only 4 here. I missed his last Rathfelder segment. I had ended Jon’s Chromosome too early. Here is the correction:

chr7corrected

It still looks like one of Jon’s crossovers in the middle of the Chromosome may be off, but I’ll have to figure that out later.

Paternal Bar Chart

Now that I have something that looks like a maternal Chromosome Map, I need the paternal side to go along with it. It looks like if I add 4 more rows to my spreadsheet, I may have it.

I did this and I added Hartley and Frazer (my paternal side grandparents) to the right of the maternal side grandparents. I had to make a new chart that came out like this:

chr7matpat

Here #4 is my Paternal DNA. I found it a bit disconcerting that my paternal side was longer than the maternal. Here I’ve added a bit of formatting and made the colors consistent (one color per grandparent):

chr7patmatmap

Well, I guess I’ll just leave this imperfect. It will give me something to work on later. I did change the scale from millions to M’s to be easier to read.  The above shows that Jon and Heidi share their paternal grandfather’s Hartley DNA un-recombined on Chromosome 7.

Summary and Conclusions

  • Learning how to phase my raw DNA has been interesting and time consuming
  • Delving into the A’s, G’s, T’s and C’s promotes understanding of one’s DNA
  • I owe a lot to M MacNeill and Whit Athey in learning how to do this phasing
  • Due to the data intensive nature of phasing, I would recommend the use of MS Access or some other database software.
  • An understanding of Excel or similar spreadsheet software is also important.
  • I had tested my brother Jon as an afterthought. It turned out that his test results were important in determining the phasing of the 4 siblings.
  • I have the overall skeleton of the phasing with crossovers. There is still a lot of work to complete the individual Chromosomes and trouble shoot problem areas.
  • Further, I have not worked on the X Chromosome due to the different nature of that Chromosome. My brother and I are already phased. My sisters are not.
  • Once these maps are done they will be a reference to all matches to my 3 siblings and myself.

DNA Phasing of 4 Siblings When One Parent Is Missing: Part 9

Mom Patterns

Up to this point, I have phased 4 siblings based on 3 principles outlined by Whit Athey. I have looked at the bases the 4 siblings had from their Dad. Those Dad bases made up patterns. Based on those patterns, other Dad bases were added to those siblings within those pattern areas. After those bases were added, mom bases were added where the siblings were heterozygous. The changes were documented in a Base Tracker.

Start stop using access min max – AAAB Mom Pattern

I can just look at my previous Blog to see what I did for my dad pattern. The results of this query:

mompatternquery

get copied to this spreadsheet where I added a column for Pattern:

mompatternspreadsheet

That was my big time saving step from my last query. Before I run each Min Max Total Query, I check a regular Select Query to make sure I have the right pattern. For example, here is my ABBA Mom Pattern check:

abbacheck

In a few minutes, I have 111 Start/Stop Mom Pattern pairs. This time, I’ll add conditional formatting to point out the one position patterns:

startstoponepattern

These single patterns tend to mess me up as I’m looking for patterns, so I’ll take them out of my spreadsheet, but not out of my Access data tables. There were 10 of these. I don’t know if that is a lot.

Getting better starts and stop for the mom patterns

The next step takes a little while. I look at the [now] 95 Start/Stop pairs for the various patterns. I highlighted the overlapping areas in yellow:

mompatternoverlaps

Actually, the first pattern overlaps into the second also. Some of these may be caused by single location patterns. For example at Chromosome 1, when I got to ID# 548 I find this:

momchr1

There is an ABAA Pattern, but it only lasts for one position and then is on to an ABBB pattern. I copied the end location for ABAA and put it at the end of Chromosome 1 to check later and made note of the one position pattern:

onepatternchr1mom

After that, it makes more sense that the ABBB pattern Stop at 2314 goes into an AABB Pattern Start at 2317. Here is the adjusted Chromosome 1 for my siblings’ Mom Patterns:

cleaneduppatternsmom

I moved the first Start to the Start of Chromosome 1 and last Stop to the end of Chromosome 1 as they were already pretty close to those positions. All combinations of patterns are represented here except for ABAB. I don’t have a start and stop for the single patterns as I’ll be taking them out later.

Filling In Mom Patterns

Now that I have all the mom patterns and their starts and stops as well as I can, I will fill in the patterns. I’ll start with AAAB. First I use the Concatenate formula in Excel to get my starts and stops in Access language. Then I sort the patterns in Excel:

mompatterssorted

I have 19 AAAB Mom Patterns. Next I go into Access and create an Update Query using the table called tbl4SibsNewMomPatternsFillin. In the AAAB Pattern, I will want to fill in the missing A’s.

updatequeryaaabmom

This looks like a good query, but I want to track how many bases I’m updating, so this query would make it difficult to track that as I’m adding bases to Sharon and Heidi. So again, I will go with the simpler query.

aaabsimplerupdate

Here is the first Mom Pattern Fill-in update on the Base Tracker:

basetrackeraaabmom

I continued the same process down the Mom Patterns, filling in what was missing from each of the siblngs:

momfillinupdatetracker

In each case for each pattern, I added less than 5,000 bases to each sibling. I also added to my spreadsheet a percentage of overall phasing which is now at 89.1%. This is how the 4 siblings are phased on average. Jon, who tested with the Ancestry V2 is bringing the other siblings’ overall average down.

Principle 3 – Dad Bases From Mom Bases

This is the icing on the cake for me. After all the work of determining Patterns and Starts and Stops, I have an easy step to add bases. Principle 3 says if you are heterozygous and you know one of your bases is assigned to one parent, then the other base must be assigned to the other parent.

I had to look at my previous blog to see how I did this. Let’s see if this looks right:

udatedadfrommom

The first column makes sure that I am heterozygous as my 2 alleles are not the same. The 2nd columns says that I know that I got allele2 from Mom. The 3rd column says to put my allele1 as the one I got from dad. That seems to make sense. This results in 9523 rows of updates in 22 Chromosomes. In part 2 of this Update Query, I switch the alleles:

dadfrommomforjoel

This says if my allele1 is from Mom assign allele2 to be from Dad.

Summary of Pattern Filling In and Dad Bases from Mom Bases

btdadfrommom

Here the overall phasing is 90%, but I had a pretty strict measure of phasing. It involved alleles that Jon was not even tested for. Here we are getting a diminishing return. I could continue the process, but I won’t.

Next Steps

Now I have a good idea where all the crossovers are. I need to assign those to siblings. Then I need to figure out how to portray the final results.

Assigning Crossovers to Siblings

I might as well jump right in. I’ll try a Chromosome that McNeill has mapped. Actually, he only did the 3 siblings at the time, so it may be a little different.

Chromosome 7 Crossovers

This has been mapped by MacNeill to 3 siblings. Let’s see how my mapping compares. Here is the mom pattern:

momstartstop7

Here I have by my own ID’s the start and stop. Then I have gap to the next pattern. This may indicate an AAAA pattern. Under description, I have what the pattern changes are. Then I have the person assigned to the Crossover. Then I have the approximate location of the Crossover. The first line I have the description as ABBA to ABBB. Here, Jon (in the last position) was matching with me as I’m in the first position of course. Then he changed to match with Sharon and Heidi. So I assigned the crossover to him.

Look at the 5th line. The pattern is ABAB to AAAB. This goes through a gap of over 6,000 ID’s. That usually means there is an AAAA pattern there.  AAAA could go to AAAB easily, but to go from ABAB to AAAA would take two crossovers. I don’t have a good idea where the crossover is, so I’ll go to gedmatch. The good news is that I have already tried using visual phasing on this Chromsome:

chr7vismapjon

The crossovers that I looked at above in my spreadsheet were on the maternal side. So that would be the top part of the bar (green-orange). It looks like I have 11 or 12 maternal crossovers, if I did it right. Looking at the top part of the image above, notice the non-match areas. These have no blue bar below and have red areas above. These are important. The reason is that if there is any of these areas at any place, there cannot be an AAAA pattern for maternal or paternal. That means that all 4 siblings cannot match the same grandparent in any of these areas. The only potential AAAA patterns, then are at either ends of the Chromosome or in the middle. The middle locations are about 60-70M. Also note that I have Rathfelder as the same match for each sibling from 56-70M.

There is a discrepancy between my spreadsheet crossovers (7) and the visual above (11 or 12). The other problem is that I need a double conversion from my spreadsheet. The spreadsheet is in ID’s which refers to Build 37 locations and Gedmatch is in Build 36.

Before I start converting numbers, I’ll look at what I have for the Dad Crossovers.

dadpatterncrossover7

Here I added a position number for the Chromosome (Build 37). This matches up with the visual phasing above. What is missing would be the crossover for Joel after an AAAA pattern at the beginning of the Chromosome.

Where is Heidi?

As I look at the maternal visual phasing, I see that Heidi has 3 crossovers. On my spreadsheet, she doesn’t have any. One can be explained as going onto the right end of the Chromosome to an AAAA pattern, but what about the other 2 crossovers, in the middle of the Chromosome? I got these positions from an old file where I compared myself to my 2 sisters. Then I put those in a spreadsheet and converted them to Build 37:

findingheidi

The Chromosome position numbers in blue were where I had Heidi’s crossovers. I then went to my Access Database.

Heidi found

heidi

Here is an ABBB Mom Pattern that I missed. Going through the list, I updated my crossover list:

updatedchr7xover

Now I am up to 12 Maternal Crossovers. The AAAA patterns tend to fit in naturally. Note next to the first blue ‘Joel’. There would be no way to go to an ABBB pattern to an AAAB pattern without 2 changes. That is why an AAAA pattern is required within the other 2 patterns.

Paternal Crossovers – Chromosome 7

crossoverschr7

Here I only show 2 crossovers, where on my map above, I show 3. I am just missing my own crossover from AAAA to ABBB. This is at the beginning of Chromosome 7. Here is my database table for my Dad Patterns:

chr7dadpattern

The position I have highlighted would still be an AAAA pattern as I have A??A. So that is the last position with that pattern. Id 285993 is the first spot I have the ABBB pattern, so I chose the crossover as ID# 285992 (under App. ID):


dadcrossover7

Here is what MacNeill had for 3 siblings at Chromosome 7:

macneill-chr7

What is now clear from have 4 DNA tested siblings is that my first crossover is paternal and not maternal. For my first crossover to be maternal, I would have had to have gone from an AAAA pattern to an ABBA pattern which would have been a double crossover. Having my brother Jon (the last ‘A’) tested made that clear.

Summary

In this Blog, I have looked at the Mom Patterns created by 4 siblings. Based on those patterns I have filled in alleles from other siblings. I have also filled in alleles for heterozygous siblings. This is based on the Mom allele being known and assigning the other allele as from the Dad. Then I looked at assigning crossovers to the various siblings. Based on the Patterns, it seemed clear who the crossovers should be assigned to. I then checked the crossovers I had with a visual phasing based on gedmatch. This showed where I was missing crossovers, which I was able to add using Chromosome 7 as an example.

Next: How to show the final results?

DNA Phasing of 4 Siblings When One Parent Is Missing: Part 8

Dad Patterns

In my last Blog, I looked at the Whit Athey 3 Principles and used MS Access to assign bases to the paternal or maternal side for the 4 tested siblings of my family. The next step is to look at Dad Patterns. I have been doing this by querying for a pattern and then scrolling down for start and stop positions. This has been quite tedious. It occurred to me that there may be another way to do this.

MS Access Min Max Functions

Access has a function that finds a minimum or maximum value in a group. In this case the group can be Chromosome.

AAAB Dad Pattern – Access to the rescue


aaabminmax

To get the total line I hit the summation [totals] icon in the Show/Hide Group. This adds a Group By to each field to in the Total row. Here I looked for the Minimum and Maximum ID for each chromosome for the AAAB Dad Pattern. That is where Joel’s base from dad was the same as Sharon’s. Sharon’s base from dad was the same as Heidi’s and Heidi’s base from Dad was different from Jon’s. Here is the output for the AAAB Dad Pattern:

aaabminmaxresults

This step has revolutionized my work as it saves me from scrolling through 100’s of thousands of dad base AAAB Patterns.  This takes about 2 minutes vs. the old way which seemed like an hour.

The upside of this method is that it is fast. The downside is that it only finds the minimum and maximum of a pattern within a chromosome. It doesn’t find all the breaks in the patterns within the chromosomes.

Using this method, in a couple of minutes I have 91 Start and Stop locations for all the possible patterns – except for AAAA.

Here are the sorted results for Chromosome 1:

dadpatternchr1

Note that there are some overlaps that will need to be resolved. However, there also clean breaks such as between ABBB and ABAB. ABBB stops at ID# 19797 and ABAB starts at 19837. Also note the last line. AABA has the same Min and Max ID#. This means that this is a single AABA pattern apparently within the AABB pattern.

Looking at the Table

In this step, I’ll look at tbl4SibsNewDadPattern and use the Access Pattern Mins and Maxes to get more accurate Start and Stop points. My spreadsheet above shows that ABAA starts at ID 52. I scroll up from there:

chr1tabledadpattern

At ID# 18 I see ?AG?. I can imagine that being an ABAA pattern, so why not start the ABAA Dad Pattern at ID# 1? Out of 680,000 ID’s, that doesn’t seem too much of a stretch.

Next it seems like the ABAA should stop somewhere before ID# 6605. I’ll hasten the process by a query that looks at the case where Sharon’s base from Dad is not equal to Heidi’s Base from Dad:

abaa-stop

Clearly, there is a break at ID# 5127, so I’ll use that.

chr1dadpatternstartstop

Here, I’ve added a finer Start and Stop for Dad Pattern ABAA. What that means is that in this segment of Chromosome 1, I got my DNA from one of my dad’s grandparents as did Heidi and Jon. Sharon got here DNA from the opposite paternal grandparent.

Here is the Start/Stops filled in:

chr1dadpatternfilledin

I highlighted the 57205 as a reminder that I needed to add an extra ABAA pattern in later. There is a gap between ABAA and ABBB of 1477 ID’s where there is a likely AAAA pattern, which means the 4 siblings got their DNA from the same paternal grandparent.

Finished Start Stop Dad Pattern Spreadsheet

I took out the single patterns and re-sorted by pattern. Then I wrote a formula to get the locations in Access language:

dadpatternstartstop

Next I made a copy of my working table in Access to a new table called tbl4SibsNewDadPatternFillin. I’ll use this to fill in the Dad Patterns.

Filling in the First AAAB Pattern

In this pattern, I will be filling in all the missing ‘A’s of the AAAB pattern. I won’t fill in the B as I won’t know if an ‘A’ or a ‘B’ belong there. Here is my first update query:

aaabupdate

This says if I am missing a base from dad in any of the AAAB Pattern areas that I am in and Sharon has that base, I’ll take the base she has. I can save a little time, by adding on to that query:

joelaaabfromsharonheidi

It is important to put the second ‘Is Not Null’ and ‘Is Null’ on a separate line as that is the ‘or’ line. Otherwise, I would only get the Sharon from Dad and Heidi from Dad bases where they equaled each other.

First I run the query to make sure it shows what I want.

aaabqueryex

It does [although, see below. For one thing I missed the ID criteria in the 2nd line of criteria!]. If I had the criteria all on one line, I wouldn’t have gotten the Heidi from Dad bases where Sharon is missing a base (ID# 63) and visa versa. I will want to check my query later, so I can check it at least two ways. One way is to check at ID# 63 and 99 to see if that base was added. The other way is to see if the Update Query updates 49094 lines as that is the number of lines in the above query.

When I went to run my query, I got this error:

udateaaaberror

Before I give up on this double query, I’ll try one more thing:

heidiorsharonaaabtojoel

Here I say if the conditions I mentioned above apply give either Heidi’s base from Dad or Sharon’s base from dad to me. I note that the update is for 49094 rows, so that seems on the right track. The reason why I don’t mind doing a double query here is that either Heidi’s base from Dad or Sharon’s should always be the same in an AAAB pattern.

I ran this and now I am checking ID# 63:

erroraaab

Unfortunately, Access gave me a -1 instead of Heidi’s C Base from dad. Part of why I wanted to do the one query is so I wouldn’t have to add the 2 queries. However, instead, I’ll just add a line to my base tracker:

basetrackernew

That means that I am back to my simpler query. Sharon should add 3975 bases from Dad to my bases from Dad:

3975row

Heidi was going to add over 2200 of her bases from Dad before Sharon gave me hers. Now it is a lower number:

heidibasestojoel

Now check Line 63:

line63

My base from Dad still isn’t filled in. But that is a good thing. When I checked my double query above, it gave me areas outside the AAAB Pattern area. ID# 63 is actually a different pattern. So that is why the number was so high also. The lesson learned is to keep the queries simple.

Now I’ve updated my Base Tracker for the AAAB Dad Pattern:

aaabbasetracker

Note that the Heidi from Dad Bases didn’t go up in the second round of this query. After she had gotten her extra Dad bases from me in the AAAB region, Sharon didn’t have any extra ones to give to her that I hadn’t already.

nodadbasestoheidifromsharon

AABA Fill-in

This time Heidi will be left out and Joel, Sharon and Jon will get new bases from dad based on others from the AABA areas. This is the same simple query as before, except that the ID#’s are different:

aabafillin

Here is Jon’s first bases from Dad from one of his siblings:

jonfromdad

This brings up an interesting point. There may be cases where Jon has a phased base at a location which his DNA test didn’t cover.

AABB Fill-IN

Here there should be Bases for all siblings. Wherever there is an A and an missing A, add it, and the same for B. Again my first query is the same except for the ID#’s:

aabbfillin

On the AABB bases from Dad, Jon doesn’t have a lot to add to Heidi’s bases, but Heidi has a lot to add to Jon’s:

aabbbasetracker

abaa dad pattern fill-in

Here we start with Joel being updated with Heidi’s bases from Dad because Sharon is the lone B.

abaa

There are more rows updated as the ABAA Dad Patterns had more regions than the other patterns.

In my last update query, I made a mistake:

jonfromjoelmistake

I’m not sure if it makes a difference. I said that in the case where my base from Mom is not null, give Jon my Base from Dad where he doesn’t have any. To check, I run the correct query:

abaaquerymistake

This shows that there are still 2063 bases that didn’t get added to Jon from my bases from Dad. I will add them now. Plus I will add that number to the previous 29113 bases I added to Jon’s bases from Dad from my bases from Dad.

abaatracker

As there were 3 siblings the same in this pattern, I again took 2 rows to add the bases to the table.

ABAB Dad Pattern Fill-in

ababtracker

Jon now has more bases phased than he had tested on his paternal side. He already had more than he had tested on the maternal side.

ABBA and ABBB Dad Pattern Fill-ins

basetrackersummary

As expected, Jon made out best in this Pattern Phasing.

Mom Bases From Dad Bases

This is the part of the project that seems ironic. My dad who wasn’t tested for DNA is now supplying bases to his children that were from their mom. Here I’m looking for where the siblings are heterozygous. In those cases where there is now a Dad base from the patterns and a mom base is missing, we can fill it in.

First, I am making another copy of my table called tble4SibsNewMomPatternFillin.

Here is my first Mom from Dad Update Query:

joeldadfrommom

It says where I am heterozygous and my Dad base is my 2nd one put my first base in as the base I got from Mom, but only if she doesn’t already have a base there. The last part is just an extra precaution so that I don’t overwrite anything.

In the next query, I just reverse the Joelallele1 and 2 to get 12,000 more rows of phased DNA:

momfromdad2

Summary of Mom Bases from Dad Bases

trackermomfromdad

Check the numbers

I have been adding up the rows added. But now I will check my table to see of the Total Bases Phased added up. And the answer is:

countfromtbl

The numbers are pretty close. The above Heidi from Dad is higher than my tracker. I’m guessing the table sums are correct and mine are a little off. The means that Heidi’s paternal phasing should be a little lower.

Part 8 Summary

  • The use of MS Access Min and Max functions to get Dad Pattern starts and stops saved a lot of time
  • It still takes time to verify those starts and stops
  • The Base Tracker makes it easier to track the numbers and the process. It is also interesting to see how the % phased goes up with each round of updates
  • I wasn’t expecting the numbers from my base tracker and actual updated bases to reconcile perfectly, but most of the numbers did. It is possible the discrepancies are from the 2 minor errors I made and tried to correct along the way.