My Hartley YDNA

After writing over 50 Blogs on genetic genealogy, I realized that I hadn’t written a blog on my Hartley YDNA. I have written on Frazer YDNA and my wife’s family YDNA (Butler), but not one just on Hartley YDNA. This will not be on all Hartley YDNA as I know the most about mine. There are other Hartley Lines that aren’t closely related to mine.

Many reading this blog will know already that the YDNA is used often in Surname studies. This is because YDNA is passed mostly unchanged from father to son. I say mostly because there are slow changes that occur. These slow changes are what make the differences in the different STRs and SNPs.  STRs and SNPs are the 2 major types of YDNA of importance in genetic genealogy. In this Blog, I’ll write about my own STRs and SNPs and how they relate to each other. I’ll also look at a few ways of analyzing YDNA results. There is a lot to cover here.

SNPs – Single Nucleotide Polymorphisms

SNPs are formed due to genetic mutations and are very specific and unambiguous. They can be used to trace one’s line back to a genetic Adam and place one into a specific group of people. Here is the broad difference between SNPs. They are listed between the letters A and T below.

All SNPs

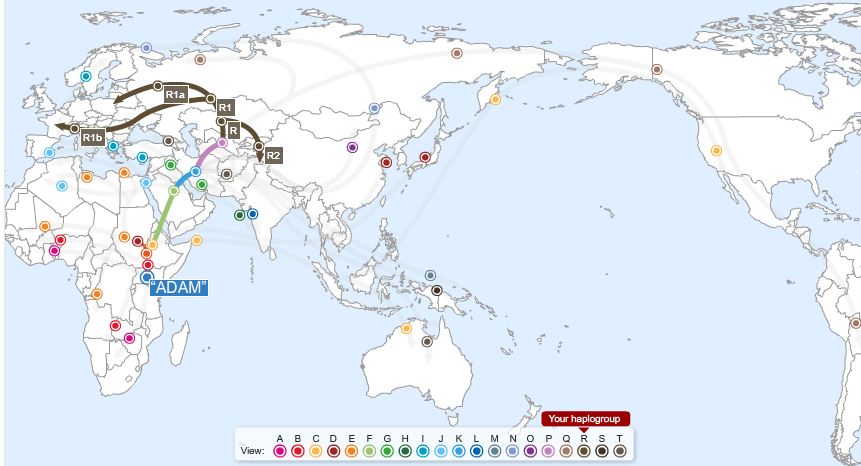
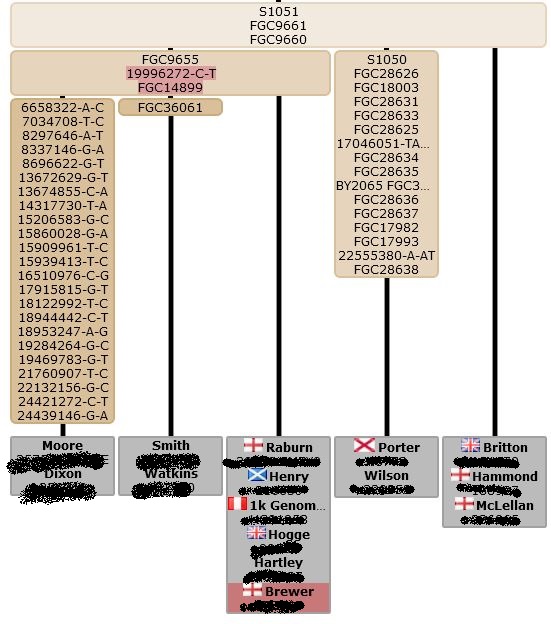
My Hartley Line is broadly R1b. My Frazer line is R1a. They split off at some point and appear to have taken a more northerly route through Europe. R1b is the most common YDNA in Western Europe. Further, there are 2 branches that are common within R1b. These 2 types are listed by their test names. They are R-U106 and R-P312. In England, the R-U106 represents the Anglo Saxons. They came from the areas around Germany.  It turns out that I am R-P312 and further L21. See the bottom left of the tree below.

Tree to L21

L21 is known for the Irish and Scots. But there are also English L21. Actually, I would like to think of myself as British. The British represents the older stock in England whereas the Anglo (hence English) Saxon are the late comers. More of the U106 are found in the Southeast England where the Anglo Saxons entered. The L21’s are found more in the North and West of England and in Ireland.

L21 Map

For some reason, I was relieved to find out that I was R-L21. I guess I liked the idea of being associated with the old timers vs. the invaders. Also, even though the Celts are not a genetic group per se, they have been associated with R-L21. Here is a map of England in 600 A.D showing the British/Anglo Saxon split.

Briton 600

More on L21

It took me quite a while testing my YDNA to find out that I was L21. There are many levels of subdivisions below L21. Here is an L21 Tree that is almost 2 years out of date. On it, I tried to place some of the Hartleys that had tested up to that point. Some that I wasn’t sure of I put in the upper left of the chart.

L21 2014 Map

At that time, I had put my ancestor, Robert Hartley in the L513  Group (dark yellow) and one step under that at S5668. Due to in a large part, people doing a Big Y test, many new SNPs have been discovered and placed  in the tree. Now R-L513 has it’s own Tree.

L513 map

Finally, I have tested positive for Z17911 and Z17912. These are equivalent SNPs.  The people listed on the main tree are ones that have taken the Big Y or equivalent tests. Once I get my results, my name will show above with Merrick and Thomas – or perhaps in my own group.

L513 Tree Section

As far as I know, Z17911 is the end of the line or what has been referred to as a terminal SNP. However, Big Y testing may reveal more. There are also SNPs which are called private or family SNPs. One or more of these may be found in my BigY results for the Hartley family.

STRs – Short Tandem Repeats

The STR was the first type of YDNA to be used for genetic genealogy. I think of these as a stutter in the DNA. These are extra copies that happen in specific areas of the YDNA that are noted and used for comparison purposes. Standard tests range from 12 STRs to 111 STRs or more. The more you test, the more you pay. Each of these STR locations have their own rates of change. There are the fast changing STRs and the slower ones.

My Hartley STRs

Here are some of my Hartley STRs. First I’ll explain the headings below. Dark blue is the first panel of 12 SNPs. Maroon represents the faster changing STRs. The next set of lighter blue is up to 25 STRs. The next lighter blue is up to the 37 level. The  lightest blue on the right is STR 38 to 67. I didn’t include all my 67 in the image below.

STR Locations JoelJoel's Z Strs

This image is small, and it is taken from the Z17911 group. These people have tested positive for Z17911 and are listed in the FTDNA R1b-L513 Project. The rows of numbers are the STR values (or numbers of repeats). The rows are:

  • Minimum value (in this case of those that have tested positive for Z17911)
  • Maximum value
  • Mode – this has also been used to approximate an ancestral value for the group
  • Hartley (me)
  • Thomas
  • Goff
  • Merrick
Genetic distance (GD)

There are a few ways STRs are used. One is GD or Genetic Distance. When I compare my STR test to another Hartley, for example, it counts the number of differences between the two tests. Some of the numbers in the rows above are highlighted in either purple or pink. The purple values for the 4th line (Hartley) are less than the mode. The pink values are more than the mode. So in the first 37 STRs for my results there are 6 highlighted values. That would be a GD of either 5 or 6. There are 2 ways of counting. For the 5th maroon named marker there are 4 values. There is a method called Infinite Alleles Model which would only count any changes within that named maroon region as one.

Note that of these 6 differences or GD’s in my results, 4 are in the slower moving areas and 2 are in the faster moving areas. I note that at Family Tree DNA (FTDNA) I am not shown as related to any within my Z17911 Group. However, that is OK. For 37 STRs my highest GD is 4. I don’t think FTDNA shows higher than that. For 67 STRs, FTDNA’s highest GD is 7.  This is because, when more STRs are compared, more GDs are allowed to make a match.  I further note that at 37 STRs, I match 3 Hartleys, one believed to be descended from a Hartley and 2 non-Hartleys. At the 67 YDNA match level at FTDNA, I have the same person believed to be descended from a Hartley and 3 other with the Hartley surname. So it seems like the FTDNA system is working. However, to get the matches that are further away, one must look at a SNP project or surname project.

where is the common ancestor for STR matches?

FTDNA uses a TIP Report to guess how closely related I am to my YDNA matches. My closest match at the 67 STR level is at a GD of 4. That isn’t very close. However, close is relative.

The first one on my YDNA match list is Sanchez – believed to be of Hartley descent. The TIP Report tells me this:

Sanchez TIP

The second on my 67 STR YDNA match list has a Hartley surname. We also have a GD of 4 and the TIP Report looks like this:

Hartley TIP

Notice that the TIP Report shows a better likelihood that I’m related to Hartley than Sanchez. This is because the TIP Report considers the speed of change of the markers. The markers that are different between Hartley and myself are faster moving ones than the ones that are different between Sanchez and myself. As there are only averages of how often these markers change, this is not an exact science. The tables just show likelihood of when we may have had a common ancestor.

strs used to predict the r-L513 SNP

Here I should mention the difference between a haplogroup and a haplotype. I mention it partially, because I forget which is which. A haplogroup has to do with a SNP. Examples of a haplogroup are R1b, L21, etc. Sometimes the smaller groups are called subclades or subgroups. According to Wikipedia, “Subclades are defined by a terminal SNP…”. So my Z17911 would be a subclade.

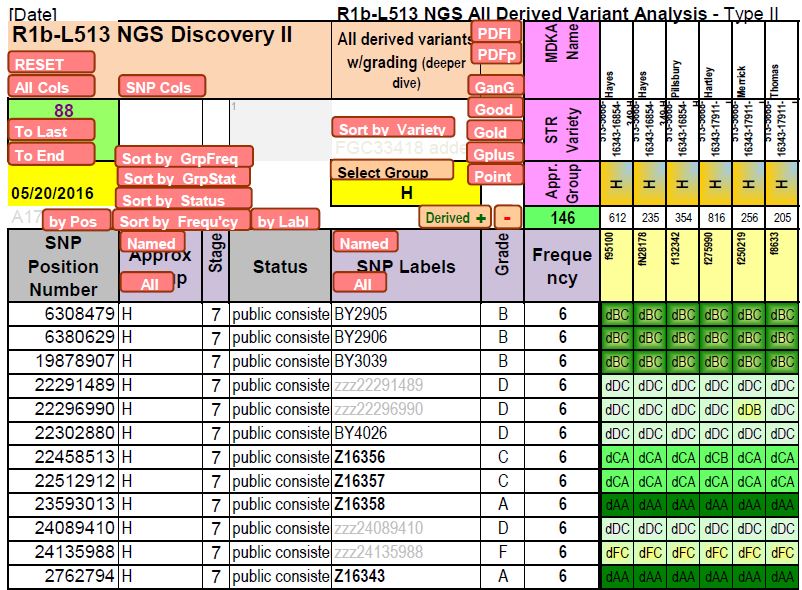
Apparently there is more than one definition of haplotype. The one I am thinking of refers to a specific grouping of STRs that stands out. One such grouping of STRs (haplotype) defines the R-L513 Haplogroup. Before the L513 SNP was discovered, people analyzed the STRs and noticed certain patterns. Based on those patterns, the STR results were put into different groups. One such pattern was (and is) DYS406s1>=11 and DYS617=13. When people testing their STRs found these 2 values, they were almost always L513 as confirmed by their SNP testing. So for the longest time, the group was called the 11-13 Combo group rather than the L513 group. Let’s look at the top of the L513 YDNA results page to see if this pattern is true:

406S1 617

Notice that there are a few here that are different, but these may represent rare mutations.  In my Z17911, we all meet the criteria.

Strs predicting Z17911 SNPs

I noticed in the L513 Yahoo Mail Group that I belong to, there were some predictions based on STRs that there could be more Z17911’s. Here is part of a post from March 2016 on the Yahoo L513 Group from the administrator,

“Below is a list of the people I’ve added in the last three weeks, the project I found them in and their predicted variety. This is sorted by variety label.
293533 William Hartley b. 1745 d. after 1807 Hartley 513-5668-16357-16343-17911-JM
372104 Sanchez, b. Spain L513 513-5668-16357-16343-17911-JM”

Sanchez believes he has a Hartley ancestor. So it is interesting that I will likely have more company at the Z17911 SNP. Here is another interesting post from the administrator of the L513 Yahoo Mail Group in October 2015 to Jared who felt he was mis-grouped:

Hi Jared, I mis-grouped you. I will fix. I intended to put you in the “J” STR variety/cluster.  I’m not positive you are in “J” and could be in “H” or a little different yet. It’s hard to make judgements on this, particularly at only 37 STRs.

Here are all the people that I’m aware that off modal values for STRs 390=25 389i=14 458>=18 449>=31 464c=16 and high CDY numbers. You might actually fit in better with the Phillips and Vaughan side of “J” than the Merrick or Thomas.

We think this group is all Z17911+ but I’m not sure. I would say you are Z16343+ at he very least. Z16343 also marks the “H” variety people (Hayes/Pillsbury). No guarantees.

f307773    Smith    R1b-L21>DF13>L513
fN56253    Gilroy    R1b-L21>DF13>L513
fN114296    Gilroy    R1b-L21>DF13>L513
f275990    Hartley    R1b-L21>DF13>L513>S5668>Z16343>Z17911
f280251    Hartley    zzL21suspect
f117349    Hartley    zzL21suspect
f200669    Head    zzL21suspect
f160646    Phillips    zzL21suspect
f271571    Phillips    zzL21suspect
f158089    Phillips    zzL21suspect
f160637    Phillips    zzL21suspect
f113390    Phillips    zzL21suspect
f306961    Phillips    zzL21suspect
f116935    Vaughan    zzL21suspect
f160729    Vaughan    zzL21suspect
f271772    Vaughn    zzL21suspect
f105064    zzzUnk(Phillips)    zzL21suspect

I am the first Hartley mentioned above. Then there are 2 others that may be Z17911. So that means that rather than me being all alone at Z17911, there may be 4 other Hartleys joining me. That is progress. Based on the L513 Administrator’s (Mike’s) STR analysis those 4 would be Z17911. Here are my STR values highlighted in blue with Mike’s Z17911 signature STRs.

Z17911 STRs

I meet all the Z17911 signature STRs which makes sense as I have tested positive for Z17911. These predictions can save a lot of money for people testing SNPs. Rather than testing a series of 4 or 5 SNPs to see where they are on the SNP Tree, they can just test for Z17911 to see if they are positive for that.

Using STRs to Create New SNPs

ISOGG is the International Society of Genetic Genealogists. They have a guidelines for naming new SNPs:

The objective of the ISOGG Tree at this time is to include all SNPs that arose prior to about the year 1500 C.E. This guideline may be measured through STR diversity or alternative evidence.

Where a new terminal subgroup is being added, STR marker results or other evidence described below for two men with the new SNP are needed.

STR Diversity
To be accepted the SNP must be observed in at least two individuals and must meet the STR diversity requirement. A SNP that does not meet this requirement will be classified as a Private SNP (see definition above).

The STR diversity requirement is met if the following conditions are satisfied:

  1. If the SNP is a Non-Terminal Branch SNP, no further proof of diversity is required.
  2. Genetic distance is calculated using the Infinite Alleles Model (IAM). A marker for which there is a null value in one sample must be discarded from the calculations. Otherwise, most laboratories use the IAM.
  3. All markers tested by both individuals must be compared.
  4. If 74 markers (or fewer) are compared, the minimum genetic distance to meet the diversity requirement is 5.
  5. If 75 (or more) markers are compared, the diversity requirement is a minimum of 7%, computed by dividing the genetic distance by the number of markers compared, and rounding to the nearest integer value.

This is what happened when my Terminal SNP was accepted. Usually, one would be looking for a low GD for a match, say. Here, for the addition of new SNPs a higher GD is needed to show that the SNP is not a private SNP. Here is another message written June 2015 by a fellow Z17911 from the Yahoo L513 Mail Group that I’m in:

Hi Mike,

I tried to figure the Infinite allele GD for the three current SNP-tested members of Z17911 (if I understood DYS464 and CDY correctly):

Hartley/Merrick = GD 14
Hartley/Thomas = GD 12
Merrick/Thomas = GD 10

I hope this is helpful.
Charles Thomas 8633 

Mike followed up with:

Yes, Charles. It looks like Z17911 and Z16855 are clearly public making upstream Z16343 public too.

And the rest is history – at least for my little branch of the YDNA tree.

Analysis of STRs Using the RCC Method

The RCC method may be somewhat obscure to some, but I find it very interesting. This method uses STRs to create trees of descent, like the SNP trees I showed above. As it uses STRs and not SNPs, it is helpful as a check to the validity of the SNP trees. The RCC method was developed by Bill Howard. In November 2014, Bill came up with the tree below based on 67 STR results. I was at the top of the list in that study of a relatively small group of people.

RCC 67

Note how this method mirrors today’s SNP tree:

L513 Tree Section

The RCC method show that Z16855 branched from Z17911 out of Z16343 at over 60 RCCs. For this 67-marker analysis, 1 RCC = 38.05 yrs. So that would be over 2300 years ago. The present year is considered as 1945-1950. Hartley shows as splitting from Merrick and Thomas at about 30 RCCs. That is over 1140 years from 1945 or around the year 800 A.D. As there were no surnames at that point, this would explain why Hartley, Thomas and Merrick could be in the same grouping. The closest RCC to Hartley at the time of this study was Gilroy. An RCC of 18 translates to 685 years. This brings us up to about the year 1265 A.D. Surnames in England were being sorted out around the 1400’s.

Here is my interpretation of the RCC 67 STR Tree with SNPs and dates added:

RCC 67

Assuming that the vertical line at RCC 30 represents Z17911, it appears that there is room for at least one other SNP on the Hartley Branch that includes Gilroy, Phillips, Vaugh[a]n and Griffin.

Comparing two Rcc studies (67 Vs. 111 Strs)

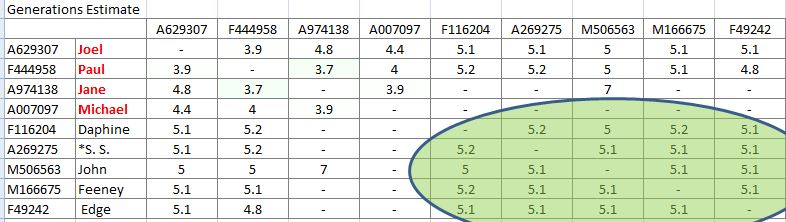
More recently, at the end of March 2016, Bill Howard ran the data for 555 L513 testees that had 111 STR markers or more. I have only tested for 67 markers, so I was not included, but there was one Hartley in that group. He does not show up on my match list as I count that I have a GD of 10 with him at the 67 STR level. This is beyond the match limit of 7 for FTDNA.

Here is the small section of the 555 that included the Hartley I mentioned above.

RCC 111

Now the vertical dashed lines happen every 20 RCCs. For this study, the RCC = 44.8 years. Mike Walsh, the Administrator of the L513 Project looked at this and felt that, based on his experience with SNPs, that the 44.8 may be a bit high and mentioned a factor of 34.65 years that he thought may work better.

Here is my interpretation of the 111 STR RCC Tree with dates and SNPs. One RCC = 44.8 years.

RCC 111

First, because there are fewer results at 111 STRs, this spreads out the branching. I don’t know who Pitt is. In the previous study Z17911 and Z16855 branched at about 490 B.C. Here, it appears to be in a similar location, I guess about 440 B.C. In the 111 Tree ZS849 branches off in the 1400’s Vs. the 1600’s in the 67 STR Tree. I would assume that the previous study could be slightly more accurate due more available results at the 67 STR level. However, the results are quite close to each other.

Historical 37 STR RCC Tree from September 2014

All these RCC Studies reminded me of a study done in the old days – back in 2014. At the time, I was amazed at how close Bill Howard got to the SNP tree with just using 37 STRs. At the time, I had recommended that the results of 21 L21’s be included in the study, but Charles was too quick in sending 14 L513 results to Bill Howard and Bill gave us this tree:

37 STR RCC Tree

Charles said that 1 RCC should equal 43 years. I’ll put what we know now onto the 2014 RCC tree.

37 STR RCC Tree

The main difference in the older study is that the Z17911/Z16855 branching is shown at a later date (A.D. Vs. the newer studies’ B.C. dates). Also there is an Evans in my group here. I’m not sure who he is.

So Which is Better, SNPs or STRs?

Most people tend to like SNPs over STRs. SNPs may be considered UEPs or Unique Event Polymorphisms. It is the unique part that makes them better. I like the way my L513 Administrator, Mike Walsh says it,

Some people say have used the words that SNPs trump STRs. That’s probably the correct general perspective. Assuming the specific SNPs considered are actually very stable Unique Event Polymorphisms (EUP), any SNPs that differentiate are most important and therefore provide fencing for which do additional evaluation using surnames, genealogy, geographies, etc. AND STRs.

STRs may back mutate, which is a hidden weakness in a way. Say that you have a perfect match with someone based on STRs. One of those STRs may have mutated and back mutated. This would mean that you are not a perfect match, but a GD of 2. There is not an easy way to know if that has happened or not. So that introduces some uncertainty. However, that is not to say that STRs are not important. I feel as they are underrated by many and should still be considered for the reasons I mention in this Blog and in the section below.

Summary, Conclusions and Comments

  • I’m looking forward to my BigY results to see what they may include
  • I am currently classified as Z17911 – a relatively recently discovered terminal SNP
  • By STR signatures, there appear to be 4 other Hartleys who would test positive for Z17911. These Hartleys should be encouraged to take the Z17911 SNP test.
  • I have used a similar method to analyze STRs and predict my own SNPs before I tested positive for them.
  • STRs are useful for determining relatedness to other STR matches using GD and FTDNA’s TIP Report
  • The TIP Report also gives an estimate to the Most Recent Common Ancestor for YDNA matches.
  • STRs are also useful in determining whether a new SNP is private or public using ISOGG guidelines
  • The RCC analysis is useful in creating STR trees and for confirming SNP trees
  • The RCC analysis can also give a time period for the branching of different SNPs and families.
  • STRs and SNPs complement each other


Slimming Down My Big Fat Chromosome 20

In a previous Blog, I mentioned My Big Fat Chromosome 20. I had discovered, for some reason, that more than one half of all my matches were on this Chromosome. This can be seen visually using a Swedish web site called dnagen.net.

dnagen circle chart

Here the default setting is at 200%. That means that only the matches that are twice as large as the median are shown. This program uses FTDNA matches. The match names are on the outside of the circle and the lines going between the names are what FTDNA calls ICW or (In Common With). I just noted today that there is a group on this circle that doesn’t connect with others at about 9 o’clock on the circle. These matches like to stay in their own Chromosome apparently. They are in a dark color which I take to be Chromosome 3. However, that is an aside.

The real point is to show Chromosome 20 in the dark green in the lower right half of the circle. Chromosome 20 is the Hong Kong of Chromosomes. In a little space, I have  lot of matches. Remember that Chromosome 20 is one of the smaller Chromosomes. If I have about 4,000 matches, that means that over 2,000 of them are on Chromosome 20. In my previous Blog on Chromosome 20, I determined that these matches were on my Frazer grandmother’s side. Her 2 parents were born in Ireland. That means that these matches represented Irish matches and not Colonial American matches as I had previously assumed.

The Progression of Sorting Matches

Autosomal DNA matches may be grouped in different ways. When I first tested, I got a bunch of matches at FTDNA. I didn’t know who any of them were. FTDNA had suggested some relationships which were mostly optimistic. Here is some of the progression of how I have sorted my matches:

  1. Sorted by projected relationship or match level (cMs)
  2. Sorted by actual relationship if known
  3. Sorted by Chromosome. This option is not available at AncestryDNA. One has to upload the AncestryDNA results to gedmatch for this option. This is when I discovered all my Chromosome 20 matches.
  4. Sorted by Triangulation Groups. By using a Tier 1 option at Gedmatch or by finding by hand all the matches that match each other at a particular segment, I was able to find many Triangulation Groups (TGs)
  5. Sorted by Maternal or Paternal. All our valid DNA matches should match on either the maternal or paternal side. Once I tested my mother, I was able to phase my results at gedmatch and find out whether I matched other testers on my mother’s side or my father’s side. This was a big breakthrough for me. This cut down a lot of frustrating searches. For example, there are a lot of people that match my mother that have Frazer or Fraser ancestors. My Frazer ancestors are on my father’s side. Therefor, I knew that when looking for Frazers, I could eliminate all my mother’s matches who had them as ancestors and not worry about them.
  6. Sorted by other known matches. I had my father’s 1st cousin tested. This got to the level of my great grandparents on my Hartley side. However, it didn’t tell me which great grandparent. My Hartley great grandparent was a relatively recent immigrant from England. My non-Hartley great grandparent had ancestors going back tot he Pilgrims in Massachusetts. I also had other relatives tested and found other matches that I knew I was related to.
  7. Another breakthrough happened after I had my 2 sisters tested. I used a method by Kathy Johnston to find out where you got all your DNA from your 4 grandparents by comparing your DNA results to 2 siblings. This method worked pretty well on most of my chromosomes. Now I knew where the DNA was coming from at my grandparent level for most of my matches. When I had a match, I could check my map to see which grandparent that match belonged to.

That is about where I left it at my last Blog on Chromosome 20. I looked at my crossover points for Chromosome 20. Here are my sisters compared to each other and to me:

Chr 20 Crossovers

Here is how I used the above comparison to map my grandparents that gave me my Chromosome 20 segments. The blank parts are half identical and ambiguous, so rather than guessing, I left them blank. For example, on Sharon’s row on the top, either the orange goes to the left and blue starts at the lower half or the opposite: the purple continues to the left and the green starts at the crossover line.

Chr 20 Final Segment

My chromosome 20 is on the bottom. At the time I wrote my previous Blog on Chromosome 20, I discovered that the vast majority of my matches were due to my Frazer side (green) and not my Hartley side (orange). This was a surprise as my Hartley grandfather had a mother with American Colonial roots. The final point of my previous blog on the subject was:

The fact that all these matches are on my Frazer line doesn’t necessarily mean that they are Frazer matches. They could be McMaster, Clarke, Spratt or any other known or unknown ancestor of my Frazer grandmother.

It’s great that I now know that most of my Chromsome 20 matches are Paternal and that they are on my Frazer grandmother’s line. But I am still curious as to where they are coming from. Can I find out more? I would like to try.

Chromosome 20: Beyond Grandparents

One advantage I have is that I am working on a Frazer DNA project with 27 testers. There are 2 lines of Frazers. I am on the Archibald Line and there is another line called the James Line. These 2 lines are somewhat distantly related as these 2 brothers were born in the early 1700’s. Here are the matches for the project on Chromosome 20:

Chr 20 Matches

All of these matches involve at least one James Line tester which I am not on. The 2 major matches between the Archibald Line and James line are between myself (JH) and my sister (SH) on the Archibald Line and Bonnie (BN) on the James Line. As I show below, even my McMaster Line has Frazers in it, which could be the source of that match. Sharon had very few Chromosome 20 matches compared to her siblings Heidi and myself. The 1,000 plus matches I had were before the 47 million mark where I match Bonnie above. My mega-matches mostly occur on Chromosome at 44,000,000 (End Location) or before. This tells me that my mega-matches are not of the Frazer surname. If they were, I would have seen some of my closer Archibald Line matches on Chromosome 20 from the Frazer DNA Project.

Enter cousin paul

Paul is my second cousin once removed who tested for DNA. His great grandparents are my 2nd great grandparents: George Frazer and Margaret McMaster.

George Frazer Tree

When I compare myself to Paul, I get to either the Frazer or McMaster Lines. This will eliminate the Clarke line of my great grandmother and her Spratt mother as they are not in Paul’s line – only mine.

My McMasters: It’s a Bit Complicated

Here is my McMaster Line going back from my Frazer grandmother.

McMaster Ancestry

Not only did 2 McMasters marry each other, one of them had a Frazer mother! Marion Frazer is my grandmother, so she is 2 generations from me. Margaret McMaster is at 4 generations. James and Fanny McMaster are at 5 generations to me. Their parents (the left-most McMasters above) are at 5 generations out from my cousin Paul and six generations from me. This is useful to know in the Generations Estimate I have below.

Here is where the Frazer/McMaster split is.

Frazer Buggy

George Frazer b. 1838 is on the left and Margaret McMaster b. 1846 is on the right. The photo was taken in Ballindoon, Ireland in front of the Frazer family home.

At Gedmatch.com, I compared Paul and myself at:

People who match one
or both of 2 kits
Updated

I chose most of those that matched both Paul and me. I left out an apparent duplicate and one who is anonymous for now. I also left out my 2 siblings. With those results, I chose the Traceability option and got this chart:

Generations Paul Joel

Those in red are in the Frazer DNA Project. We know their genealogy. Gladys descends from the couple above George Frazer and Margaret McMaster. Michael and Jane descend from one level above that. The circle above are those that are related to Paul and me, but not to others in the Frazer DNA Project. [One exception is Jane, but she matches at generation 7 which is about as far out as Gedmatch goes. This may or may not be a real match.] If those in the circle are not Frazer, then the apparent conclusion is that they are McMaster relatives.

Back to chromosome 20

See all the Chromosome 20 matches on my Gedmatch Traceability Report:

TG Chart Chr 20

Remember I said that my 1,000 plus matches on Chromosome 20 ended around 44M? This is what the above shows. It also shows a triangulation of matches. This triangulation is also implied by the cluster of matches within the circle of the Generations Estimate Chart above. The Chromosome 20 Triangulation Group (TG) includes:

  • Myself
  • *S. S.
  • Daphine
  • Feeney
  • Gladys

Now Gladys should not be in this list as she is in the Frazer DNA Project and has no known McMaster ancestors. In fact, when I run the ‘one to one’ at Gedmatch, she doesn’t match the others in the above list. There are glitches in the Traceability Report, so caution is needed. I will take out the last 3 names in the Generations Estimate to simplify the results. Unfortunately, that didn’t fix the problem, so I had to take out Gladys from the Frazer Project (sorry Gladys).

Gen Est Paul Joel

Now my presumed McMaster relatives are in the green circle. Here are the improved and simplified matches:

TG Chart Chr 20

I note now that the 2 ‘M’ kits (indicating 23andme testers) are now matching each other which is what I had expected previously. Note that I left my previous Traceability results in the blog as a warning that the Traceability utility is glitchy. Actually the new report is not indeed improved as now Michael from the Frazer project is matching my presumed non-Frazer McMasters. I took out Michael, and then Jane from the Frazer Project developed similar bogus matches with those she is not related to!

I’ll have to take out all the other Frazer Project people out for this Traceability to work. This was supposed to have worked so smoothly. Here below Joel and Paul should be the remaining McMaster relatives:

Joel Paul R3

Here is the Chromosome 20 TG. Note that Paul is not in it, but he matches others from the TG in other Chromosomes:

TG Chart Chr 20

This chart is only mostly right. Paul’s green match is actually on Chromosome 19 rather than 15:

Paul's Actual Match with Edge
Paul’s Actual Match with Edge

Here is the globe view of my proposed McMaster relative TG:

McMaster Globe

The colors in the lines correspond to the colors in the chart above. The light blue lines are the Chromosome 20 TG from my “big fat” area. The blue lines indicate a TG as they go from each of six people to the other 5. The gray lines represent multiple matches. I am at the bottom of the globe and my cousin Paul is to my right. He is not in the blue TG on Chromosome 20, but matches all my matches on other chromosomes at least once.

Conclusions and Further Research

From what I have shown above, I feel like I have found my McMaster relatives through DNA. However, these would have to be verified by genealogy. None of my proposed ‘McMasters’ have any gedcoms at gedmatch.

  • Daphine – she is on FTDNA but with no tree and no ancestors mentioned. An ICW search reveals 59 pages of matches – likely mostly on Chromosome 20.
  • Edge – He is at FTDNA. He has a limited tree. His paternal grandmother may be a lead. He has only 52 pages of in common matches at FTDNA
  • John – A search at 23andme showed nothing. Perhaps he is anonymous there.
  • Feeney – Same result – or perhaps these people are using different names?
  • *S.S – I see an S.S at Ancestry, but it is difficult to tell if it is the same person.

I have McMaster connections through DNA and genealogy at AncestryDNA, but there is no way to tell if the connection is on Chromosome 20 without a chromosome browser. My Mcmaster matches at AncestryDNA either don’t know how to upload their DNA to gedmatch, aren’t interested or haven’t gotten to it.

Opposition to TGs

Of late, on Facebook, there has been questioning as to the validity of  TGs – especially large TGs like I have at Chromosome 20. The thought is that no common ancestors will be found as there are just too many common ancestors in these large TGs. I have not explained the 100’s of matches in my Chromosome 20 TG, but I have shown 5 people that match both myself and my cousin Paul. These 5 by DNA do not have obvious Frazer ancestry and appear to be in my McMaster Line. So I suppose we have a stalemate. I cannot prove at this time (except to myself) that my Chromosome 20 TG matches are McMaster relatives and those who are not in favor of large TGs cannot prove that these matches are not McMaster relatives.


Mapping My DNA To My Four Grandparents

I was thinking of calling this Blog “Kathy Meet Kitty“. Kathy is Kathy Johnston who taught me how to map my ancestral segments by comparing my DNA to two of my siblings’ DNA results and determining our crossover points. The crossover points can then be used to map out which grandparent you got your DNA from without having to physically test those grandparents. This is quite convenient as all my grandparents have been gone for quite a while. Kitty is Kitty Munson who has developed a Chromosome Mapper here. I have not seen a blog using Kitty’s Chromosome Mapper to map ancestral DNA segments via Kathy Johnston’s method, so I thought that I would write one. Kathy’s method is posted here.

Two Types of Segments

There are two types of segments, thus at least two types of segment mapping. This concept is best explained at the Segmentology Blog in an article appropriately called, What is a Segment?

ancestral segments

That Segmentology article first mentions ancestral segments. These are the segments that Kathy Johnston knows how to map. I have written many blogs about mapping my ancestral segments using her method. Ancestral Segments are the segments that you actually get from your ancestors. They fill up all your DNA. Here is an example of the ancestral segments that I have mapped to my four grandparents.

Joel Segment Map

Look at Chromosomes 1, 5, 6 and 7 for starters. This shows all my DNA filled in. The 2 paternal grandparents are on the top half of the chromosomes in blue and grean and the maternal two grandparents are on the bottom in red and peach color. The DNA I received alternates between one grandparent and another and fills in all the area. In fact, that is the process of recombination and can be seen in the Ancestral Segment Maps.

shared segments

These are segments that you find at gedmatch.com for example. These are our DNA matches. These matches may have a proposed relationship based on how much DNA you and your match share. Here is an example of some of my matches using Kitty’s Chromosome Mapper.

Chromosome map 4 Apr 2016

The best way to fill in a map like this is by testing as many relatives as possible. Now look at chromosome 1, 5, 6, and 7 on the shared segment map compared to the ancestral segment map above. The ancestral segment map on Chromosome 1, for example,  shows how much DNA I actually got from my Hartley grandfather. The blue in the Shared Segment Map shows how much I matched my father’s cousin. Next look at the maternal (bottom) part of Chromosome 1. Here the Rathfelder and Lentz matches on the right hand side are filled in on the Ancestral Segment Map. However, there is an additional section of Lentz on the left hand side of the Ancestral Segment Map where I don’t even have a match. I can tell I got my DNA there from my Lentz maternal grandmother. That is due to the crossover points I have and the fact that the DNA you get from your grandparents alternates between grandparent. On the maternal side, the alternation is between Rathfelder and Lentz.

If you find any inconsistencies between my Ancestral Segment Map and my Shared Segment Map, that means I messed up somehow.

More Ancestral Segment Mapping: Sister Heidi

In order to map my ancestral segments, I needed two siblings, so I used my two sisters, Heidi and Sharon. Here is Heidi’s ancestral DNA mapped out:

Heidi Segment Map

A few observations:

  • The areas of pale blue are where I had trouble figuring out how to map the ancestral segments, so nothing is mapped in these areas. I may have mapped out some of the segments, but then had difficulty telling whether they were maternal or paternal due to lack of known cousins that had tested. So I left these areas blank
  • The maternal areas shown as MG1 and MG2 – For these areas, I knew I had two maternal grandparents but I wasn’t sure which was which. Again based on lack of known cousins that had tested. I could perhaps guess, based on actual matches I had in these segments or where those matches were from, but I noted where the crossovers were and left these grandparents un-named.
  • These unknown grandparents are consistent within each chromosome and each sibling within each chromosome, but they are not consistent between chromosomes. So the unknown MG2 in Chromosome 8 may not be the same MG2 in Chromosome 11.
  • In my (Joel’s) Ancestral Segment Map, I don’t show any DNA on my paternal side for the X Chromosome. That is because males don’t get an X Chromosome from their father.
  • Heidi shows that she got her paternal X from her dad’s mom – a Frazer. Further, that chromosome did not appear to recombine. That means that she got that whole chunk from one of her great grandparents on the Frazer side.

How Do You Know What You Are Finding If You Don’t Know Where To Look?

These maps are very helpful in showing you where to look for DNA. Many people have matches that have ancestral names that are common to us but are not related. For example, my mother has matches with people that have Fraser or Frazer ancestors. I am related to Frazer on my father’s side. That means that I can forget about following up on maternal Frazer matches.

  • If I do want to look for Frazers, I need to look in my green areas (or my sister’s green areas) which is on her paternal side.
  • My sister Heidi is in an important Frazer Triangulation Group on her Chromosome 1 on the right hand side. She triangulates with others in a Frazer DNA Project I am working on. I am not in that group. Look at my Chromosome 1. It is nearly all covered by Hartley DNA. That explains why I don’t match these other Frazers at standard thresholds.
  • What if we were to want to look for Lentz ancestors of Heidi? We need to look at the red areas. Chromosomes 1, 6, 9. 14, 20, and 22 would be a good place to look. Fortunately, I also have Heidi’s matches on a spreadsheet. They are mostly divided by maternal and paternal matches. My mother has been tested for DNA. Based on that, I have Heidi’s phased maternal and paternal results and her matches to each of those results using Gedmatch.com.

Finally Sharon

My sister Sharon completes the Ancestral Segment Mapping:

Sharon Segment Map

  • The autosomal DNA that is missing on Sharon’s Map is the same for her 2 siblings. This is because Kathy Johnson’s ancestral segment mapping technique compares the siblings to each other using the Gedmatch.com chromosome browser.
  • Sharon has a lot of Frazer DNA match potential at Chromosomes 1, 8-12, 15, and 22.
  • However, Sharon is also not in the Frazer Triangulation Group in Chromosome 1 on the right hand side. In that particular section, she got her DNA from her Hartley paternal side.
  • The above point shows why it is important to test siblings.
  • Heidi and Sharon both have a large match (50+ cM) with someone on their X Chromosome. This person also has autosomal matches with my sisters and others in the Frazer DNA project.

Summary and Observations:

  • Ancestral Segment Mapping can be useful in determining which grandparent your matches match.
  • I know already whether my matches are on my maternal or paternal side. However, this goes back one more generation and further sorts my matches to grandparents. This cuts down the guessing by another half.
  • The maps also point out the areas where you can’t be as sure as to which grandparent your matches match as those areas are not mapped yet.
  • Ancestral Segments should line up with Triangulation Groups
  • Ancestral Segment Mapping can show matches that are Identical by Chance (IBC) or false matches.


My Big Fat Chromosome 20

I never would have guessed 10 years ago that I would be blogging about my Chromosome 20. 10 Years ago I was definitely interested in genealogy, but knew virtually nothing about DNA. Even if I did know anything about DNA I would not have guessed that it would have anything to do with genealogy.

My Chromosome 20

My Chromosome 20 actually isn’t that big and fat. Actually it is one of my smallest chromosomes. However, I have more matches there than on any other chromosome. In fact, over 1,000 – more than a quarter of my matches – are on Chromosome 20. This is pretty amazing considering I have 23 chromosomes counting my X Chromosome. If my matches were spread out evenly over these 23 chromosomes, I would expect each chromosome to have about 4% of my matches. This representation shows the ridiculous number of matches I have on Chromosome 20. They are on the bottom of the image in light blue.Joel Hartley Circle Chart

This particular representation is for just my FTDNA Family Finder matches. I believe the threshold was set relatively high and this was done a while ago. However, at the time and threshold, it appears that more than half of all my matches were at Chromosome 20.

How To Explain All the Matches? Colonial Massachusetts?

I had a difficult time explaining all the matches I had on Chromosome 20. Most were on my paternal side as that is where most of my matches are. I had guessed that these may have been due to a colonial effect as that had been suggested in various places. My great grandmother’s mother was a Bradford and was descended from the Mayflower Bradfords. A lot of those early Pilgrims married other related Pilgrims. In fact, some of my Chromosome 20 matches were descended from a Brewster who was one of the Pilgrims that I am also descended from. Then there were a few who seemed to be related on my Irish Frazer side. Finally I had a match with Bonnie from the Frazer DNA Project I am working on. She matched on Chromosome 20 but was outside my large triangulation groups.

Chromosome 20 Triangulation Groups

I also have Triangulation Groups (TGs) for Chromosome 20 – very large ones. In fact, gedmatch would overload when I tried to run an analysis I had so many. I have 2 paternal TGs and one maternal TG. There also may be sub-TGs within those.  I have roughly 650 matches in these combined TGs. So now, based on testing my mother, I knew if my matches were maternal or paternal and if they were in TGs, but I still didn’t know much about where the common ancestors could be other than a vague guess about colonial Massachusetts. What I did was ignore Chromosome 20. I gave up even adding matches to my spreadsheet because I had so many. These matches tended to be around 13 cM with some higher and some lower.

Sticky Segments Or Pileup Areas?

While looking for a Chromosome 20 explanation, I read about sticky segments and pileup areas. Sticky segments are those that came down intact for many generations. They don’t want to go away. However, a few sticky segments wouldn’t explain over 1,000 matches. It seemed like I had a pileup, so I looked into those. Pileup areas are areas are described by Jim Bartlett in his comment on one of his blogs:

I do find that each person tends to have two kinds of pileup areas: 1) are fairly narrow, are widespread, and are outlined in this ISOGG article: http://isogg.org/wiki/IBD#Excess_IBD_sharing; and 2) are also fairly compact (7-9cM) and are unique to each person. I believe these are caused by a unique set of markers in our personal DNA that makes it easy to form matches with others in that region. These are characterized by many segments in a narrow range, which do not generally Triangulate, and the Matches don’t see this as a pile-up area, only you do.

However, my case didn’t seem to match some of the explanations of sticky segments or pileup areas. My matches were larger and did triangulate. Furthermore, they were not in areas of the chromosomes described in the ISOGG article above.

Enter Kathy Johnston and Her Crossover/Segment Analysis

At the beginning of 2015, Kathy posted her instructions on an FTDNA Forum for analyzing DNA based on the 3 siblings. She showed how to determine the 4 grandparents’ contributing DNA for each of these siblings.  I discovered her post at the end of 2015. Could this help me figure out my Chromosome 20? I tried Kathy’s method and got some surprising results.

Finding Chromosome 20 Crossover Points

Finding crossover points in Chromosome 20 was not as easy as it has been in other chromosomes. According to Kathy, usually there will be one owner of a crossover point. This owner will appear in 2 out of the 3 comparisons at a crossover point. In this one, I found only one clear owner. That was my sister Heidi at position 47. For the other ambiguous crossover points, I gave a double initial separated by a slash.

Chr 20 Crossovers

Below, the gedmatch comparison is transformed into a maternal/paternal Chromosome 20 map. The green area means that Heidi matches Joel on the 3rd segment. This match is a Fully Identical Region (FIR). This means they match the same maternal grandparent and the same paternal grandparent. For Joel, I move those grandparent to the right as I have no crossovers until the last crossover point.

Chr 1 Segment 1

Sharon has no match with her 2 siblings in the same area, so that will mean she shares the complementary grandparent on her maternal and paternal DNA. This will be represented by 2 different colors. I again extend that double segment to Sharon’s crossover points.

Chr 1 Segment 2

Looking at the earlier gedmatch comparison, in the 2 segments to the right of Heidi’s existing mapped segment, there is a Half Identical Region (HIR). That means a grandparent matches on one chromosome and doesn’t match on the other. This will be shown as 2 different colors in this area when comparing Heidi to Joel. This first HIR choice is chosen randomly as no names or side (maternal/paternal) have yet been assigned to the grandparents.

Chr 1 Segment 3

Next, we have an illogical situation.

Chr 20 Crossovers

In the next to last segment, the smaller one, Sharon is no match with Heidi or Joel and Heidi and Joel have a half match. That is illogical because if Sharon doesn’t match with Joel, that is the same orange/purple scheme continued in the small segment for Sharon. Then if Sharon and Heidi are opposites, it goes back to green/blue for Heidi in that small segment. Those are the same colors that Joel already has, so that means that Heidi and Joel can’t be HIR which means they should have one matching color and one non-matching color. However, look at that small segment again in the first two rows. The red is strong in the first row. In the second row, I hardly see any red – with red indicating no match at gedmatch. Therefor, I’m going with the first comparison of Heidi and Sharon. Plus this goes with the matches that I will mention soon that Sharon has. I make Sharon and Heidi opposite in Sharon’s little segment and extend that segment to the end.

Chr 1 Segment 4

I filled in some of the no matches and FIRs on the right. On the left, I was left with 2 illogical no matches again, so I chose the redder of the 2. This left me with having to guess a HIR on the left. I am only allowed one guess, so I left this blank for now.

Chr 1 Segment 5

Adding Real Grandparents

It would be nice to add actual grandparents here and not just speak of my orange grandparent, for example. I can do this using two of Sharon’s matches.

Sharon's Chr 20 Matches

These 2 important matches Sharon has are both on the paternal side. James is related to my grandfather and Bonnie is in the Frazer DNA Project on my Frazer grandmother’s side. Coincidentally, the orange match above goes with the orange on my chromosome map. That would make my paternal grandfather Hartley orange and paternal grandmother Frazer green.

Joel’s Matches

Here’s my Frazer match with Bonnie. 47 to 54 is in my green Frazer region on my map. So that is a relief.

Joel's Frazer 20 Match

Below is my only maternal match. It is with a cousin on my maternal grandmother’s line. She matches only with me because she tested at 23andme and hasn’t uploaded to gedmatch yet.

Joel match Judith 20

However, Judy gets me unstuck on my maternal side. Her match is telling me that from zero to 8, I can identify my grandparent. I already have blue from 6 to 8 (from using my brighter red logic). So I just need to extend the blue all the way to the left on my maternal segment line. That gives me a solid blue on Chromosome 20 on my maternal side.

Chr 20 Final Segment

This is as far as I can figure out now without further guessing. Perhaps when cousin Judy gets her DNA uploaded to Gedmatch, I will know more. So what does this tell me about my 1,000 plus Chromosome 20 matches and 600 plus matches that appear to be in Triangulation Groups?

Mystery Solved?

I think it is. These matches correspond to the area on the map above between 16 and 49. By the above mapping these massive amount of matches are solidly in Frazer territory for me. Instead of my huge block of matches being in colonial Massachusetts, I see that they are on my Frazer line. That came as quite a surprise. These ancestors were in Ireland mostly. I assume that many of these ancestors got out of Ireland. Perhaps they moved to the United States and married people who were descended from colonial Americans. That would explain some of the other colonial matches.

Summary, Application and Conclusions

  • When you are looking for DNA matches, it helps to know where you are looking
  • While I was looking at my largest group of matches, I was looking in the wrong place even though I had some reasonable assumptions
  • Kathy Johnston’s method cuts through bad assumptions and replaces them with sound logic
  • Phasing by parents cuts the looking in half but didn’t help me with identifying a huge block of Chromosome 20 matches. However, Kathy Johnston’s method is twice as good as phasing as it separates all matches to areas of 4 grandparents.
  • This method needs 3 siblings and some known tested relatives.
  • If I have this mapped correctly, any maternal match after 6 million for Sharon will be on the Rathfelder line and any maternal match for me will be on the Lentz line.
  • Interestingly, I have only about 42 matches for my sister Sharon on this Chromosome. Given that the makeup of her Chromosome 20 is mostly opposite of her 2 sibling, this makes a lot of sense.
  • I forgot to mention that my sister Heidi has almost as many matches as I do on Chromosome 20. Her shorter Frazer segment compared to mine would explain the slightly fewer matches.
  • The fact that all these matches are on my Frazer line doesn’t necessarily mean that they are Frazer matches. They could be McMaster, Clarke, Spratt or any other known or unknown ancestor of my Frazer grandmother.


How I Lazarus’ed My Dad

According to the Gospels, Lazarus was a man who died and Jesus raised him from the dead.

lazarus

Lazarus is also a program on Gedmatch to recreate the DNA of those who are no longer with us. You won’t see this unless you kick in $10 for the Tier 1 Utilities. The Link says, “Lazarus, Create surrogate kits to create close ancestors.”

How I did it: first I practiced on my wife’s family.

Fortunately, my wife’s dad has 2 first cousins and one second cousin on his mother’s side who have had their DNA tested. This came in handy. So I went about to create my father in law’s mom, Estelle LeFevre. Lazarus takes Group 1 people who are descendants of the target person to be Lazarus’ed, Estelle. In my case, the descendant was my father in law. I had him tested a while back at FTDNA. Then the program takes relatives who are not descended from Estelle. In this case, Pat and Joe who were the 1st cousins and Fred the 2nd cousin of my father in law. Those three are Group 2. Lazarus takes Group 1 and Group 2 and mushes them together to recreate Estelle. Actually only a part of Estelle is recreated. That is the part of Estelle that was mushed together from Group 1 and Group 2. If I had all of Estelle’s children and all of her relatives, I would’ve had a much more complete result. The trick is to get a Lazarus result that is over 1500 cMs. Then you can use some of the other utilities at Gedmatch with that kit such as the One to Many. It’s OK to create a Lazarus kit with less than 1500 cMs but it’s not as useful. Well, Estelle came out at about 1700 cMs, so that was good news. Buoyed with these results, I thought it would be a good idea to try to recreate my dad’s DNA.

A Slight Detour

I followed the Gedmatch directions. I took two Group 1 people. That was me and my sister. Then I took for Group 2, the only relative of my father that I had tested, his 1st cousin. I ran the program and came up with only about 700 cMs. Very disappointing. Then, as I’ve been working on my father’s mother line, the Frazers, I thought, ‘my father’s cousin isn’t related to the Frazers. He’s only related to my Hartley side’. Duh. What I had created was a Lazarus of my father’s dad, my Grandfather.

My Dad and His Dad
My Dad and His Dad

Sometimes I don’t mind making mistakes. Especially when they lead to the right answer.

How I did it the right way

Well, how was I to get up to 1500 cMs, when all I had was 700 cMs from my grandfather’s side? I only had 2 people for Group 1. I’m too cheap to have other siblings test. I noticed that Gedmatch had room for 100 people. Hmm, where to get 100 people? From working with my distant Frazer relatives, I knew I had their results, but this wouldn’t get me the numbers I needed. So I decided to use the phased matches of my sister and I. What is phasing, you may ask? Phasing is another utility that Gedmatch has. If you know the results of one parent, Gedmatch will subtract those out from your whole results and create 2 kits. One is a maternally phased kit of matches on your mom’s side. The other is a phased paternal kit of your matches on your dad’s side. Fortunately my mom is still alive at 93 and I had her tested. Based on her testing, I had already created phased maternal and paternal kits for myself and my sister. Now all the gedmatch matches are marked either P for Paternal or M for Maternal on a spreadsheet that I keep. I have one spreadsheet for myself and one for my sister. So I took a bunch of the top paternally phased matches from my matches and my sisters matches. I put in 100 of those top matches into the Gedmatch Lazarus Utility under Group 2. I ran the Lazarus program and got just over 1500 cMs for my dad.

Is This the Best Way to Create a Lazarus Kit?

I don’t know. It was certainly much more difficult than when I Lazarus’ed my father in law’s mom. For her, I only used 4 people and got better results. However, if you are cheap like me, or aren’t, but just don’t have the people to test, you might want to try this method and see if it works for you.

Joel Hartley