Ancestry AutoClustering Back in Action

I noticed that the Genetic Affairs Facebook site had a recent post. They said that as a Christmas present Ancestry AutoClustering was back in operation with some new controls to limit problems with the autoclustering. Ancestry AutoClustering has been popular. That is because AncestryDNA has the largest database of DNA-tested people but they are lacking in analytical tools.

My AncestryDNA AutoCluster

When AutoCluster first came out, I tried it at the low default settings. I wrote a Blog about those results here. Here are my annotated results:


I was impressed with the results and even though my clusters were small based on the default parameters, I liked the simplicity of the five clusters.

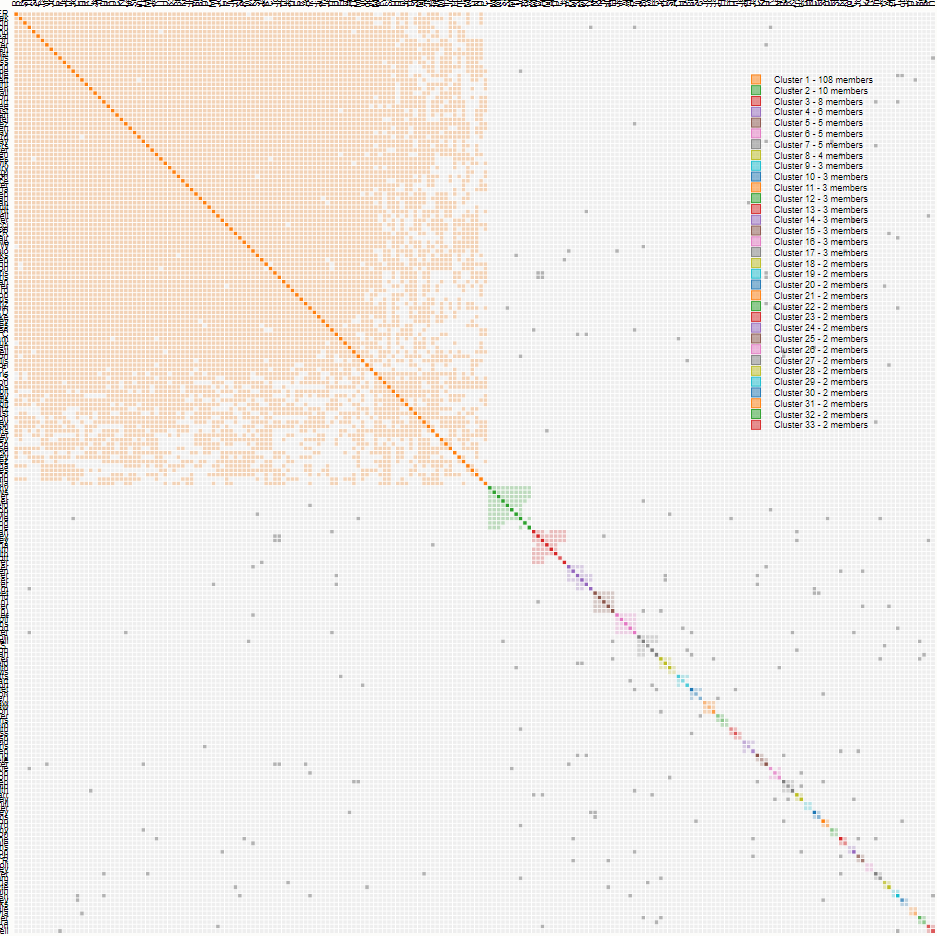
Here is my latest try at autoclustering. Now I used defaults that were 600 cM on the high end and 9 cM on the low end:

Now I have gone from five clusters to 76.

My Genealogy and Deciphering Some of the 76 Clusters

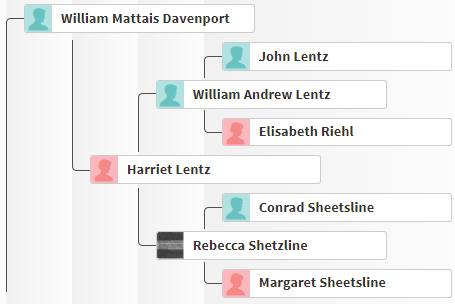
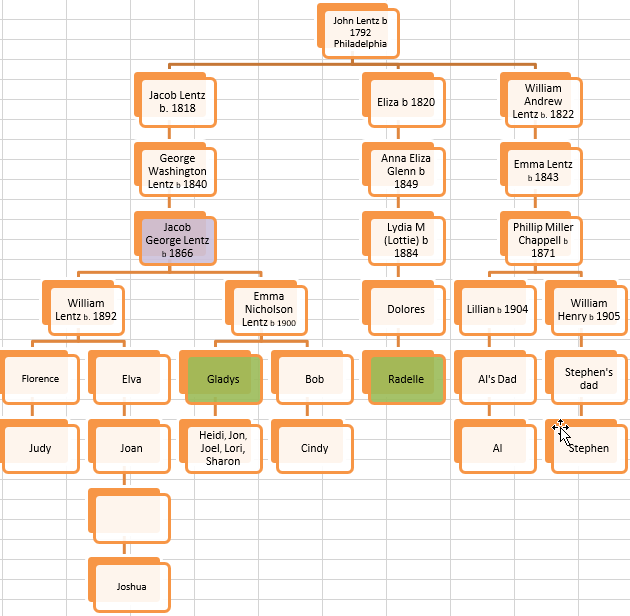
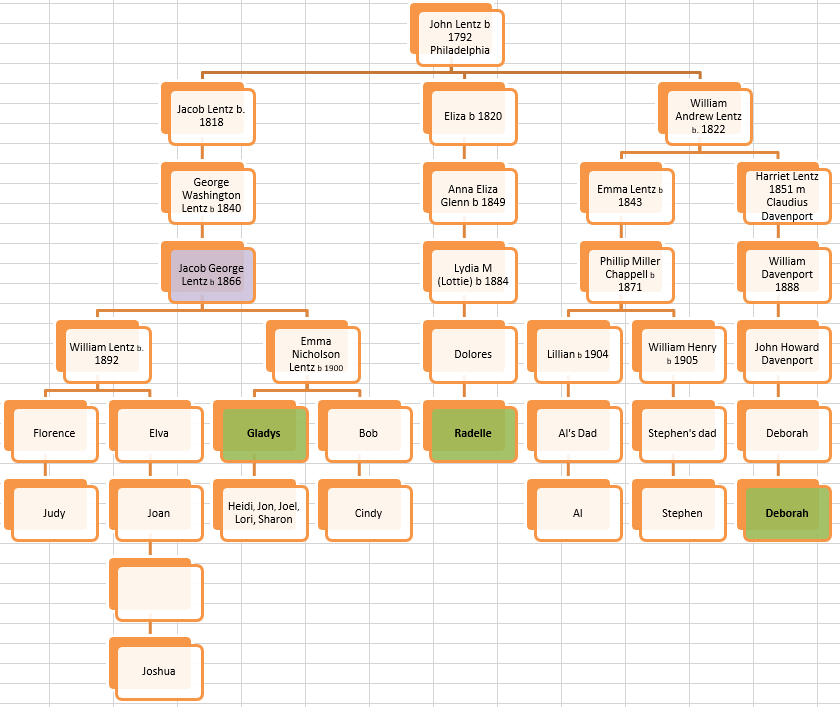
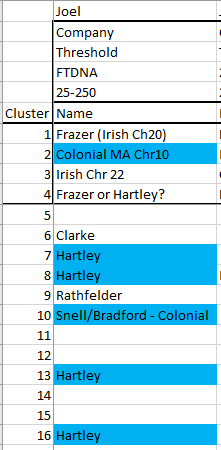
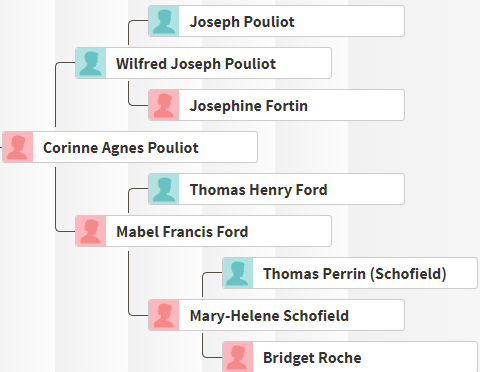
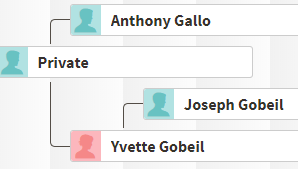
This tree goes to 16 branches. I suspect that 76 branches could go back at least two or three more generations than above. I have a lot of Hartley relatives as my great-grandparents had 13 children. My great-grandmother Snell had colonial Massachusetts ancestry. That means that I have a lot of 2nd cousins.

My Hartley 2nd Cousins

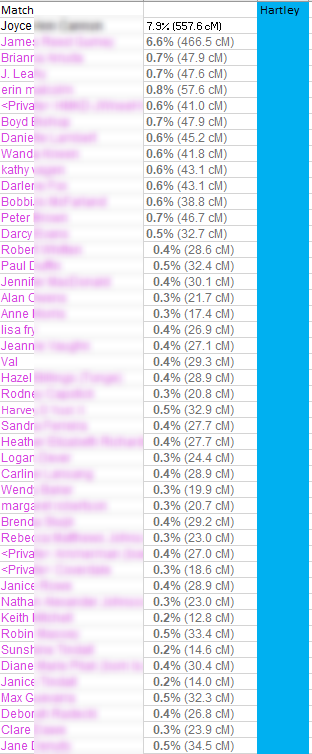
My Hartley 2nd cousins are not found in Cluster 1, but in Cluster 4:

These are my top 13 clusters. In my previous analysis, the present Cluster 4 was #1. By expanding the matches out to more distant matches, the new Clusters 1-3 beat out my former #1 Hartley 2nd cousin Cluster. Along with my 2nd cousins in Cluster 4 above are a few more distant cousins.

Massachusetts Colonial Ancestors – Cluster 1

Cluster 1 appears to include many of my more distant Colonial Massachusetts ancestors going back past my Hartley side. My closest match in Cluster 4 is my father’s cousin Joyce. My closest match on Cluster 1 is Jonathan – a relative of Joyce. Previously, Jonathan was in my old Cluster 1 also. Now he is a ringleader for my Colonial matches.

Other than Jonathan, I cannot pinpoint exact common ancestors for matches in Cluster 1 at this point.

My Largest Matching Clusters

Next, I am going to change my strategy. I will now sort by match on my Cluster List:

I clicked on the cM button until the arrow was pointing down. This gives me the clusters with the largest matches. Hence, the matches that I am likely to know about. The highest matching cluster is #4. #12 is the 2nd highest match. That is because it includes my 1st cousin’s daughter (on my mother’s side). That means that Cluster #12 could be either on my mother’s mother’s side or my mother’s father’s side.

The next Cluster by size is #1 with Jonathan.

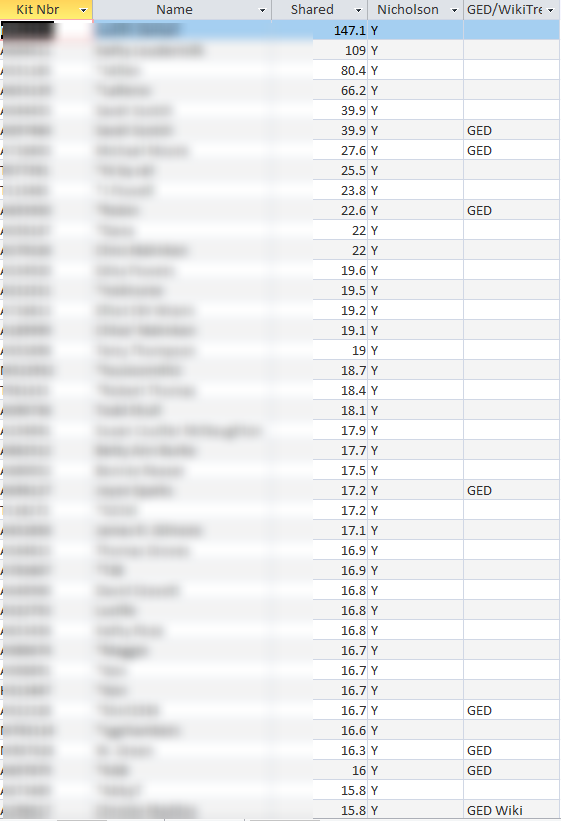
Cluster 16 – Nicholson

The next cluster by size goes off my present image, so I will need to ratchet down the image. Cluster 16 has only nine people in it, but I have been in touch with many of them. The known people in this group descend from William Nicholson and Martha Ellis:

Cluster 27 – Clarke

Cluster 27 is important to me. Clarke is my largest brick wall. I will have to go down yet another level for Cluster 27.

I’m starting to use the Key for these higher number clusters.

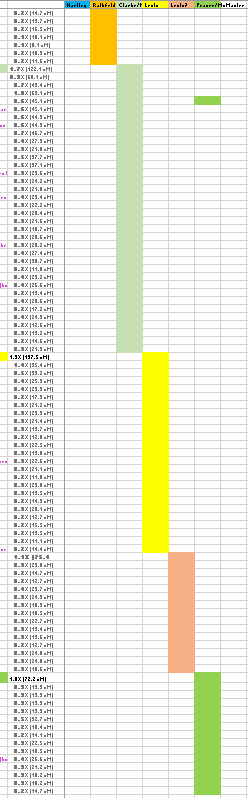
My Top 23 Clusters by DNA Match Level

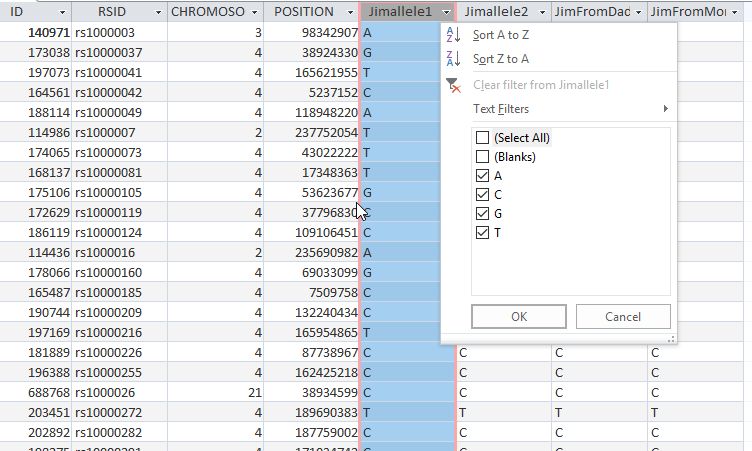
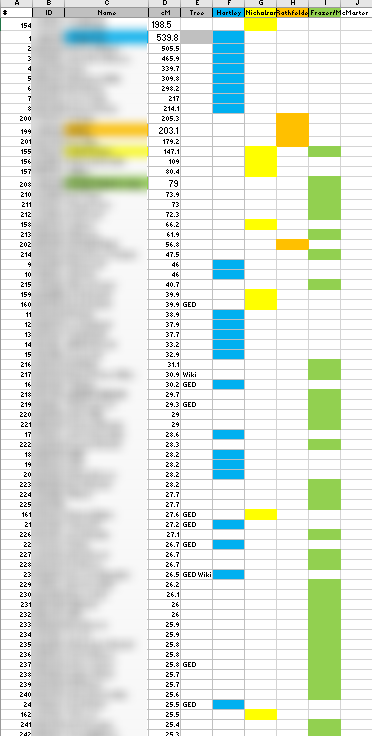
Here are my top clusters by match level in a spreadsheet:

This shows that the highest matches are on the paternal sides and on that paternal side, most of the matches are on my Frazer grandparent side.

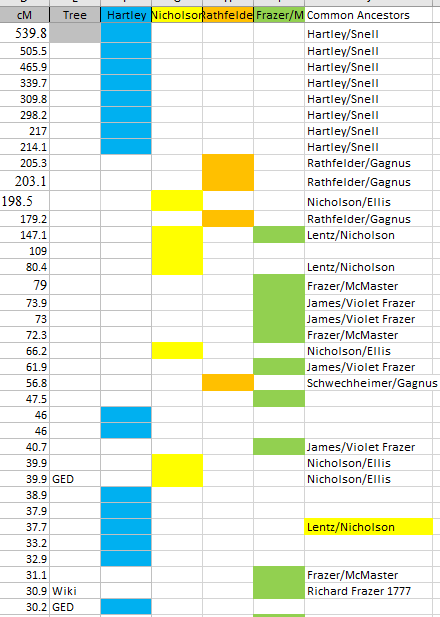
I can also sort by cluster:

This shows that I am missing Cluster 3 even after looking at my top 23 clusters.

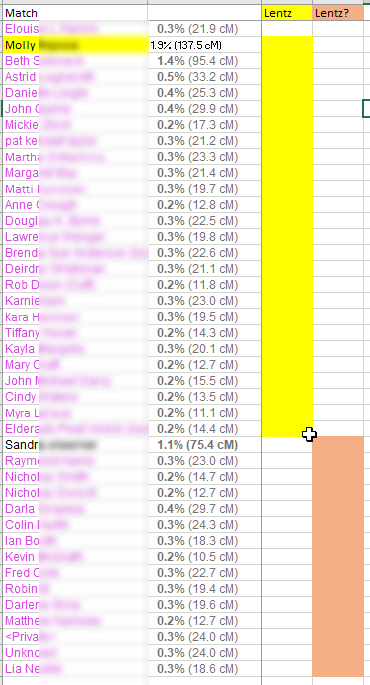
Cluster 3 – Mom’s Side

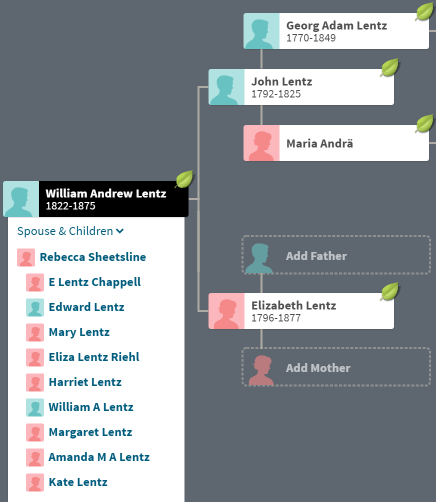
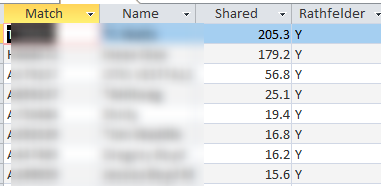
That makes me curious about Cluster 3. From the match list, I see that the top match is at 27.1 cM. This person has a large private tree, but hasn’t logged in to Ancestry for over a year. This group of matches is a bit of a mystery. I know that this cluster is maternal and probably the Lentz rather than the Rathfelder side as the Rathfelder matches are on the rare side.

Old Cluster and New Cluster

My original AutoCluster was done at conservative default levels and resulted in five clusters.

The old Cluster 1 is found in new Clusters 1 and 4. 2 is now 6 and 27. 3 is now 11. 4 is now 17 and 71. 5 is 19.

AncestryDNA Circles

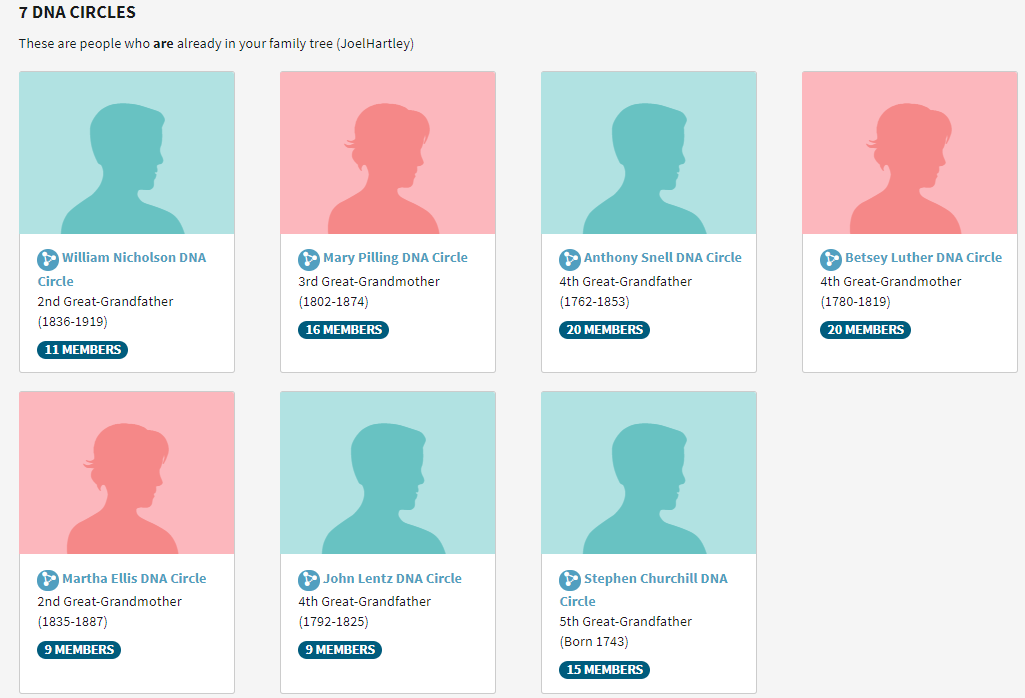
It occurs to me that it would be helpful to compare clusters to the AncestryDNA circles. Here are my circles:

Nicholson, Ellis and Lentz are maternal and the rest are paternal. Nicholson and Ellis are both in Cluster 16. This points out an error I made on my spreadsheet:

I previously had my Nicholson Cluster as 11 and it should have been 16. My mother’s Lentz circle was emerging and the few matches were either not matching me or too low to be in a cluster.

The Mary Pilling Circle is interesting as this goes back to England. However, those in the circle who are not my 2nd cousins are a match to the circle and not to me.

Descendants of Anthony Snell Circle

I have a similar problem here. There are two people who are not second cousins to me that match me by DNA, but they match at levels below 20 cM. If I check the shared matches of one of these matches, I see that he matches Fred from Cluster 30. That is perhaps a hint as where I may find a common ancestor with Fred. Shared matches with another person in this circle also lead me to a three people who are in Cluster 30.

I believe that the Betsey Luther circle is somewhat redundant. She was the wife of Anthony Snell. Finally, the Churchill Circle. I match second cousins and others in the circle match those second cousins or closer matches. If I run clusters for others in my family, these relationships may be helpful.

This shows that three of my circles are associated with my second cousins in Cluster 4. Shared matches from the Snell circle brought me down to Cluster 30. The two circles for my mother’s side were the husband and wife Nicholson and Ellis. My mother had another Lentz circle but the matches were too low for me. When I look at my mother’s matches, I may find closer matches.

NADs and AutoCluster

NADs are New Ancestor Discoveries. Here are my NADs:

I have no idea who these people are.

The Long NAD

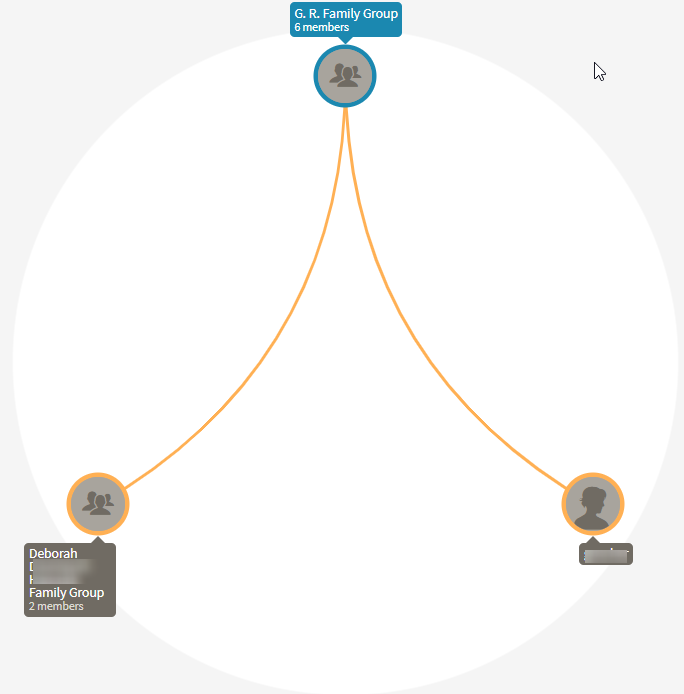
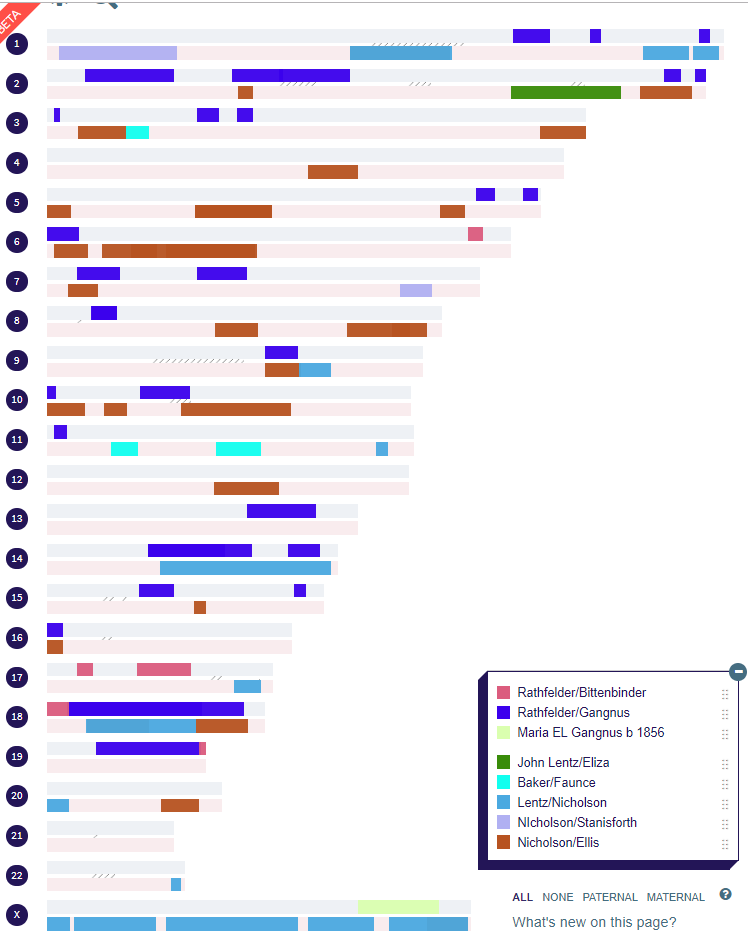
Here are some of the people in the Long NAD:

The orange indicates a match to me. So these are like circles or clusters also. The only difference is that these NADs are pointing to ancestors that I don’t know about. I may not know about them because they may not be my ancestors or the ancestors may be further back than the ones Ancestry is pointing to.

Brenda is in Cluster 7. I didn’t try to identify Cluster 7 above as it wasn’t in the top 23 clusters. This means that I can associate Cluster 7 with my Long NAD. I associate the Long name with Ireland. However, this family was from North and South Carolina. Angela is also in the NAD and in Cluster 7. She also matches Ron who is on my biggest brick wall – the Clarke/Spratt Line. Ron is in Cluster 27. Perhaps that indicates a relationship between these two Clusters. I did find one person who is in Cluster 7 who is not in the Long NAD. I’m not sure why. There are 21 in Cluster 7 and 31 in the Long NAD.

The Weems NAD

John Weems was from Tennessee. I see his connection even less than with Seymore Long. My matches to people in this group, when they do match, are below 20 cM. That means that I don’t have an analogous Cluster to this NAD.

Summary and Conclusions

  • I’m not done playing with AutoCluster yet. There is still more to explore.
  • My original AutoCluster looked at matches between 50 and 250 cM. In this AutoCluster run, I chose limits between 9 cM and 600 cM. The spreadsheet showed matches as low as 9 cM, but the html cluster chart showed matches only down to about 20 cM.
  • As I had so many clusters, I found it useful to look at the clusters with the highest DNA matches. These are the clusters that were, for the most part, easy to identify.
  • I compared the 76 cluster analysis with the 5 cluster analysis I did.
  • AutoCluster does a great job of condensing huge numbers of AncestryDNSA matches and putting those matches into categories.
  • AutoCluster gave me a sense of how many matches I had that were maternal or paternal and from which grandparent side those matches came from.
  • Next, I would like to look at a lower threshold of 25 cM to narrow down the number of clusters that I get.
  • I looked at how AncestryDNA circles related to Clusters.
  • Next I looked at my two NADs. One NAD had an analogous Cluster. The second NAD had matches that were two small and didn’t have an analogous cluster.


Raw DNA Phasing Six Siblings with One Parent – Part 2 Heterozygosity

Homozygosity – Zero to Eighty in One Day

In my previous post, I discussed Homozygosity. In that post, I got my brother Jim from zero phased to 80% phased in one day. Although raw data phasing is considered advanced, the principal of homozygosity is very simple. It just means that you have two alleles at a location that are the same. If your parent has two alleles the same, then you got that allele from that parent’s side. If you have two alleles the same, then you got that allele from both your mother and your father.

Heterozygosity – Two Different Alleles at a Location

Heterozygosity is a little more complicated. It means that you have two different alleles at the same location. Genetics tends to be binary which to me is very simple. Binary is yes or no. You either have XX alleles at a location or XY at a location. A heterozygous results is XY.

Whit Athey and Heterozygosity

Whit Athey has a paper on Raw DNA Phasing here. This is his third principle:

Principle 3 — A final phasing principle is almost trivial, but it is normally not useful because there is usually no way to satisfy its conditions: If a child is heterozygous at a particular SNP, and if it is possible to determine which
parent contributed one of the bases, then the other parent necessarily contributed the other (or alternate) base. This principle will be very useful in the present approach. 

Where is Jim Heterozygous?

I need to look at Jim’s Raw Data File. I’ll ask Access to find Jim’s alleles that are different:

Jim is heterozygous at a little under 200,000 locations:

Where am I going with this? In the last line above, Jim is AG. If I know mom is A, then Jim has a G from Dad at that location.

Getting Dad Alleles From Mom

In this Query, I am taking all of JIm’s Mom allele’s that have no corresponding Dad alleles. These are the allele’s that he got from his Mom being homozygous. Then I linked those results to Jim’s heterozygous results. That ends up looking like this:

There are over 96,000 locations where we can fill in a Dad allele for Jim. In the first line above, Jim has a C from his Mom. Jim’s results are C and T, so the T has to be from Jim’s Dad.

Putting It All Together – Adding Jim to My Other 5 Siblings

I could figure out how to get the T into the JimFromDad Column above. But I really need to get Jim into the Table I already have with his 5 other siblings and Mom. It would be nice to add Mom’s FTDNA results to that table also. Right now that Table has 26 columns and I want to add more.

Here is the structure of the existing 5 sibling table:

I wasn’t too consistent on my capitalization. The sibling Dad alleles are grouped together as are the sibling Mom alleles. This is for comparison. These sets of Mom and Dad alleles will form a pattern that will determine the crossovers. The above table is called tbl5SibsHeteroMomtoDad, so it is at about the same stage that I am with Jim.

I’ll try this query to add in Jim’s Alleles 1 and 2:

Here I made an unequal join, but I don’t think that will work. I want everything from Jim’s list and everything I already had in the 5 sibling list. This will probably call for an Append Query.

In order to perform an Append Query, I need to have the same column headers. I copied the 5 sibling table and pasted it as a six sibling hetero mom to dad table. Then I added some columns for Jim:

I’ll also add some Mom and Dad allele columns for Jim. Next I open up Jim’s original download table into a Query:

I select Append at the top and choose the Table I want the data to be appended to:

I choose View to see what I have and it shows 720,449 records which sounds right. Then I choose Run.

This didn’t get me what I wanted. It added an extra row for Jim. When I sort by RSID, it looks like this:

It is giving Jim an extra row for his results, which I don’t want. Abort this mission.

A Right Join and a Left Join?

I can go back to my original thought. However, it will take two steps.

First I want to note that there are 942,647 rows in the 5 Sibling Table. There are 720,449 in Jim’s raw data table. I don’t want to lose any data along the way. I put an ‘is not null’ into Jim’s allele 1 column and got 720449 rows of data, so one query was enough. I like this so much, I’ll make a Table out of it:

This didn’t work so I tried repairing and compacting the Access database again. That seemed to solve the problem.

Now I have a new six sibling table. For five siblings, I have the Mom and Dad alleles of the first three steps. For Jim, I just have his raw data included so far.

Mom Vs Mom – Ancestry and FTDNA Results

Now I am wondering if I need to add Mom’s FTDNA raw DNA data to my table. Mom has 701,478 rows or positions at AncestryDNA. Mom has 711,398 rows at FTDNA. That is about 9,000 rows difference, so I guess it is worth it. It could make the Table more complicated for comparisons. If I can can combine, mom’s alleles into two columns instead of four, that would be better.

Here is my comparison of FTDNA vs. AncestryDNA for my mom:

This query will return all the RSID’s that are in FTDNA but not at AncestryDNA:

That is over 23,000 results. I will need these, if I am to recreate Jim’s results.

Getting Mom’s Extra FTDNA Results into My Six Sibling Table

First, I created a Query to find out how many RSIDs mom had from FTDNA that were not already in the six sibling table:

This tells me Mom has 17,935 positions tested that are not in the Six Sibling Table. However, if those are positions that Jim has, I will want to add those also. I checked and Jim has 17,835 positions tested out of mom’s 17,935. I was curious, so I checked Jim’s positions that weren’t in the Six Sibling Table and got 20,622. These are the details that bog me down.

Appending to the Six Sibling Table

I want a good Six Sibling Table, so I’ll append the 20,000 positions that Jim has that are not in the table.

Here is my Append Query:

The Query says to add only Jim’s raw DNA data to the Six Sibling Table that isn’t already there. When I view what is to be appended, I get the right amount of rows.

When I hit the Run button, I get this error:

I was wondering if that would be a problem. I don’t want the extra rsid column. I need to save the underlying Query first. I did that and had the same problem, so I made a table out of the Query.

That looks better. I think this will work:

This worked. So now my master table has 963,269 rows. Bigger is better as long as it is good data.

My plan was to add my mom’s alleles, but so far I have only added Jim’s. When I now check the positions that Mom has that are not in the Six Sibling Master Table, I only get 100. There are actually only 99 extra rows as one was a header that I deleted:

I’ll follow the same procedure. I’ll make a small table for Mom and then append it. I’m not sure of the significance, as Mom may have no siblings corresponding to these alleles at this time.

Here is the new Master Table with Mom and Jim appended:

One More Master Table Adjustment

On the Six Sibling Master Table I added a place for Jim Dad and Mom alleles:

I probably should have done this before I phased Jim. However, the advantage is that I have Jim’s results separate from this table that I can check on. I can now re-do the processes to get Jim’s phased alleles or try to copy what I had into this master table. [Note I try to copy Jim’s results below, but the results are not good, so I end up recreating his results in the Master File that has the results of all six siblings in it. See section called Plan B below.]

I’ll try to use an Update Query to get Jim’s phased alleles into this master table.  Here is my Google search for Update Query:

Actually I thought of an easier way:

Here I took the whoe Six Sibling Table and replaced Jim’s phased alleles where he had none. I only get one shot at this, so before I do this, I’ll add Jim’s heterozygous phased alleles to his two homozygous alleles.

An Append Query for All of Jim’s Phased Alleles

I appended Jim’s Heterozygous phased alleles to his homozygous phased alleles.

Here is the point at which Jim’s phased alleles are based on what he got from his mom to what he got from his dad. There are only two problems:

  1. The name of the Table is now wrong, so I need to change it;
  2. I never added in the alleles that Jim got from Dad. That is OK as I have the information to do it.

Adding Jim’s Heterozygous Dad Alleles Based on Mom’s Results

Now I am back to where I was before I took a detour of incorporating Jim and my Mom’s FTDNA results into my existing five sibling table.

Here I’m going to cheat a little and look to see what I did in the past:

Here’s my sister Lori. Back when I knew more what I was doing, I had an Update Query whcih said, ‘When Lori’s allele 1 was not the same as her allele 2 [heterozygous] and Lori had allele 1 from mom, put Lori’s allele 2 in her Dad spot’. Seems like that should work for Jim.

When I press View, I didn’t get any results. I have a guess as to the reason. This may have to do with the situations where Jim got his Mom allele and he had no results for himself. I tried i this different ways and could not get this to work unless I took out the expression: <>[Jimallele1].

This makes me think that something is wrong with the Table. I checked for duplicates in the table and got 96,222.

So this is good to know. At rs1000002 there are two results. One has Jimallele 1 and 2 rfesults and one does not. However, at rs10000300 there are no Jim alleles and there is only one result.

Plan B – Work with the Six Sibling Master Chart

I checked the Six Sibling Master Table for duplicates and didn’t find any. I think I’ll just work with that Table.

Here is Step one from Whit Athey:

Principle 1 — If a person is “homozygous” at a location—that is, having the same base on each of the two chromosomes of a pair, then obviously at that location it is possible to know with certainty that both chromosomes of the pair have that base at that location, but this is an almost trivial form of phasing. 

I had a little practice trying to get the Update Query to work. Now I’ll try it on Jim’s results in the Master File. Unfortunately, I am still getting no results. I decided to go ahead and run the Update Query even though I saw no results in the View mode. This was after making a backup up the Six Sibling Master File. It looks like the update worked.

The Update Query was quite simple. It said if Jim’s allele 1 and 2 were the same, then give that allele to his Dad and Mom side.

Updating Mom’s Homozygous Alleles to Jim

The next Update Query will be similar:

This says if Momallele 1 and 2 are the same, give Jim one of those on his maternal side. Here is the warning:

Here are some of the results.

I hope to catch the blue line in the next query.

Updating Jim’s Heterozygous alleles where Jim has a Mom allele.

This Update Query says when Jim is heterozygous and he already has his allele 1 in the mom spot, put allele 2 in the Dad spot.

I am down to a mere 34,000 rows on this Update.


Next, I want to switch the alleles:

When Jim’s allele 2 is in the Mom place put Jim’s allele 1 in the Dad place. That should fill in these blanks:

Here is a summary of what I have for phased alleles for me and my siblings:

One interesting thing is that Jon has 751,171 maternally phased alleles. Jon only tested at 668,942 positions. The additional results must be where Mom had results at positions that Jon didn’t test at. That is assuming that I didn’t mess up somewhere.

One More Query for Fun

This is looking for childrens’ missing alleles from Mom when Mom has two alleles that are the same. I found a few:

These are likely positions that were not tested by my siblings. I made a quick Update Query to add those Mom alleles in for my siblings.

Summary and Conclusions

  • I started out looking at my brother JIm’s heterozygosity. I found out where he could have an allele assigned to his paternal side in the case where we knew his materal allele.
  • I worked on getting Jim’s results into the master file I have for his other 5 siblings. I also added some more of my mom’s alleles that were from FTDNA and not included in her previous AncestryDNA resutls.
  • I tried to get JIm’s alleles phased before I brought them into the five sibling file, but I ended up with duplicate results.
  • I decided to work with the Six sibling file which had no duplicates and recreate Jim’s phased alleles based on the principles of homozygosity and heterozygosity. I was able to do this quickly with Access Update Queries.
  • I now have a large master file with 30 columns. These columns have the raw data for my mom and her six children as well as their alleles that have been phased so far. I will be working with the last 12 columns in the upcoming Blogs. These are the patrernally and maternally phased alleles. They will form patterns that will tell me where the crossovers are.


Raw DNA Phasing Six Siblings with One Parent – Part 1 Homozygosity

I have written many Blogs on raw DNA phasing with my siblings and my mother. I have done this phasing using a Whit Athby paper and MS Access. I had my last sibling tested this past Summer, so thought I would see how his phasing would work using this method. The goal of this phasing would be to get four files of data representing the DNA from my four grandparents. I have four such files already, but they were created by M MacNeill a while ago and he didn’t have all my siblings’ data at the time. I would like to learn how to upload these files on my own.

Jim’s Raw DNA

Jim was my last brother to be tested. He was tested at FTDNA as that was the kit I had at the time. The first step is to find Jim’s DNA download from FTDNA and extract it. However, before I do that, I need to know what build to download. As I look at my old blogs, it appears that I was working in Build 37. Gedmatch has historically used Build 36. However, Gedmatch is being migrated to Genesis. Here is a comment I found on Facebook:

All Genesis tools natively work in B37 *meaning that all matching is done based on B37), but we decided to map all of the B37 positions to B36 and B38 when printing out segment start/end positions, with the choice given to the user which to display.

We will begin to migrate this to other tools as soon as we can. I hope you find it useful.

Build 37 DNA

All this to say that I want Build 37. I assume that I used Build 36 for Gedmatch, so I’ll do a new download for Jim:

I chose Build 37 Raw Data Concatenated. Unfortunately, my computer wants me to find an app to extract this file.

In the past, I have used Notepad, so I’ll try that. The gz file is about 6.4 MB. I can see Notepad was the wrong thing to open this with:

So I guess I need Winzip. I downloaded that and then opened Jim’s file. It opened as a csv file, but I saved it as an Excel File as that is what I will be using in Access. Jim has double A DNA:

Actually the DNA at the first position of his tested Chromosome was AA. He got an A from his dad and an A from his mom. Jim has a lot of DNA

This shows that Jim has 720,450 tested DNA positions. That is pretty good. However, there are some positions that don’t have results indicated by –. Between my mother, me and my five siblings there are about 4 million autosomal results to look at.

One thing that I notice that is different from this AncestryDNA file:

AncestryDNA has a separate column for allele 1 and allele 2. That would be better for me as I am trying to separate these alleles out.

This looks better. However, when I try to import this into Access, I get this error:

My guess is that Access does not like the dashes where there are no results. So I’ll take out every dash in Jim’s DNA results. That was close to 60,000 dashes. I tried that, but I still got the error. One on-line suggestion was to compact and repair the database. That seemed to work, but there was this problem:

I didn’t realize that there was a new header at line 702542. That imported like this:

Also for the AncestryDNA files, the X Chromosome shows as Chromosome 23, which should work better. My import to Access took out the ‘X’. After I removed the internal header and changed the X Chromosome to 23, I imported Jim’s raw DNA with no problems.

Giving Jim some Maternal DNA

Now Jim’s DNA is in shape for doing something with it. The next step is pretty simple. Every time my mom has two alleles that are the same, we know that allele is maternal for Jim. I originally tested my mom at FTDNA, so it would make sense to download her DNA from there.

Importing Mom’s DNA to MS Access

I already learned a few things from downloading JIm’s DNA from FTDNA. I used the same steps for my mom, except that I didn’t delete the dashes to see if that would make a difference. That gave me an error, so I deleted the dashes. Now I am in business.

My mom has 711,398 locations tested at FTDNA. This is a bit less than Jim’s  720,450 tested locations.

Next, I want to see what happens if I compare Mom’s ID’s with Jim’s ID’s:

Here at Access I have an equal join between the RSID fields of both tables. That results in 709,632 positions that Jim and Mom have in common. When I compare the positions between the two, I get 712,452. That is more than my mom had, so that doesn’t make sense. Actually, I shouldn’t be comparing by position, because those are positions along each of the 23 chromosomes. There may be repeats. That is good to know.

Where is Mom Homozygous?

If Mom’s Allele #1 is the same as Allele #2, that is called homozygous. I’ll perform this simple query on Mom:

I asked Access to show my where my Mom’s Allele 2 is the same as Allele 1:

Mom has that in 500,995 places. However, next, I need to get rid of the blanks:

I added Is Not Null to the criteria on the Result Column:

That gets me down to 496,136 homozygous positions. That means that more than 2/3 or almost 70% of Mom’s results are homozygous. Those are the alleles that will be Jim’s maternal alleles.

Where is Jim Homozygous?

Where Mom is homozygous, we’ll add a Mom allele to JIm. But first, where Jim is homozygous, we will add a Mom and Dad allele. I created a simple query in Access:

I’m creating two new columns for Jim. One will give me the alleles that Jim got from his Dad and the other will give me the alleles that Jim got from his Mom. In the criteria row I have that Jim’s allele 1 must equal Jim’s allele 2. When that happens, put in Jim’s allele 1 into the column. That gives me this:


That gives me over 500,000 rows of paternal and maternal alleles for Jim. However, I do have blanks. When I filter the blanks out, I get 491759 rows. That is a fast way to get almost 1 million alleles for Jim. Next, I’ll make a table of this query in Access. When I do this, I notice that Access has changed my query:

Access liked this better as it was simpler. I would think that JImallele2 does not have to be there twice, so I took one out and got the same result:

Access is trying to teach me to make better queries.

Adding Maternal Alleles from Mom

Here is a summary of where we are for Jim:


Just by assigning Jim’s own homozygoius alleles to his paternal and maternal sides, he is now 71% phased. I also see that mom had 496,136 homozygous alleles. These need to be added to Jim’s homozygous results. However, I want to be careful:

  • When I add Mom’s alleles, I don’t want to erase the ones I already gave to Jim
  • There may be homozygous alleles that mom had that Jim didn’t even test for. These could be added to Jim as bonus alleles.
  • In adding mom’s homozygous alleles to Jim’s list, we also have to add in where the position of those alleles are on the Chromosome and the RSID.

First, I note that mom has 496,136 homozygous alleles. This is more than Jim’s homozygous alleles.

First, I’ll create a query for Mom’s homozygous alleles.

Here I want there to be a non-blank result and I want Mom’s allele 1 to be the same as allele2.

Next, I’ll check to see how many of Jim’s homozygous alleles are the same as mom’s homozygous alleles.

I’ll do this by an equal join on the RSID which is a unique identifier. Here is what I get from this query:

However, there are still blanks there. I had trouble getting rid of the blanks, but I can temporarily get rid of them by filtering the results.

This gets rid of about 17,000 blanks.

This tells me that Mom has 496,136 homozygous alleles, but 381,721 of those Jim already has. That means we need to add 114,415 maternal alleles to Jim’s list. That would get his AllelesFromMom up to 606,174.

Next, I want to get a list of all of Mom’s homozygous alleles that Jim doesn’t have, so we can add them to Jim’s list. There is a little trick to getting this in
Access. First I create an unequal join:


On the query above on the left are all of Mom’s homozygous alleles On the right are Jim’s homozgous alleles that match Mom’s homozygous alleles. The #2 radio box is checked. That means I want everything on Mom’s side and everything where the RSID’s are equal. However, in the criteria, I’ll put an ‘is null’ on JIm’s side:

This adds 97,451 of Mom’s homozygous alleles to JIm. This is less than the 114,415 that I was looking for. One guess is that these are positions that Mom had tested that Jim did not. Somewhere I lost 7,000 of Mom’s homozygous alleles. Or this may have to do with the blanks in some of the tables. I was able to get rid of the blanks in Jim’s table and the new number came out right:

Adding 114,000 Maternal Alleles to Jim

Now that I’ve found 114,000 maternal alleles for JIm, I’d like to add them to his table. There are probably a few ways to do this in Access. One way is called Append Table. I’ll try that as I will need that later on in the process. If only I remembered how to do that. I could put Jim’s table into Excel and just add Mom’s table. However, I’m not sure Excel will appreciate the large files.

The directions that I found for Append Query said to use the data you want to copy first. That was in this Query:

What I want to add is from a Query called Mom Homo Jim Missing. These were Mom’s extra alleles. I chose to append these to a table called Jim Homozygous. But on second thought, I want it going to a new table, so I’ll copy Jim Homozygous and call it Jim Plus Mom Homozygous. First I want to review the results using the view button. I guess it looks right. It only shows the records to be added. Then I push Run and I get a warning saying that this cannot be undone.

Here is what the Appended Table looks like:

This is the point at which the appending took place. What I wasn’t expecting was that Access added the ID. This is the ID that Access originally assigned to the raw data. So now I have Jim’s ID’s and Mom’s ID’s in the same Table.

Phased Allele Update Alert

These two operations based on homozygosity alone put Jim’s phased alleles at over one million. Bing, bing, bing. Jim is already almost 80% phased. Maternally, he is close to 88% phased.

Other Phasing – Visual

I’m not the most experienced raw data phaser in the world, but I have worked on three, four five, and now six sibling raw data phasing. I have also done a lot of work with three, four, five and six sibling Visual Phasing. Here is Chromosome 1 using the Steven Fox Spreadsheet:

I can use the raw data phasing to confirm the Visual Phasing. I can also use the Visual Phasing to know where to look for crossovers. For example, I already see a problem with the map above in the bottom right corner. I will need to change the crossover designations there.

The other reason stated at the top of the Blog is that I should be able to create a file to upload to Gedmatch for each of these four grandparents. That could make searching for DNA matches easier.

Summary and Conclusions

  • I started phasing the sixth of six siblings based on homozygosity.
  • Using homozygosity alone, I got my brother Jim up to 80% phased.
  • Raw data phasing is considered an advanced topic, but the basics are quite simple. If you have two alleles that are the same, one must be from your father and one from your mother. If you are a parent and you have two alleles that are the same, you had to have passed down that same allele to your child.
  • I also used MS Access which is best suited for large databases.
  • My goal is to get four grandparent files to upload to Gedmatch (or Genesis). In the past, I have run out of steam on these projects.
  • I will be able to use my past work on visual phasing as a roadmap to finding crossovers and assigning grandparents.
  • I should be able to use my past raw data phasing experience to streamline the process.
  • With six siblings, I am expecting good results. However, as in the Visual Phasing process, the more siblings you have, you will have more combinations of sibling comparisons you have to look at.
  • Next up, I expect to look at heterozygosity.


Fun With an AncestryDNA Lentz Circle

My Lentz Line has been difficult to nail down. The genealogy has been difficult and it has been difficult to assign a lot of DNA to Lentz ancestors

My Lentz Circle at AncestryDNA

Ancestry has been helpful in the Lentz area. Here are my AncestryDNA Circles:

Lentz is one of my smallest circle with 9 members:

Six of those 9 members are from my family. That leaves two other groups with a total of three people in them. In the Deborah Family group, there are two Deborah’s. They appear to be mother and daughter. I built out the tree of the mother and found a common ancestor in John Lentz. Then I found the tree of the daughter Deborah and she had already built out her tree as seen here:

John Lentz is on the younger Debbie’s mother’s father’s father’s line or her great-grandfather Davenport’s Line. This matches up well with my Lentz Web Page:

I was unclear as to whether John had one or two wives. Debbie has identified the wife as Elisabeth Riehl. I didn’t follow the line down of William Andrew. However, I have more information on my Ancestry Tree, which puts my Web Page out of date:


Lentz DNA

One interesting thing is that I do not match either Deborah at AncestryDNA. They do, however, match my mother and some of my siblings. Here is my mom’s match with the elder Deborah:

What is more interesting is that the younger Debbie uploaded her DNA results to Gedmatch. This is what the match looks like between Debbie and my Mom:

By DNA, my mom, Gladys and the younger Debbie could be fourth cousins. However, Debbie and her mom match my mom at about the same amount of DNA. That means Debbie’s mom passed down all the Lentz DNA that matches my mom to her daughter. This DNA match is on the shortest Chromosome.

Visual Phasing for My Siblings – Chromosome 22

I performed visual phasing on my DNA. Here is what I had for Chromosome 22:

This matches up with what Gedmatch shows as Debbie’s matches with my family:

In this case the reportable matches start at about 15M, so that is where Jim, Heidi and Lori have Lentz DNA shown in green on the left hand side of my Chromosome 22 map above.

A Lentz DNA Tree

I have drawn a tree of the Lentz descendants who have had their DNA tested. I had missed Debbie, so she is not there yet:

I am on the left side of the tree. I also descend from the Nicholsons and get a lot of matches with that family. The right side of the tree is more specific as I have no Nicholson relatives there, but the relationships are further out. I am already tracking two people from the William Andrew Line there.

Here are the two Deborah’s added in:

This shows that my mom is a fourth cousin to the elder Deborah and I am a 5th cousin to the younger Deborah.

Here is how Debbie matches Radelle, Al and Stephen on Chromosome 12:

This suggests triangulation between these four people which would indicate a common ancestor:

My mom matches Radelle and Deborah, but on different Chromosomes. Hence, the Ancestry Circle.

Painting Debbie’s Match to My Mom

This is what I had previously for my mom’s John Lentz DNA based on her match with Radelle. That match is in dark green.

I need to add Mom’s Lentz DNA to Chromosome 22:

This doesn’t look like much, but it doubles what my mom had on Chromosome 22 previously.

Summary and Conclusions

  • Reviewing my AncestryDNA Circles lead me to a Lentz descendant who I had overlooked.
  • One of the people in the Circle had uploaded her DNA to Gedmatch. I had seen her match before, but didn’t know exactly how we connected on my mother’s line.
  • Because Debbie uploaded her DNA to Gedmatch, I was able to tell exactly where she matches different Lentz descendants.


My Children’s Maternal Genealogy – Part 5: Gately

In my previous Blog, I showed that John Edward Cavanaugh’s mother was Louisa Gately.

Louisa Gately is my children’s maternal 2nd great-grandmother. I find it interesting that many records I’ve seen for Louisa show that she was born in England and that her dad was born in the West Indies or Jamaica and her mom was born in Ireland.

Here is Louisa Gately in 1860 Lowell:

Even though I mentioned Louisa was said to have parents from the West Indies and Ireland, this census has them as being from England. Louisa was part of a good-sized family. There appears to be 24 years between the oldest and youngest child. This means that Mary married very young, or William remarried. This Census seems to indicate that her parents were both born in England.

Five years earlier in 1855, the family was living in the house of Thomas Freeman in Lowell:

In Louisa’s marriage record, she gives her mother’s name as Catherine. This is perhaps a different person than the Mary listed above.

The last Census Louisa appeared in was in 1920:

Here Louisa is with her Daughter Ellen and niece Ellen A Ryden or Byden. This Ellen may have been the daughter of Ellen Gately who was Louisa’s sister or half sister.

Ellen A Ryden

The older Ellen A Ryden died on March 1, 1901. Her parents were listed on that record:

This gives us a mother for Louisa.

Tracing the Gately’s Across the Ocean to England

The next step is to see where the Gately’s lived in England. This must be the family on Regent Road in Salford:

Here is current day Regent Road to the West of Manchester, England:

This record gives a further refinement on Louisa’s mother’s name:

It appears that Catherine Etherington died in Lowell 15 years after she married in Manchester, England:

William Gatley/Gately Born About 1815 in the West Indies

It appears that William Gately (or Gatley) married three times and died in Lowell on July 25, 1895. Here are his parents listed on his death record:

I see them as Joseph and Jane Savage. They were both born in England, so may be possible to trace. I’ll check William’s other two Lowell marriages. William’s third marriage was in Lowell in 1874. He married:

Elizabeth’s last name is transcribed as Kate. Interestingly her mother was a Hartley. William’s parents are just given as Joseph and Jane.

Here is William’s 2nd marriage:

This is the Mary we see in the Lowell Censuses. Again, William’s mother is Jane. Int means publishment of intention of marriage. Perhaps William’s mother’s name was given as Frances in that publication. I also see what looks like an ‘I.’. Perhaps this means Ireland. If that is the case, the William was from Ireland but in the intentions of marriage record, he is from the West Indies. I suppose that both could be true.

Here is part of William’s Oath of Allegiance:

It looks like William signed his name more as Geatley than Gately. Here is the family in 1850:

William’s Parents: Joseph Gatley and Jane Savage

In the 1841 Census for Salford, England, William was listed as a Gatley, so I’ll go with that. A logical place to look for Joseph and Jane is in a marriage record. Here is one possibility:

Here a Joseph Gatliffe married Jane Savage on June 5, 1808. The timing seems right and Gatliffe sounds close to Gatley.

Here is Leigh – 9.5 miles West of Manchester:

I searched for births to Joseph and Jane Gatley in Lancashire County and came up with one:

Perhaps the family moved to the West Indies, had William and moved back.

Warrington is between Liverpool and Manchester.

An Ancestry Clue

Here is an Ancestry Tree Hint for Joseph:

I have two choices here. I can accept the hint, or I can not accept it. If I don’t accept it, then I’ll have to do my own research. I think I’ll accept the hint. It seems reasonable. The names are right and I have already come across the places of Salford and Warrington. I can only assume that James had children and some of his descendants either looked up his ancestry or kept track of family history.

Once I entered James Gatley in the tree, I got this further hint:

It seems like James was a fustian cutter, so this occupation must have run in the family. I found a question on-line from Andy who was wondering what his fustian cutting ancestors did and he got this answer:

Hi Andy

Fustian Cutter / Weaver 
A person who lifted and cut the threads in the making of Fustian, formerly a kind of coarse cloth made of cotton and flax. Now a thick, twilled cotton cloth with a short pile or nap, a kind of cotton velvet. A long thin knife was inserted into the loops and the threads cut as it was pulled through, stretched between rollers. The cloth was then brushed to raise the pile. Fustian is the old name for corduroy / A weaver of Fustian 

best wishes & happy hunting 🙂
Lynda 

A Summary for Agnes Cavanaugh

In this Blog, I looked at Agnes’ father’s mother’s line which was Gately or Gatley in England. Possibly even Gatliffe.

I had shown previously that  John E Cavanaugh’s mother was a widow when he was born.

The Warren Family

My top guess for John’s father is John J Warren. I don’t like seeing the Potential Father above as it gives a bad hint, so I’ll add John Warren in:

Here is some more on John Warren:

John died two years after Louisa’s son John was born in an accidental drowning. The death was recorded in Amesbury and John Warren lived in Lowell. The death record gives John’s parents as Jeremiah and Mary Warren. They were both from Ireland.

James had an older brother Jeremiah. Here is the family in 1855:

There were no women in this house at the time of the State Census.

This also fills in all eight maternal second great-grandparents for my children, Heather and JJ:


Summary

  • My children have roots in Lowell
  • The Gatley’s or Gately’s were fustian cutters in the area of Manchester, England before coming to the US
  • I haven’t found records tracing Louisa Gatley’s father to the West Indies or records of her mother from Ireland.
  • William Gatley lived quite a long life. A bit of a sketch could be written up about him.
  • I’m starting to look into the Warren family. They appear to also have Irish roots.


Leeds Color Analysis at Gedmatch

I have created Leeds Color Analyses at AncestryDNA, FTDNA and MyHeritage. I thought that I would try a Color Analysis at Gedmatch. Gedmatch has DNA results from 23andMe, AncestryDNA, FTDNA and MyHeritage, so it will be interesting to compare the results.

Adding Color to Gedmatch

I’ll start by going down my One to Many Match List at Gedmatch:


The people above the green box are too closely related to work for the Leeds Method. The people in the green box share great grandparents with me on my Hartley side.

Leeds Method for the Hartley’s

I’ll put my Gedmatch number in the first spot and my father’s cousin Joyce’s Gedmatch number in the second section:

Choosing ‘Display Results’ gives me this:

There are perhaps 100 or so of these results. The way these people match me are on the first ‘Shared’ column. The way they match Joyce is found in the second column marked ‘Shared’. I would like to go down to about 15 cM with my matches. The problem with this list is that there are no names. I do, however, have Gedmatch numbers and emails. I copied my shared matches with Joyce that matched me down to 15 cM. That was 151 matches.

Working with MS Access

It seems that I need to work with MS Access to make this easier. Unfortunately, I’m a little rusty at Access. First I set up a new database in Access. Then I imported my 151 matches with Joyce into Access. Then I copied my ‘One to Many’ match list at Gedmatch into Excel and took out the columns I didn’t need. Then I imported that spreadsheet into Access also. It sounds like a lot of work, but it saves time in the long run.

My pared-down Gedmatch Spreadsheet looks like this:

It’s too difficult to get rid of the buttons, check boxes, and arrows, so I just leave them there.

Here is what my two tables look like in Access:

I just need to connect these two tables by the Gedmatch ID#. That will create a new table with the Gedmatch ID# and name.

Here is the design of my query:

The ID is the Gedmatch # from the People Who Match Both Kits (me and Joyce). One thing that was important was that I added a ‘Y’ in the Hartley column. That was in lieu of a color.

When I view the results, I get this:

I now have Gedmatch ID, name, match amount to me and that they are in the Hartley group. Access tells me I have 151 people in this Query. This saves looking up 151 Gedmatch ID#s and copying and pasting the names into a table.

Carolyn and the Nicholson Clan

The next non-Hartley on my ‘One to Many’ list is Carolyn. I followed the same procedure for Nicholson, but this time I added in whether the match had a tree at Gedmatch:

Anita and Rathfelder Matches

I did the same for Anita. I chose down to 10 cM on the people that matched both Anita and myself but got this as a result in my Access Query:

The query showed only the results above 15 cM. This is because my One to Many List at Gedmatch only includes 2,000 matches.  Currently, my smallest match on the One to Many list is 13.4 cM. There are a few ways around this. One is to use the Tier 1 list of matches. Another would be to use a list of my maternal matches. However, I will just keep this small list for now. So far, the only problem I see using this method is that I don’t include the original person that I was comparing everyone to. So I need to go back into my list and add in Anita, Carolyn and Joyce.

Emily – Frazer and McMaster

Emily and I share Frazer and McMaster Ancestry. I am able to find 443 matches shared between Emily and myself. These matches correspond with my FTDNA AutoCluster Analysis:

The Frazer cluster above is the first orange one. It corresponds to many matches on Chromosome 20. When I add all these matches, this is what I get:

  • One surprise is that Judy who is the lead person for Lentz/Nicholson also shows up in the large Frazer/McMaster group. When I run my paternally phased kit, I don’t see Judy on my match list, so there must be some glitch there.
  • I am somewhat skeptical of all the green matches.
  • The column with the GED/Wiki information should come in handy.

Summary and Conclusions

  • I was able to satisfy my curiosity as to what a Leeds Color Analysis would look like for my Gedmatch matches.
  • I have made sure that some of my most important matches are posted at Gedmatch.
  • This is a good baseline analysis. It may be possible to improve on this analysis by use of paternally and maternally phased results.
  • After seeing the results, it turns out that my Rathfelder cousin Catherine had a slightly higher match with me than Anita, so I could have used Catherine’s results to come up with the Color Analysis.
  • Using MS Access sped up the process in creating this Gedmatch Color Analysis.
  • It would probably help to have an extra column to indicate which matches have a common ancestor with me. Or these people could be highlighted in some way.

I took my advice from the last bullet:


One other anomaly was the that the highlighted Lentz/Nicholson common ancestor for Joshua came out as a blue Hartley shared match. Perhaps there was some glitch with Gedmatch. Below a match level of 30 cM, it is difficult to find common ancestors with a few exceptions.


Leeds Color Analysis on My MyHeritage Matches

I have had good luck with MyHeritage matches. I have matches there that I don’t have at other places.

Adding Color to My MyHeritage Matches

I’ll start with my father’s first cousin Joyce. She will represent my Harltey side. Actually, her brother Jim will also represent the Hartley side. I went down a ways on people who matched Joyce and me like this:

Technically, I think that I’m supposed to look at each of these matches and see who their top match is. Next, I went through some shared matches between Joyce’s brother Jim and me. This added a few people and got me up to 50 Hartley shared matches.

Two Sisters on my Rathfelder Side

I have the same situation on my Rathfelder side. I’ll start with Anita and then add in some of Inese’s matches that Anita didn’t have with me:

If I want, I can sort these by the DNA match amount to get them back into order.

Ronald on the Clarke and McMaster Side

Ronald is the next match out. He is at the level of third cousin on the Clarke side and fourth cousin on the McMaster side, so he is doubly related. A lot of DNA analysis has to do with putting matches into groups.

I’m surprised by all the matches. I have only looked at three groups and I already have 121 matches. I did include Ronald’s two children, which I didn’t really need. I kind of like doing the color analysis this way, as I am starting out with people I already know about.

Molly – I Know, But I Don’t Know

I know that Molly matches on my mother’s maternal side. However, I do not have a tree for Molly, so I don’t know exactly where she fits in. Molly triangulates with Danielle at MyHeritage. Danielle also has a tree which I will look at. In fact, I’d like to try to build out Danielle’s tree. I built her tree out, but didn’t find the connection. One of the problems is that her match level is lower than that of Molly’s. This just confirms that I need to keep this match at a generic Lentz grandparent level for me. I feel like this match cluster is very mysterious. The match with Beth indicates a Lentz/Nicholson connection, but I didn’t see this connection with the other matches.

Sandra – From the Netherlands

I need to get to Sandra from the Netherlands, because I have a cousin that I tested after her. Her relative (Great Aunt?) married someone after WWII and moved to the US, if I remember correctly. I think that these last two groups are Lentz:

Cousin Paul on the Frazer Line

Emily matched Paul but was already taken by Ron above. That is OK because the Ron lighter green group is Clarke/McMaster. The darker green group is Frazer/McMaster. Both Paul and Emily descend from Frazer and McMaster. Emily has to match Ron on the McMaster side, because Emily is not related to the Clarke family.

Kathleen and a Hartley England Cluster

Part of the reason I look at DNA is to break down a brick wall on my English Hartley side. Kathleen appears to match the English ancestors of my Hartley’s, though perhaps not the Hartley’s themselves.

Here is a respectable 192 matches in colored clusters:

  • The Lentz group tends to be mysterious. I don’t know a lot about that group.
  • The first Hartley group and the last Hartley group don’t match each other. That is probably because the first group has Colonial Massachusetts roots and the last one represents Hartley ancestors in England. My Hartley line came to the United States after the US Civil War.
  • One good thing about this method is that it starts with a match that is somewhat known or well-known and then drills down to the matches of that match.

I can sort the matches by the highest matches to lowest matches to get a more traditional looking Leeds Color Chart:

There are more Rathfelder matches in orange at the bottom because I brought those matches out a little further than the other groups.

Summary and Conclusions

  • Performing a Leeds Color Analysis on my MyHeritage matches showed some interesting results. It appears that the matches were more evenly spread out among my four grandparent groups. I don’t know if this is because MyHeritage matches are more representative of my four grandparents or because of the way I performed the Leeds Method.
  • This Leeds Color Analysis was inspired by the AutoCluster Method that recently came out. The AutoCluster method does not cover MyHeritage at this time, so it is worthwhile to perform a Leeds Color analysis at MyHeritage.
  • The analysis brings up questions and avenues of research to further pursue. The method shows what I don’t know, but it also seems to bunch ancestors together. For example, it seems to separate out my paternal grandfather’s colonial ancestors from his Lancashire, England ancestors. Likewise, it appears to separate out two Lentz Lines, but the distinction there is less clear right now. The distinction may between the Lentz/Nicholson line (the Nicholson’s came to the US from Sheffield, ENG in the late 1800’s) and the older US Colonial Lentz and collateral lines.
  • Next – A Leeds Color Analysis at Gedmatch


Making Sense of My FTDNA AutoClustering with a Leeds Color Analysis

AutoClustering is a new approach to looking at DNA matches. The progamming was created by Evert-Jan Blom. Right now the analysis is working better for FTDNA than it is for AncestryDNA. In a previous Blog, I looked at my 23andMe and FTDNA clusters, but had some trouble identifying many of the clusters. I was hoping that a Leeds Color Analysis would shed some light on my Clusters.

FTDNA AutoClusters

These are the 33 Clusters I came up with at FTDNA. I decided that FTDNA pads their DNA a bit. This padding problem blew up my orange Cluster 1 where there are a ton of matches on my Chromosome 20. These are on my Frazer grandmother’s side.

Here is a summary of some of my AutoClustering that I did previously:

The FTDNA results are in the middle column. It looks like I figured out 6 of the 33 Clusters.

Can the Leeds Color Analysis Help Figure Out More Clusters?

The Leeds Color Analysis also creates clusters, though not as graphically as the AutoCluster method. The good thing about the Leeds method is that it doesn’t rely on a  computer program and it requires some interpretation from the user. These could also be considered negatives.

Here is what I came up with using a Leeds Color Analysis of my FTDNA matches:

  • The first time a name came up as a match I gave them the color over their name.
  • If someone matched someone who matched someone up higher in the Cluster, I noted this on the spreadsheet.
  • I went out as far as FTDNA’s predicted 2nd to 4th cousin matches. This was 88 matches.
  • This represents 21 Clusters. Some are not technically clusters as there is only one person in the cluster. I assume that if I went to lower cM matches, I would get more matches in these one person ‘clusters’.
  • I identified three out of four of my grandparents

Starting with Hartley

In the Leeds Analysis, I used my father’s cousin as the lead Hartley person. He did not show up in the AutoClustering as he was too close a DNA match compared to the thresholds I used. However, the second person in the Blue column is Benjamin. He matches my father’s cousin Jim and becomes the lead person in the AutoClustering. A search for Benjamin in the AutoCluster shows that he is in Cluster #10.

Cluster 10

The problem is that Cluster 10 only has three people in it:

In the Leeds Color Analysis, there were 20 in the Blue column. When I go to my match with Benjamin at FTDNA and choose ICW, I get three people. So that makes sense. This is just one flavor of Hartley. A look at the ancestral names of these matches makes me think that this could be a Colonial SE Massachusetts branch. I’ll call this a Snell/Bradford Line as that covers all my Colonial ancestors:

I could be wrong, but that is my best guess right now. Next, I filtered for Hartley (blue on the Color Analysis) and added a column for the AutoCluster number to keep track of the Cluster number:

The other two people in AutoCluster #10 were not in the Leeds Color Analysis.

Going Down the Blue List

It would seem logical to go down the Blue list and put an AutoCluster numbers in for each person. I find the results interesting:

I would trust the Clusters except for #6 as that shows more than one color. I was a bit surprised that they didn’t all relate to AutoCluster numbers. I’m not sure why that is. Part of the reason is that I went by FTDNA predicted relationship and AutoCluster probably goes by total DNA match in cM.

I plugged these number back into my AutoCluster Summary:

Notice that I had one Hartley in Cluster 4 which I previously had as Frazer. Turns out that was a mistake and she should have been in Cluster 2. It all works out. It turns out I made another mistake and there is no obvious Hartley Cluster 8.

Corrected FTDNA Cluster Summary

I suppose it would be possible to further break down the Hartley into Colonial or non-colonial, but I’ll hold off on that for now. The Hartley List worked well, so I’ll move on to Frazer.

Plugging Leeds Frazer Colors Into AutoCluster

Here is what I get:

Again, I’m unsure why the people at the bottom of the list are not in clusters. The Clusters I found were not shared with other colors, so that was good. Now I feel like I am getting somewhere:


These are different flavors of Frazer in green. I also have Clarke who was my Frazer grandmother’s mother from my last look at AutoCluster. Frazer’s married Frazer’s. Frazer’s married McMaster’s who married McMaster’s. It gets complicated.

I now have 13 out of 33 Clusters identified. That is a good start. I have other ideas on how to identify other clusters, but that can wait for now.

Summary and Conclusions

  • I got stuck trying to identify many of my AutoCluster results from FTDNA.
  • Using the Leeds Color Analysis, I was able to put many matches into two major grandparent categories. I was able to cross-reference these matches to the AutoCluster.
  • My next idea is to use chromosomal analysis to identify the clusters. By this, I mean that I will compare the matches to my visual phasing results. This should get the clusters into the correct grandparent area.


My Mother-In-Law and Her FTDNA AutoClustering

Joan’s Genealogy

I find Joan’s DNA fun to work with. Even though Joan has Canadian background, she has no French Canadian which can muck up the works. I don’t mean to sound prejudice in a DNA sort of way. Joan is 1/4 Newfoundland, 1/4 Daley which is from Nova Scotia and the other half is from Prince Edward Island. Out of Joan’s four grandparents, the Daley side seems to be most obscure. However, the Newfoundland side is problematic due to poor records there. The Church in Harbour Buffet burned down at one point.

  • Ellis and Rayner – PEI
  • Upshall – Newfoundland
  • Daley – Nova Scotia

AutoClustering Joan

For some reason, Joan’s results came through as untitled text files:

I was able to change the first two files to csv files and the last one to an html file and that solved the problem. I chose a range between 12 and 400 cM.

How Many Clusters?

Joan had so many clusters that they ran off the graph:

I’ll say Joan has over 80 clusters. 

This represents about the first 25 of Joan’s clusters. Here is the total at the bottom of the report:

I forgot that FTDNA add small segments to make the matches larger, so I should have had a higher bottom cutoff point.

Joan’s Cluster #1 – Newfoundland

A journey of 1,000 miles starts with one step. Joan’s top match is Ken. I’ve looked at his DNA before and had trouble figuring out where all of his DNA came from. If you look real close, you will see Ken’s grey dots going toward other clusters. Those are other places where he is related to Joan. I mentioned that French Canadians mucked up the works with intermarriage. This would be true of islands also – like Newfoundland and Prince Edward Island.

Joan’s #1 AutoCluster Match: Ken

Ken and Joan both descend from Christopher Dicks born in the 1780’s and his wife Margaret. I have run a DIcks DNA project and I recognize a lot of people in this Cluster.

Joan and Nancy

I didn’t recognize Nancy’s name in the group. Here is her tree:

I don’t get a lot of Upshall leads, so this is interesting. I assume that Nancy also has Dicks ancestry at some point. See, AutoClustering leads to good things.

That was quite easy. Here is the spreadsheet I use to keep track:

Cluster 2: PEI

I recognize some PEI descendants in Cluster 2. I have written about Glenda. She descends from Elllis and Rayner and matches Joan equally on those lines. That means I need to look at other Cluster 2 people and their trees.

Barbara and Lee

Barbara and Lee from Cluster 2 both have McArthur or MacArthur in their trees. That would seem to favor the Ellis side over the Rayner side:

However, I am just matching surnames, I am not matching actual shared ancestors. That would take more work.

Agnes’ Tree

It seems that there a lot of good trees at FTNDA. Agnes matches on the Rayner side.

Agnes’ maternal side has an Edward Rayner. His parent are the Edward John Rayner and Mary Watson in Joan’s tree. Of course, that favors the Rayner side. However, I note that there is an Ellis on Agnes’ Rayner side also.

Jane’s Tree

Here is where I need Ancestry to pull the trees together for me:

Jane has McArthur and Ellis on her paternal side.

I guess I’ll call this cluster Ellis/McArthur for now.

I spent a bit of time on this cluster, but it is Joan’s second largest cluster.

Joan’s Cluster Three People Don’t Look Familiar

Unlike the first two clusters, I don’t recognize these matches. There were four trees for the 13 people in this cluster. I think I’ll skip this one. By the little dots to the left and above this cluster, I would say there is some connection to the previous PEI cluster. It seems like an odd group. At least one tree was from New Zealand and one was from Ireland.

Skipping on to Cluster 4

As I look at the names and trees, it appears that this Cluster is from Newfoundland. I’ll just call this a Newfoundland Cluster:

That also gave me an idea for a name for Cluster 3.

DNAPainter to the Rescue?

I’m getting stuck on these Clusters, so I’ll take a look at what I have already painted for Joan. Here is the key to Joan’s painted Chromsomes:

One problem I see with this is that DNAPainter takes from many places – not just FTDNA.

Melissa in Cluster 34

Melissa has a common ancestor of Ellis/Gorrill with Joan.

I’m not so sure about the other two matches in the group. So I didn’t find a lot by that method.

The Clicking on Trees Method

Next, I’ll just click on trees to see if anything shows up. This resulted in a few general discoveries. I then clicked on the highest cM button to try to overcome FTDNA’s over-counting of their DNA matches.

Here are some of the clusters partly identified:

Summary and Conclusions

  • I had trouble finding specific ancestors for many of these clusters. I think it may be related to FTDNA having higher cM matching than is warranted. This may be partially fixed by raising the lower threshold to 20 cM when running an AutoCluster Report at FTDNA.
  • At Joan’s 2nd great-granparent level, I can identify 16 ancestors. In this analysis, I got 92 clusters. That is too many. 
  • Even though the cluster identification was difficult, it was good to take a fresh look at Joan’s FTDNA through the eyes of AutoClustering. I have at least one new lead to follow up on.
  • Another issue that makes Joan’s cluster identification difficult is that her ancestors come from two islands: PEI and Newfoundland. There was some intermarriage going on there. Joan is also once quarter from Nova Scotia. I’m not aware of intermarriage there, but matches with these relatives are relatively rare (no pun intended). 

AutoClustering My Wife’s Aunt’s Ancestry DNA

My wife’s father had his DNA tested at FTDNA before he passed away. I also had his two sisters’ DNA tested at Ancestry. I’ll use his sister Virginia’s AncestryDNA results for Autoclustering as a stand-in for my later father-in-law Richard.

AutoClustering Virginia

I could have picked either sister, so I picked Virginia for no special reason. Actually, my thought was to pick Lorraine, as she is closer in age to Richard, but I picked Virginia. I chose a low threshold of 12 cM for the AutoClustering.

First the Genealogy

Virginia and siblings have half French Canadian and half Irish DNA. In my experience, the French Canadian DNA tends to take over. This is due to the common ancestry of French Canadians, and many descendants who have tested.

The top part of the tree is Irish and the bottom is French Canadian. I am more interested in the top because there are some missing black arrows. Those are the places where there are missing ancestors. The ancestry is filled in to the level of 2nd great-grandparents. The column on the right represents third cousin, but in many matches this should show as third cousin, once removed.

Looking at Virginia’s AutoCluster

Here is the key for Virginia’s Clusters:

The Key is on the Chart, so there are grey dots representing those that didn’t fit well into the clusters. Cluster 1 is no doubt French Canadian. Between Cluster 18 and 19, the cluster size goes down from three to 2. These numbers do not include Virginia who is in every cluster.

Name That Cluster

The game is to name the clusters. Before I do that, I notice that there are not too many grey dots between the first and second Cluster. I take that to mean that these two groups are not closely related. Perhaps the green Cluster is Irish and the orange is French Canadian.

Identifying Cluster #1

This should be easy as there are so many people. First I go to the list of people below the chart and search for Virginia’s second cousin Fred who is an avid genealogist. He is there in Cluster #1.

Fred’s shared ancestors with Virginia are here:

However, there are 120 members in Cluster #1. Next, I went down the list of people in Cluster #1. The last person I had notes for was Girard. Here is Michel’s Shared Ancestor Hint (SAH) with Virginia:

Michel has 72 people in his tree. The problem with that is that Michel and Virginia could have shared ancestors on other lines. Here is Louis Marie Henri Girard and his wife on Virginia’s tree:

I would say that Louis Girard is a hint as to where the cluster is going. I’ll try another SAH. The next person going up the list has six SAH’s and a large tree. Here is the most likely source of the DNA that is shared between Virginia and this match:

These matches so far tend to be around the bottom of Virginia’s French Canadian Tree:

I’ll try one more. The next SAH has over 1,000 people in his tree and his common ancestor with Virginia is Francoise Gagne:

So far, I would say that these are all ancestors of Elizee Fortin and Rosalie Gagne. It is even possible that I could name this Gagne/Girard if the person with six SAH’s has an ancestor there. It turns out our six-matcher has these ancestors also:

That means I would tend to call this a Gagne/Girard Cluster. I like to get the name as far back as possible to be the most specific name for the cluster.

I’ll look at one more SAH to make sure. Lucie has a good tree, but six SAH’s. For some reason her first hint puts her at 6th cousin once removed to Virginia and her second hint puts her at 6th cousin to Virginia. I’ll choose the 6th cousin which goes to Pierre Girard and Marie Anne Vesina. This ancestral couple is also on the Gagne/Girard Line. This is not a life or death decision, so I’ll go with the Gagne/Girard Label for Cluster #1:

That’s one down and 33 to go. I like to keep track of these clusters in a spreadsheet:

This way I can expand to the right for Richard at FTDNA eventually.

I’m Guessing Cluster #2 Is Irish

However, as I look at my notes nicely displayed by AutoCluster, I see that this cannot be:

This means that the LeFevre side is not as closely matched to the Pouliot side as the Pouliot side matches some other names. This makes sense also.

Name That Cluster #2

It is obvious that Cluster #2 is on the LeFevere side. However, I want to be more specific as in Cluster #1 above. The match at the bottom of the list shows a SAH of Maguerite Anger. The husband is not shown as he is shown as marrying her three times. However, I assume that the husband should be there also:

The husband is Joseph Methot. I am now just showing the line of Virginia’s LeFevre grandfather Joseph Martin as we know that this cluster is along the LeFevre Line. If I were to name this Cluster based on a sample size of one, it would be Methot/Anger. However, I want to be more sure and it is easy to look at these SAH’s by just clicking on a link from the AutoCluster list of matches in Cluster #2.

Going up the Cluster 2 Match List from the bottom, the next SAH is here:

This brings the name of this cluster one generation towards the present:

Based on a sample size of two, I would name this cluster LeFevre/Methot.

I’ll call in Jane for a tie-breaker:

I can see that Jane adds evidence to my previous guess:

Cluster #3 – French Canadian?

By looking at the Cluster Graph above, it appears that the red cluster will be more closely allied to the Pouliot side. There are not as many linked trees for Cluster #3:

Judy has an unlinked tree:

Cousin Fred is not in this Cluster even though he is closely related. This could be a case that he is too closely related to Judy. Judy’s tree shows that she is a second cousin to Virginia on the Pouliot/Fortin Line. This seems to be the best name for this Cluster:

Cluster 4 – Slim Pickings on Trees

Cluster 4 has very few linked trees:

The match names appear to be French Canadian, so that is a hint. The largest tree above is private. From the above three clusters, it appears that I am getting different flavors of French Canadians. Match #3 has a small unlinked tree:

I really don’t want to build out this tree, though I could. I see Gobeil in Virginia’s tree here:

Alexandre is Virginia’s match #6 on Cluster 4. He also has an unlinked tree:

Here is another small tree from Match #8:

Again, I’m not willing to build out his tree. Match #9 had an unlinked tree and Match #10 had a small tree, but they were not helpful. I’ll go with Pouliot/Gobeil for now.

Cut to the Irish Side

This is going slowly, so I’ll start looking for Irish matches. Here is a Leeds color analysis that I did for Virginia about three months ago:

I need to pick out some of these green and blue matches and see where they cluster. The first match is Donna. She matches at 417.5 cM, so this is a case where I set the upper limit too low. The four in a row green Kerivan matches are also all too high for the upper match limit that I picked. Here is part of the tree of the first Butler match that didn’t get filtered out:

The common ancestors are Edward Butler and Mary Crowley. This match is in Cluster 12:

Based on the notes, I can see that I have been tracking three out of four of these matches. I wrote a message to John to see if he has any family history. It may be that he pre-dates the Butler/Crowley connection by one generation.

This Butler/Crowley Cluster is small, but important.

Is There a Kerivan in the House?

The green in the Leeds Color Analysis above stands for Kerivan. Here are some Kerivan descendants in Cluster 11:

I have written about Gaby already as a Kerivan relative. She is Thomas’  Aunt. Here is the tree showing how Virginia and Gaby connect:

Virginia is a second cousin once removed to Gaby and 2nd cousin twice removed to Thomas. Here are the common ancestors on Virginia’s tree:

David: Match #2 in Cluster 11

Here is David’s tree on his maternal side:

I am interested in David’s tree enough that I will build it out a bit. I’m curious to find the common ancestors. I start with David and mark the tree private at Ancestry.  Here is David’s maternal grandmother Joan Kerivan in 1940 Newton, Massachusetts:

Here I use a split screen for working on David’s tree. The tree I am making is on the left and David’s tree is on the right:

I accepted Ancestry’s Joseph Edward Kerivan hint but not his wife as it was different than what David had. It seems like it should be an easy tree. I have the DNA match, the Kerivan name and the right area (Newton, MA).

Here’s David’s great-grandfather in 1910:

Next, Joseph’s birth record comes in handy:

I see on George E Kerivan’s marriage record, that his parents are John Kerivan and Alice. These are the couple that I am looking for. Here is part of my selective tree for David:

Alice is no doubt my wife’s ancestor Alice Rooney.

As an added bonus, I color-coded the Clusters in my summary spreadsheet based on my wife’s Aunt’s grandparents. These are the same colors I used in the Leeds Color Analysis.

The clusters are now taking shape. The magnitude of the French Canadian matches compared to the two Irish clusters is obvious.

Comparison with the Leeds Color Method

Next, I put the cluster names by the appropriate names from the previous Leeds Analysis I did:

I see that one of the people from the Butler Cluster was not in this analysis, so he must have gotten his test results since I did this analysis three months ago. The first green block that doesn’t have an assigned cluster represents Russel. Russel is in Cluster 7.

Cluster 7 – Kerivan?

Here are Virginia’s seven Cluster 7 relatives:

Here is Russell’s tree on his mother’s side:

Time for a Quick Tree for Russell

I found this hint at Ancestry for Thomas Kerivan:

This gets me to where I want to be. Here is my quick tree for Russell:

One might wonder why there is another Cluster for this same couple. It could be that one Cluster is Kerivan and one is Rooney.

Here is Sandra. She has the same mother as Russel, so I could have saved myself some time:

Actually, there is a Rooney in this cluster, so I’ll call this the Rooney/Kerivan Cluster.

There are a few new people in the Rooney/Kerivan Cluster that I should get in touch with.

Cluster 19 – A Butler Cluster on the Outskirts

Here are Brian and Michael:

I associated Brian with the Butler family due to a shared match with Patty. Neither Brian nor Michael have family trees, but it would be worthwhile to follow up with these two.

My guess is that the Cluster 19 Butler predates the Cluster 12 Butler/Crowley families. This is a good place to be as I am trying to pin down a place in Ireland where the Butlers came from.

Where is Patty?

One Butler DNA match I have been tracking is Patty. I couldn’t find her in the AutoCluster. Based on her shared matches at AncestryDNA, I would have expected her to be in Cluster #12. AutoCluster provides a list of names that didn’t match other people. I didn’t see her in that list either.

Summary and Conclusions

  • AutoCluster by Genetic Affairs continues to be a fun and useful tool to use to sort through your DNA matches.
  • The program is similar to the Leeds method but is more useful and takes the guesswork and human error out of the equation for the most part.
  • AutoCluster gives a visual as to where the bulk of the DNA matches are
  • In this Blog AutoCluster highlighted some important new matches. It would be worthwhile to contact these new matches.
  • The list of people in the Ancestry Clusters is especially helpful. I can click on each name and quickly go to their AncestryDNA match and see if they have a SAH or linked or unlinked tree.
  • Even though AutoCluster is one of the best things since sliced bread, it is not perfect. I could not find Patty in the clusters. Also the runs that I get are spotty. It seems to work about half the time for me. I would like to get better results at Ancestry for myself and my mother, but am not able to get results at the thresholds that I want. It may be that these glitches will be fixed as this is such a new tool.