AutoClustering is a new approach to looking at DNA matches. The progamming was created by Evert-Jan Blom. Right now the analysis is working better for FTDNA than it is for AncestryDNA. In a previous Blog, I looked at my 23andMe and FTDNA clusters, but had some trouble identifying many of the clusters. I was hoping that a Leeds Color Analysis would shed some light on my Clusters.
FTDNA AutoClusters

These are the 33 Clusters I came up with at FTDNA. I decided that FTDNA pads their DNA a bit. This padding problem blew up my orange Cluster 1 where there are a ton of matches on my Chromosome 20. These are on my Frazer grandmother’s side.
Here is a summary of some of my AutoClustering that I did previously:

The FTDNA results are in the middle column. It looks like I figured out 6 of the 33 Clusters.
Can the Leeds Color Analysis Help Figure Out More Clusters?
The Leeds Color Analysis also creates clusters, though not as graphically as the AutoCluster method. The good thing about the Leeds method is that it doesn’t rely on a computer program and it requires some interpretation from the user. These could also be considered negatives.
Here is what I came up with using a Leeds Color Analysis of my FTDNA matches:

- The first time a name came up as a match I gave them the color over their name.
- If someone matched someone who matched someone up higher in the Cluster, I noted this on the spreadsheet.
- I went out as far as FTDNA’s predicted 2nd to 4th cousin matches. This was 88 matches.
- This represents 21 Clusters. Some are not technically clusters as there is only one person in the cluster. I assume that if I went to lower cM matches, I would get more matches in these one person ‘clusters’.
- I identified three out of four of my grandparents
Starting with Hartley
In the Leeds Analysis, I used my father’s cousin as the lead Hartley person. He did not show up in the AutoClustering as he was too close a DNA match compared to the thresholds I used. However, the second person in the Blue column is Benjamin. He matches my father’s cousin Jim and becomes the lead person in the AutoClustering. A search for Benjamin in the AutoCluster shows that he is in Cluster #10.
Cluster 10
The problem is that Cluster 10 only has three people in it:

In the Leeds Color Analysis, there were 20 in the Blue column. When I go to my match with Benjamin at FTDNA and choose ICW, I get three people. So that makes sense. This is just one flavor of Hartley. A look at the ancestral names of these matches makes me think that this could be a Colonial SE Massachusetts branch. I’ll call this a Snell/Bradford Line as that covers all my Colonial ancestors:


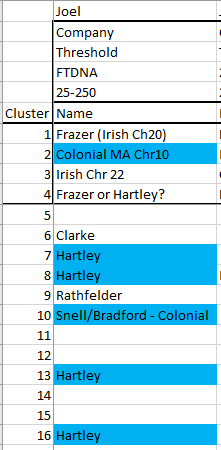
I could be wrong, but that is my best guess right now. Next, I filtered for Hartley (blue on the Color Analysis) and added a column for the AutoCluster number to keep track of the Cluster number:

The other two people in AutoCluster #10 were not in the Leeds Color Analysis.
Going Down the Blue List
It would seem logical to go down the Blue list and put an AutoCluster numbers in for each person. I find the results interesting:

I would trust the Clusters except for #6 as that shows more than one color. I was a bit surprised that they didn’t all relate to AutoCluster numbers. I’m not sure why that is. Part of the reason is that I went by FTDNA predicted relationship and AutoCluster probably goes by total DNA match in cM.
I plugged these number back into my AutoCluster Summary:
Notice that I had one Hartley in Cluster 4 which I previously had as Frazer. Turns out that was a mistake and she should have been in Cluster 2. It all works out. It turns out I made another mistake and there is no obvious Hartley Cluster 8.
Corrected FTDNA Cluster Summary

I suppose it would be possible to further break down the Hartley into Colonial or non-colonial, but I’ll hold off on that for now. The Hartley List worked well, so I’ll move on to Frazer.
Plugging Leeds Frazer Colors Into AutoCluster
Here is what I get:

Again, I’m unsure why the people at the bottom of the list are not in clusters. The Clusters I found were not shared with other colors, so that was good. Now I feel like I am getting somewhere:

These are different flavors of Frazer in green. I also have Clarke who was my Frazer grandmother’s mother from my last look at AutoCluster. Frazer’s married Frazer’s. Frazer’s married McMaster’s who married McMaster’s. It gets complicated.
I now have 13 out of 33 Clusters identified. That is a good start. I have other ideas on how to identify other clusters, but that can wait for now.
Summary and Conclusions
- I got stuck trying to identify many of my AutoCluster results from FTDNA.
- Using the Leeds Color Analysis, I was able to put many matches into two major grandparent categories. I was able to cross-reference these matches to the AutoCluster.
- My next idea is to use chromosomal analysis to identify the clusters. By this, I mean that I will compare the matches to my visual phasing results. This should get the clusters into the correct grandparent area.